
tools spotlight

-
US Economy: Inflation at the Gates?
September 9, 2021, 7:27 AMAs signs point toward a recovering US economy, Fed Chair Powell is still pushing his transitory narrative. Is high inflation temporary?
With inflation burning throughout the U.S. economy and the Fed confident that it can contain the flames, Chairman Jerome Powell remains married to his “transitory” narrative. And after he cited wage inflation as “moderate” – even though consolidated average hourly earnings increased by 4.3% year-over-year (YoY) and leisure & hospitality wage growth soared by 10.3% YoY on Sep. 3 – Powell often peddles semblance over substance.
To explain, I wrote on Sep. 2:
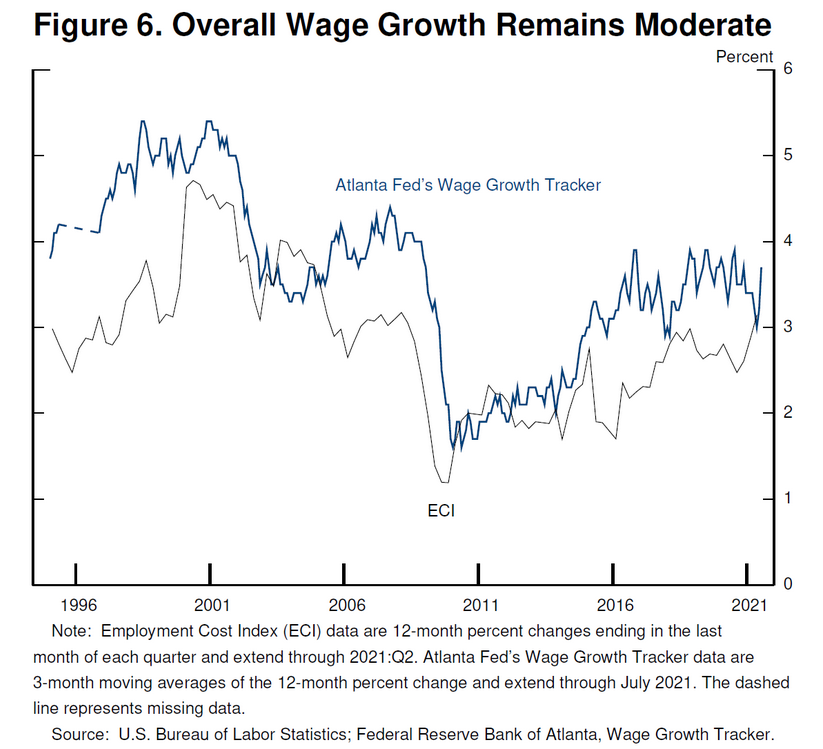
While Fed Chairman Jerome Powell said at the Jackson Hole Economic Symposium on Aug. 27 that “we see little evidence of wage increases that might threaten excessive inflation,” the year-over-year (YoY) percentage increase in the Employment Cost Index (ECI)in the second quarter (3.55%) was the highest since 2002. For context, Powell actually cited the Atlanta Fed’s wage tracker and the ECI to support his conclusion.
Please see below:
Moreover, while fiction remains his novel of choice, wage inflation has accelerated even more since his speech. For example, Walmart – the largest employer in the U.S. – announced on Sep. 2 that in-store employees will receive a raise of at least $1 per hour, which increases the retailer’s average hourly wage to $16.40.
Likewise, with an abounding labor shortage, Southwest Airlines Co-CEO Gary Kelly said on Sep. 2 that “ground ops is where we’re finding the greatest competition for workers. The fact that we can hire one or two is encouraging, but you still can’t grow any faster than the slowest group.” Similarly, Thomas Rajan, VP of global talent at American Airlines, added that “you need this aggressive ground game to go where candidates are, and it is absolutely -- I hate to characterize it as a battle, but it is.”
Thus, with the airline industry aiming to hire thousands of pilots and flight attendants – not to mention baggage handlers, ticket/gate agents, cabin cleaners, aircraft fuelers and individuals that restock galleys – does it seem likely that wage inflation will abate anytime soon?
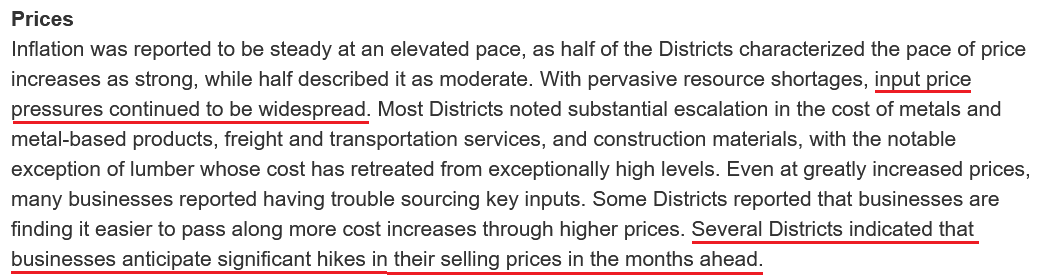
To that point, the Fed released its Beige Book on Sep. 8. And with “persistent and extensive labor shortages” causing “an acceleration in wages,” the inflationary wildfire continues to spread:
“With persistent and extensive labor shortages, a number of Districts reported an acceleration in wages, and most characterized wage growth as strong—including all of the midwestern and western regions. Several Districts noted particularly brisk wage gains among lower-wage workers. Employers were reported to be using more frequent raises, bonuses, training, and flexible work arrangements to attract and retain workers.”
What’s more, with wage inflation only playing second fiddle to input inflation, supply chain disruptions and material shortages have the inflationary merry-go-round still running extremely hot.
Please see below:
 Source: U.S. Fed
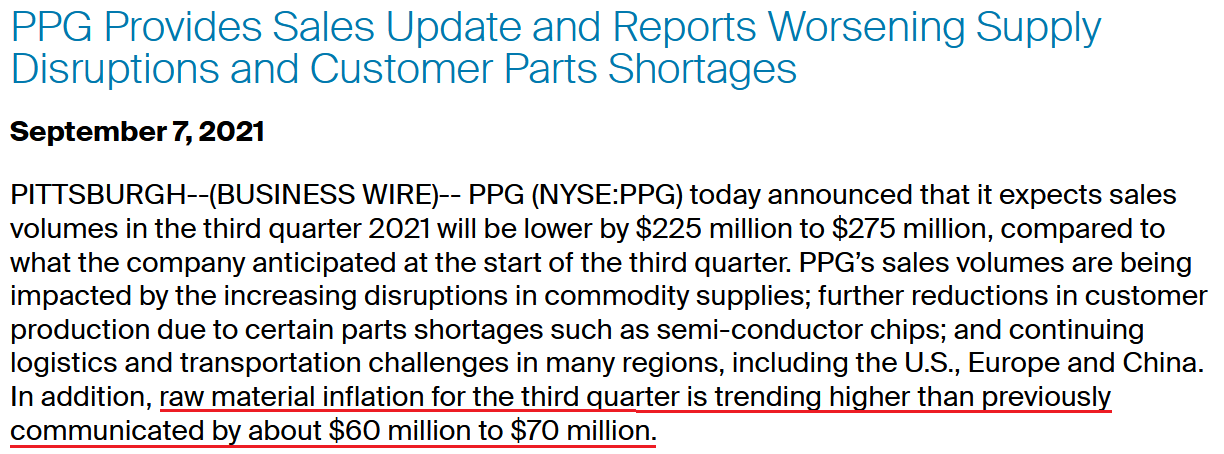
As further evidence, PPG Industries – a global supplier of paints, coatings, and specialty materials (and a member of the S&P 500) – announced on Sep. 7 that it’s withdrawing its “previously communicated financial guidance for the third quarter and full-year 2021.”
And why is that?
“The coatings commodity supply disruptions have further deteriorated since the company’s earnings announcement on July 19, due to several additional force majeure declarations and lower material allocations from certain suppliers. The company also continues to assess the full impact of Hurricane Ida, which could include additional supply chain effects.”
Please see below:
 Source: PPG
In addition, while I’ve been warning for months that inflation would come in much hotter than investors expected, upside surprises remain abundant even as economists increase their expectations. For context, an upside inflation surprise occurs when the realized data exceeds economists’ consensus estimate.
Please see below:
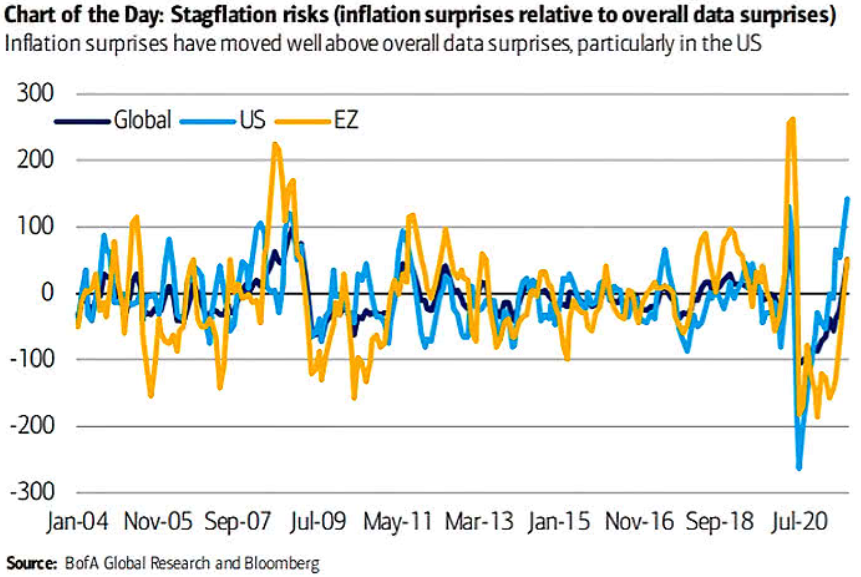
To explain, the light blue line (U.S.) above tracks inflation surprises relative to overall data surprises (like retail sales, GDP, nonfarm payrolls etc.). If you analyze the right side of the chart, you can see that inflation surprises are still rising. Moreover, as the Delta variant cools the denominator – with economic mobility stifled due to the outbreak – coronavirus disruptions only accelerate the inflationary momentum. As a result, the pricing pressures are unlikely to subside until the Fed tapers its asset purchases and reduces speculation in the commodities market.
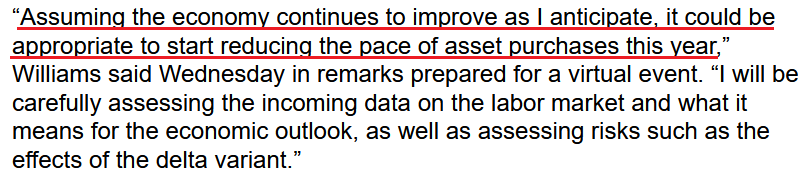
To that point, New York Fed President John Williams (a major dove) admitted on Sep. 8 that “I think it’s clear that we have made substantial further progress on achieving our inflation goal, [though], there has also been very good progress toward maximum employment, but I will want to see more improvement before I am ready to declare the test of substantial further progress being met.”
However, with U.S. job openings coming in at 10.934 million vs. 10 million expected on Sep. 8 (another all-time high), there are now 2.232 million more job openings in the U.S. than citizens unemployed.
Please see below:
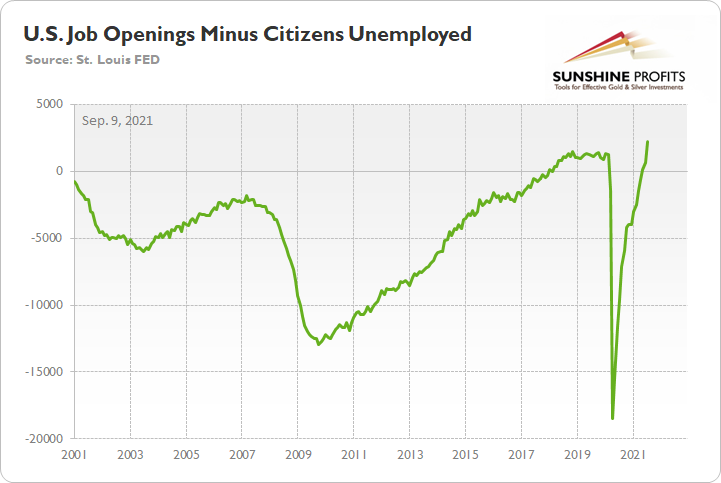
To explain, the green line above subtracts the number of unemployed U.S. citizens from the number of U.S. job openings. If you analyze the right side of the chart, you can see that the epic collapse has completely reversed, and the green line is now at an all-time high. Thus, with more jobs available than people looking for work, it’s only a matter of time before “substantial further progress” materializes.
And what does all of this mean for Williams’ taper timeline?
 Source: Bloomberg
For context, “to start reducing the pace of asset purchases this year,” an announcement will have to commence in September or November to provide investors with “advance notice.”
On the other side of the coin, the European Central Bank (ECB) will release its monetary policy statement today. And with ECB hawks reemerging in recent weeks, bullish bets on the EUR/USD have become fashionable once again. Moreover, because the currency pair accounts for nearly 58% of the movement of the USD Index, monitoring the situation is quite prudent.
Please see below:
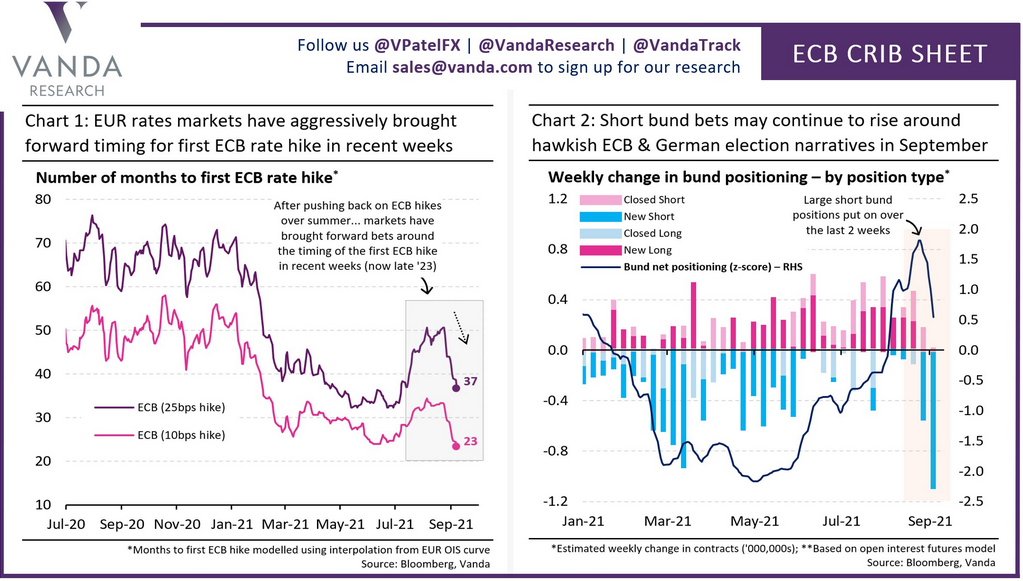
To explain, if you focus your attention on the chart on the left, the purple and pink lines track investors’ expectations for when the ECB will announce its first rate hike. If you follow the sharp drop in recent weeks, investors now expect that the ECB will hike interest rates by 25 basis points (the purple line) in 37 months instead of 50. Similarly, if you turn to the chart on the right, the long blue bar furthest to the right depicts how speculators’ short positions of German Bunds have surged over the last two weeks (expecting a hawkish uprising in interest rates).
However, if the ECB remains dovish and disappoints, the bullish bets could unwind, and the EUR/USD could suffer. And with German economic confidence declining for four-straight months, a hawkish shift by the ECB would be playing with fire.
To explain, I wrote on Jun. 9 and updated monthly:
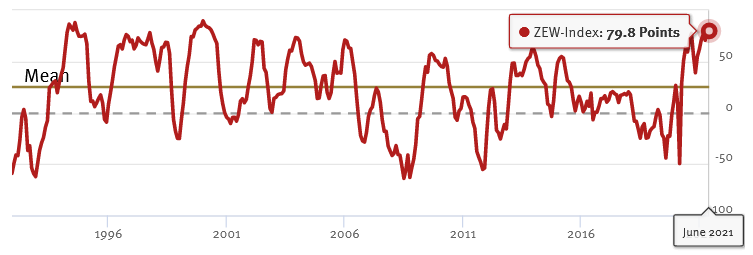
While investors continue to buy hope and sell reality, rather than rising to 86.0 (the consensus estimate), the German ZEW Economic Sentiment Index (released on Jun. 8) fell from 84.4 in May to 79.8 in June. For context, Germany is Europe’s largest economy.
Please see below:
 Source: ZEW
To explain, the red line above tracks the German ZEW Economic Sentiment Index. If you analyze the behavior, you can see that 79.8 is still well above its historical average. More importantly, tough, notice how abnormally high readings are often followed by swift reversions? And with the prior high (84.4) only superseded by 2000, there is an awful lot of optimism already priced into the EUR/USD.
To that point, if we fast forward to Jul. 6, the German ZEW Economic Sentiment Index sunk to 63.3. And following right along, the EUR/USD ended the Jul. 6 session at its lowest level since Mar. 24.
Please see below:
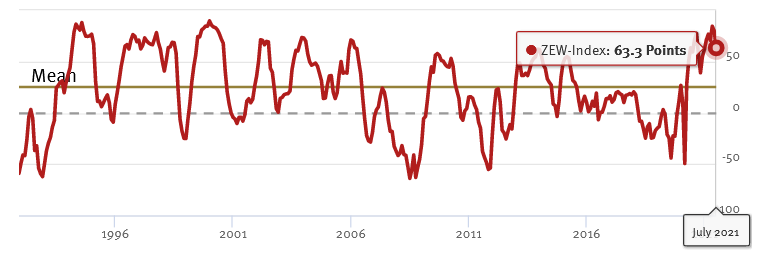 Source: ZEW
Now, with August’s reading falling off a cliff, the German ZEW Economic Sentiment Index (released on Aug. 10) fell to 40.4 – its lowest level since November 2020.
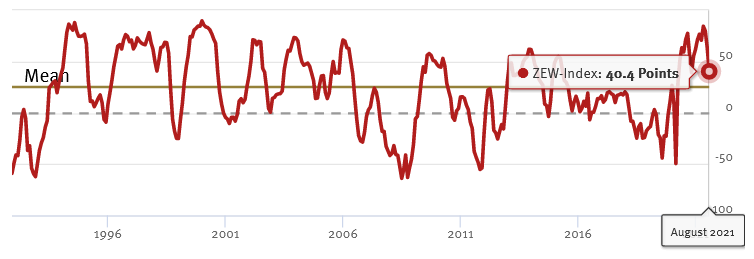 Source: ZEW
And with another month on the books and another new low, the German ZEW Economic Sentiment Index (released on Sep. 7) fell to 26.5 – its lowest level since coronavirus-induced lockdowns plagued the region in March 2020.
Please see below:
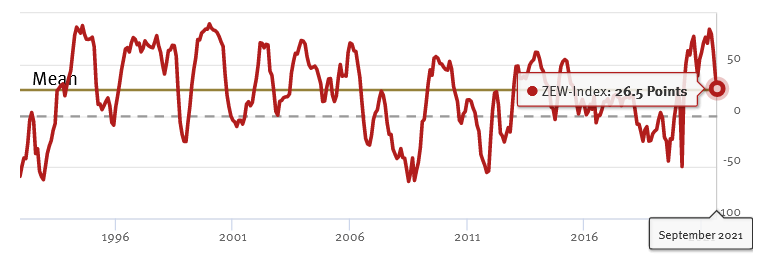 Source: ZEW
ZEW President Professor Achim Wambach provided the following context:
“Expectations fell markedly once more in September 2021. Although financial market experts expect further improvements of the economic situation over the next six months, the expected magnitude and the dynamics of the improvements have decreased considerably.”
The bottom line? If the ECB decides it’s time to scale back its stimulus, the central bank would be tightening at a time when economic confidence in Europe’s largest economy is at its worst. As a result, the medium-term shock to realized GDP will likely outweigh any short-term benefits that the EUR/USD may accumulate.
In conclusion, gold continued its downtrend on Sep. 8 and the GDXJ ETF (our short position) maintained its relative underperformance. And with the S&P 500 showing signs of slippage and the Fed’s dual mandate poised for completion over the medium term, upside catalysts for the PMs remain few and far between. As a result, the bearish implications remain intact, though a buying opportunity could emerge in December.
Thank you for reading our free analysis today. If you enjoyed it, I have great news for you! As soon as you sign up for our free mailing list (mostly about gold, but with extra analyses of stocks and crude oil), you'll get 7 days of completely free (no-obligation). Sign up today.
Sincerely,
Przemyslaw Radomski, CFA
Founder, Editor-in-chief -
Gold Price Dip: What Happened After U.S. Labor Day
September 8, 2021, 7:51 AMOn Friday, gold soared based on the surprisingly weak jobs report. This week, gold declined over 1.5x as much as it rallied on Friday, and it happened based on… no news announcement. I wrote multiple times in the past that gold doesn’t need a trigger to decline if it’s clear that it really wants to do so based on its trend and its relative strength (or lack thereof) compared to things that should make it move higher. Yesterday’s decline serves as a perfect confirmation. What happened? Nothing. How did gold react? It declined by over $30 from Friday’s close.
Ok, it’s not 100% correct that nothing happened. U.S. Labor Day happened, and I previously emphasized how very likely it was for gold to decline after this day, based on a very specific and efficient cyclicality.
Quoting my September 1 Gold & Silver Trading Alert:
The cyclical nature of many areas of life is present in the markets, and it is usually the case that the seasonal factors have only a mild effect on the prices and other factors are much more important, as they are specific to a given situation. Sometimes, however, we have a recurring event that’s so precise in its implications and so accurate that its importance could dwarf other techniques.
This could be the case with gold’s post-U.S.-Labor-Day performance.
A poet might say that at that time a golden dolphin jumps joyfully into the air, shining briefly in the evening sun, preparing for a deep and dangerous dive.
A data scientist might say that 10 out of 10 efficiency with regard to short-term implications and 8 out of 10 performance with regard to medium-term implications is something that seems opposite to the efficient market theory, even in its weak form.
And a trader might say “great! let’s make some money on it!”
I’ll let you be the judge as to which approach is best, while I will feature my observations regarding gold’s price performance around the U.S. Labor Day.
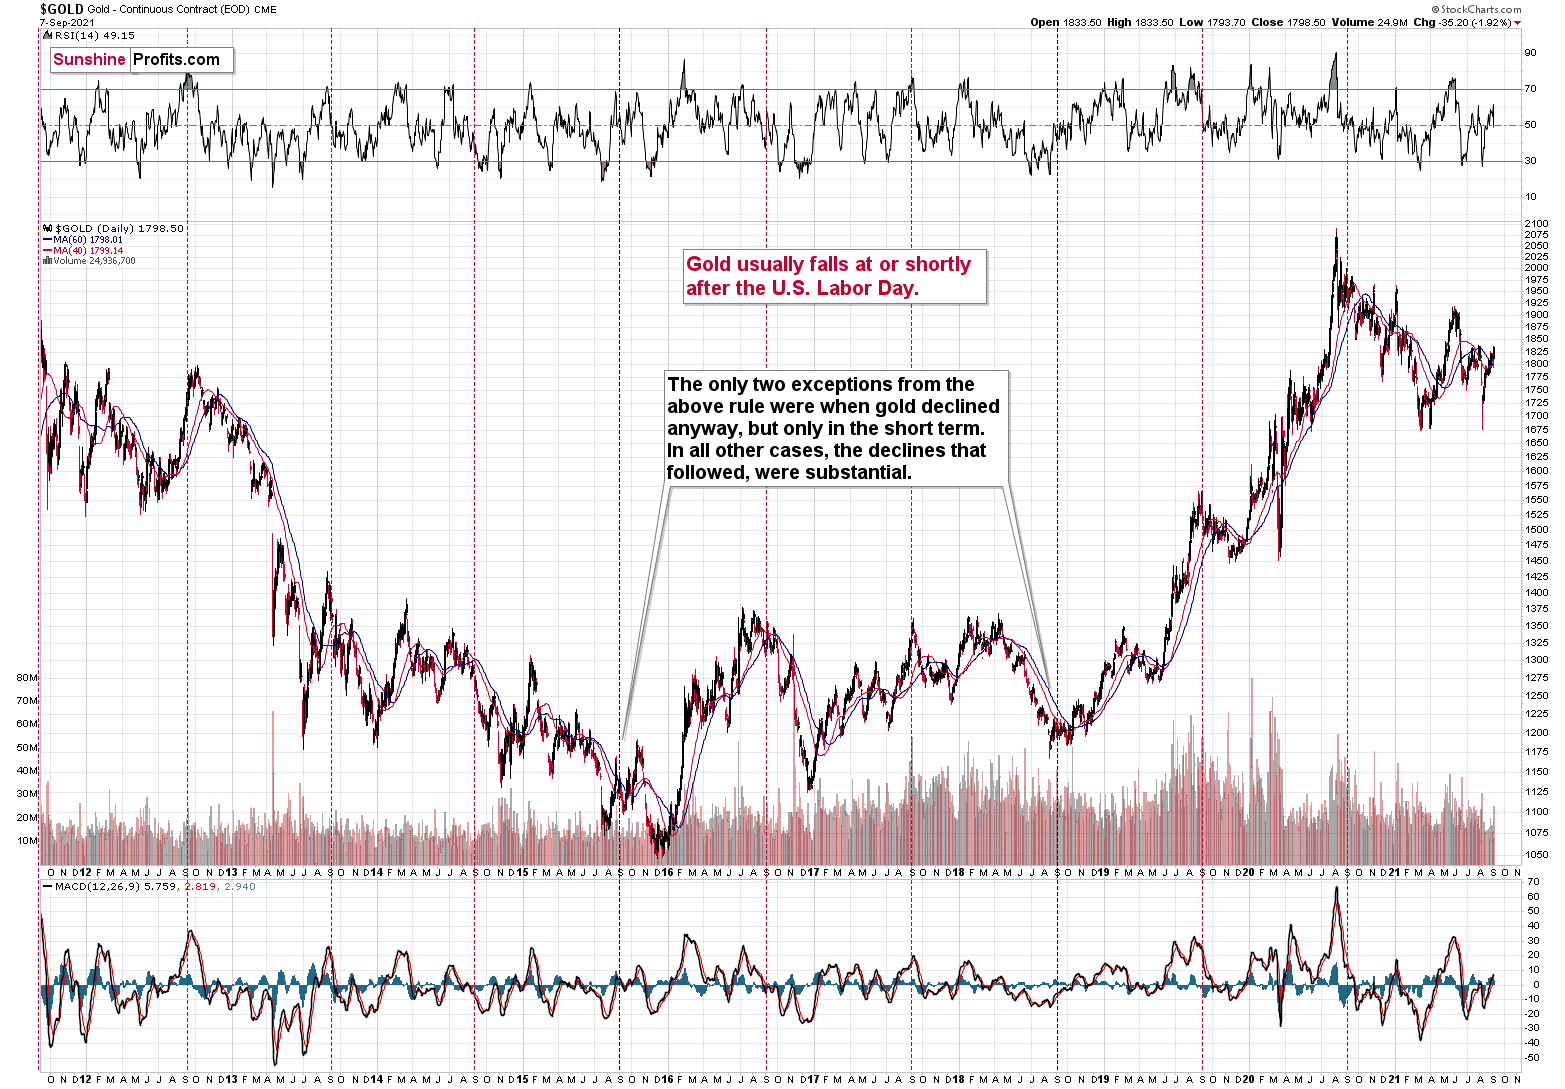
You see, in the previous 10 years, gold almost always declined profoundly right after the U.S. Labor Day — I marked that on the above chart with red, dashed lines. There were only two cases (in 2015 and in 2018) when gold didn’t slide profoundly after that day, but… it was when gold declined in the short term anyway. There was simply no major downswing later.
In other words, in all 10 out of the previous 10 years, gold moved lower in the short term after the U.S. Labor Day. Of course, it’s debatable what one describes as the short term. In this case, I mean a period between a few days and a few weeks. Then again, if you look at the chart, it’s clear what we can expect. Please have a look at how far gold usually fell (red lines) and how far it fell during the exceptionally bullish years when it declined just in the short run.
This is very important, as it tells us that even if gold doesn’t decline this week, it will be very likely to do so based on this surprisingly accurate cyclicality.
So, gold was likely to decline this week, and it has done exactly that so far. But that’s not the most important point of the above quote. The most important point is that in 8 out of the previous 10 cases of post-U.S.-Labor-Day declines, these declines were big. This week’s $30+ decline in gold may seem sizable on a day-to-day basis, but it’s nothing compared to what’s likely to happen based just on the above-mentioned analogy.
More Things to Spot
Moreover, that’s not the only profoundly bearish analogy out there. The link between now and 2013 is very strong, not only in terms of what’s happening in gold but also in terms of what’s happening in gold stocks.
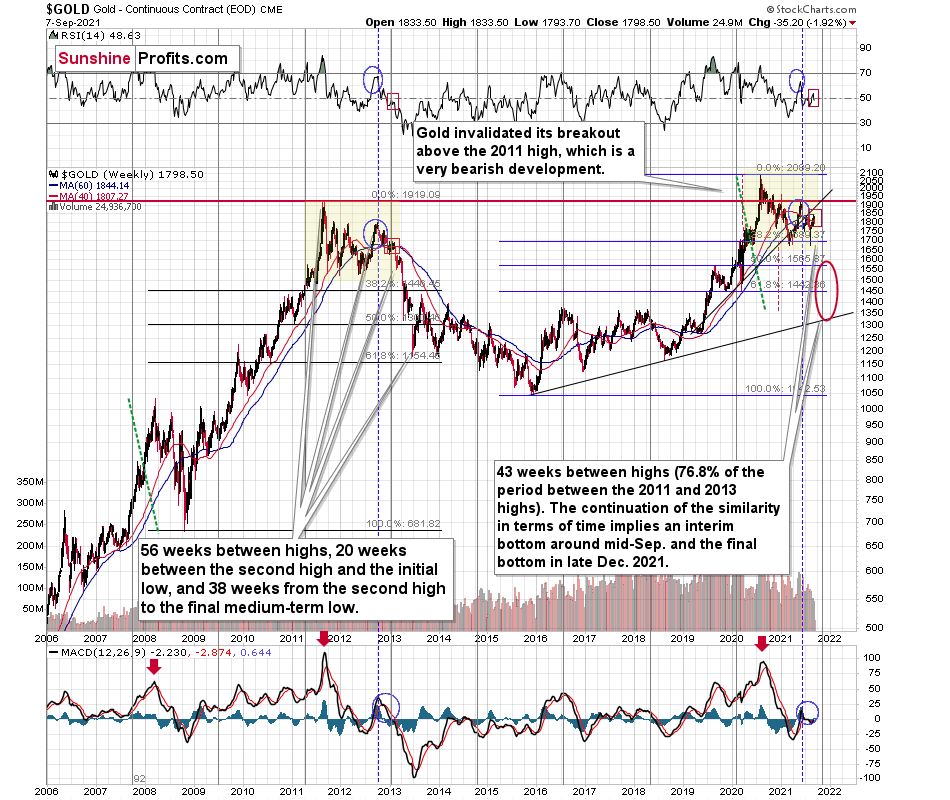
I marked the most similar long-term patterns with yellow rectangles. The blue ellipses and red rectangles emphasize the comparable performance in the RSI indicator, as well as in the MACD indicator, and in terms of gold price itself that recently moved above its 40-week moving average and close to its 60-week moving average.
It’s quite clear that what we see right now is a very good rhyme to what we saw at the beginning of 2013. And if there ever was a good time not to be long gold (except for owning it as insurance) or silver, it was back then, as it was right before the 2013 slide.
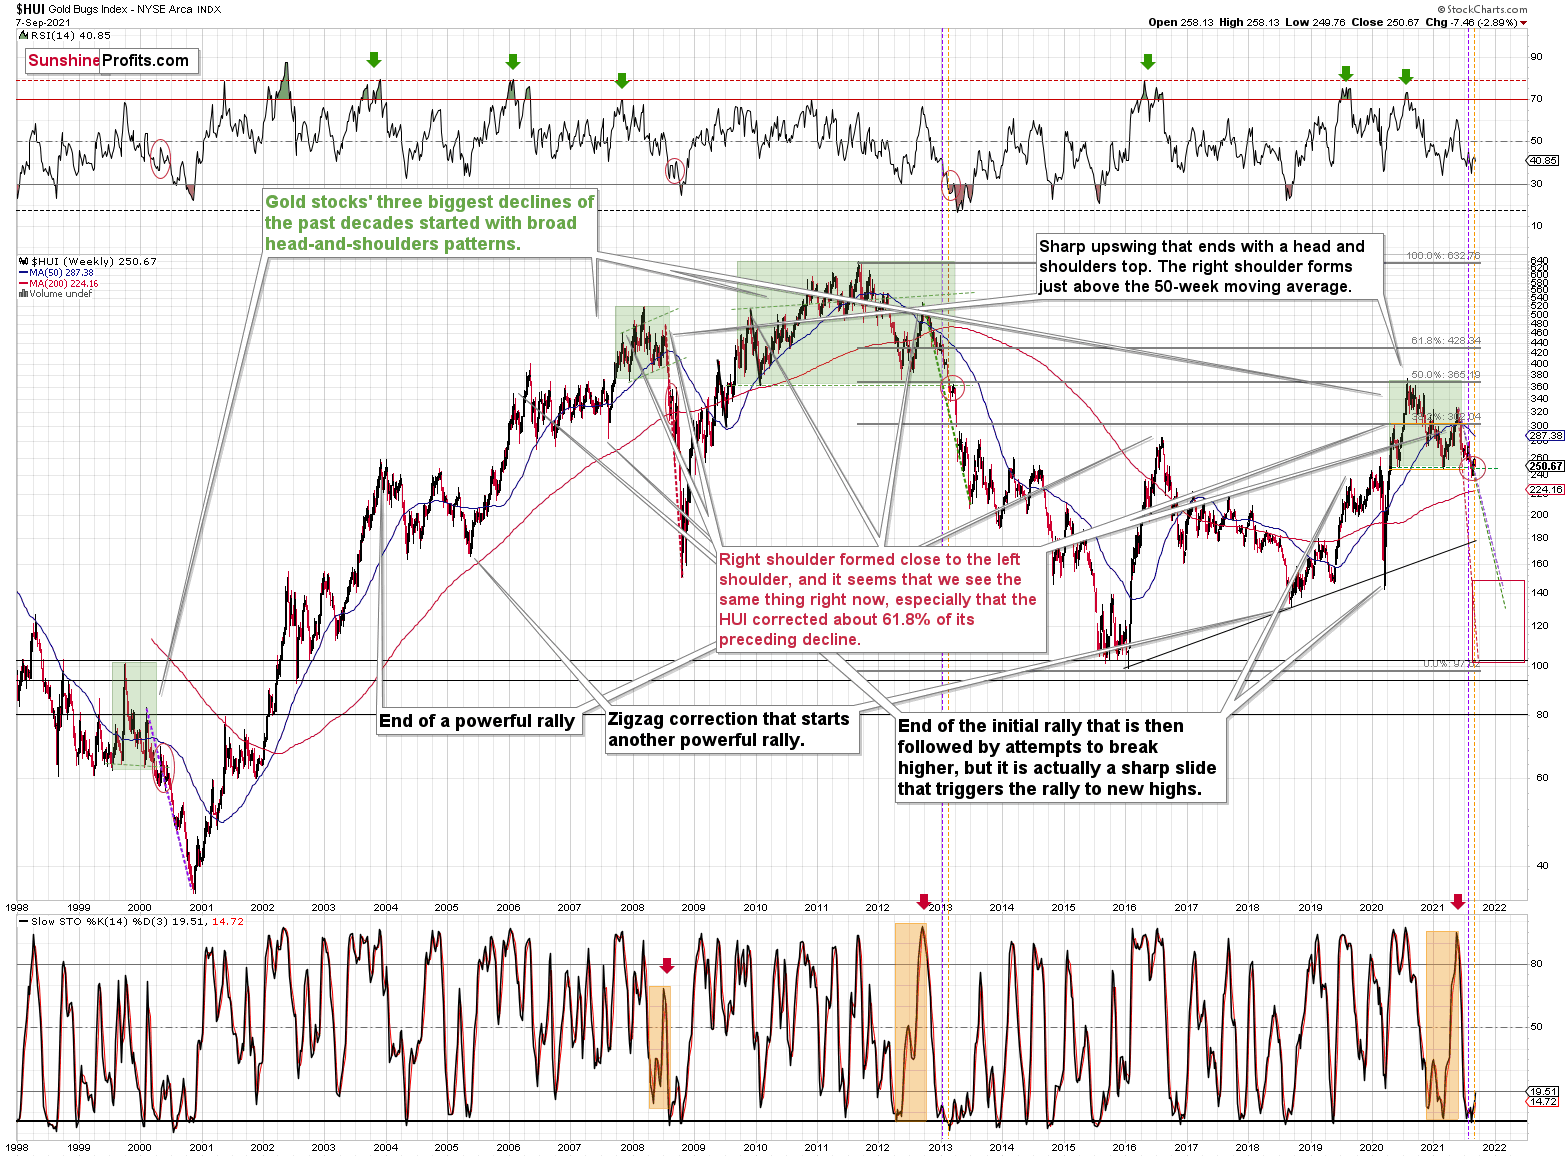
The long-term HUI Index points to the same thing. Back in 2013, the biggest corrective upswing that we saw after the breakdown below the broad (marked with green) head and shoulders pattern took gold stocks above 8% higher. We saw the same thing in the last two weeks – gold miners moved up by about 8%, and they started this week with an almost 3% decline. It seems that history rhymed once again.
Thank you for reading our free analysis today. If you enjoyed it, I have great news for you! As soon as you sign up for our free mailing list (mostly about gold, but with extra analyses of stocks and crude oil), you'll get 7 days of completely free (no-obligation). Sign up today.
Sincerely,
Przemyslaw Radomski, CFA
Founder, Editor-in-chief -
Dovish Assassins of the USD Index
September 7, 2021, 8:06 AM“I’ve got you in my sights” – the USDX heard that a lot over the last two weeks. While it was bullish for gold, the dollar might take revenge soon.
With Fed Chairman Jerome Powell doubling down on his dovish dialogue on Aug. 27 and the Delta variant depressing U.S. nonfarm payrolls on Sep. 3, the stars aligned for a profound decline in the USD Index. However, while the greenback came under fire from all angles, the USD Index demonstrated immense resiliency in the face of adversity. Moreover, the bullish determination helped reinforce our expectation for another move higher over the medium term.
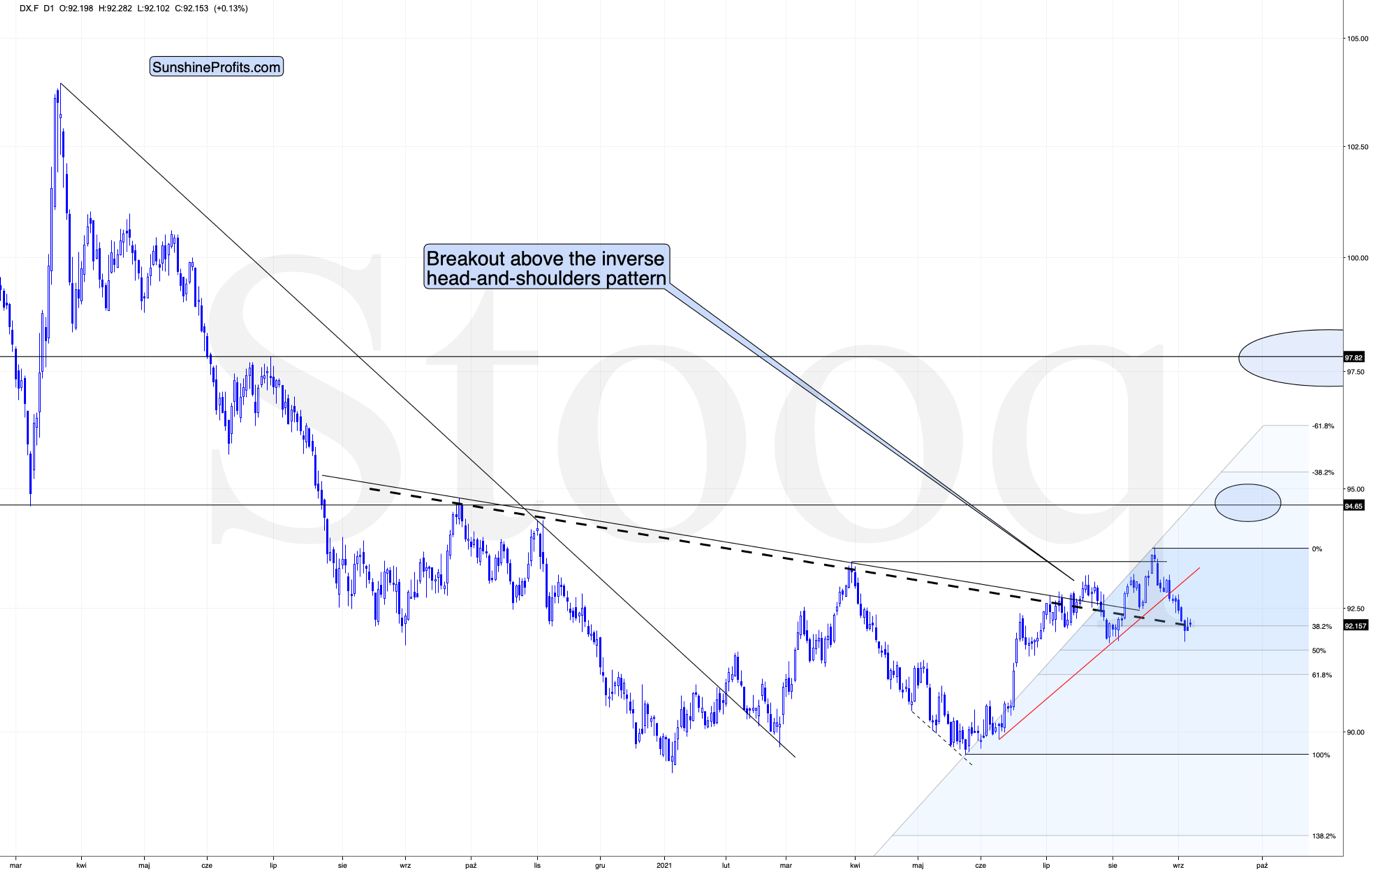
To explain, the USD Index suffered a breakdown below the neckline of its inverse (bullish) head & shoulders pattern on Sep. 3 (following the release of the payrolls). However, once cooler heads prevailed, the dollar basket recouped the key level during futures trading on Sep. 5/6/7. As a result, U.S. dollar sentiment still remains quite elevated, and at the moment of writing these words, the USD Index is trading back (not much but still) above the neck level of the pattern (dashed, thick line) that’s based on the closing prices.
Please see below:
No Pain, No Gain
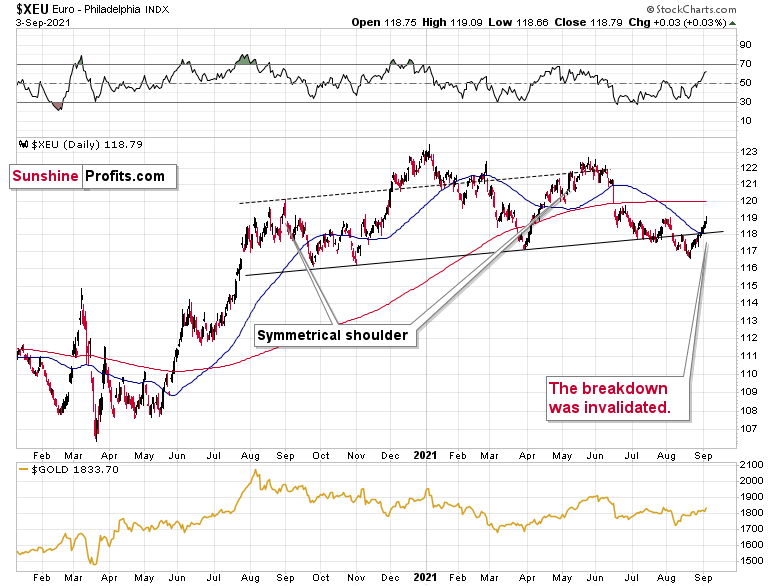
Furthermore, with the USD Index’s pain the Euro Index’s gain, the latter invalidated the breakdown below the neckline of its bearish H&S pattern. For context, the EUR/USD accounts for nearly 58% of the movement of the USD Index. And while the uprising is bad news for the greenback, could the Euro Index actually prolong gold, silver, and mining stocks’ party?
Well, for one, if I was trading the EUR/USD pair, I would be concerned about any short position that I might possibly have in this currency pair, and I could even close it based on this invalidation alone.
However, I’m not concerned about our short position in the junior miners at all because of the invalidation in the Euro Index. Why? Because of the situation in the USD Index and – most importantly – because of the way the mining stocks refuse to react to the USDX’s weakness right now. Thus, while the situation is worth monitoring, it’s unlikely to move the needle over the medium term.
Please see below:
What a Scorching Heat!
Adding to our confidence, the USD Index often sizzles in the summer sun and major USDX rallies often start during the middle of the year. Summertime spikes have been mainstays on the USD Index’s historical record and in 2004, 2005, 2008, 2011, 2014 and 2018 a retest of the lows (or close to them) occurred before the USD Index began its upward flights (which is exactly what’s happened this time around).
Furthermore, profound rallies (marked by the red vertical dashed lines below) followed in 2008, 2011 and 2014. With the current situation mirroring the latter, a small consolidation on the long-term chart is exactly what occurred before the USD Index surged in 2014. Likewise, the USD Index recently bottomed near its 50-week moving average; an identical development occurred in 2014. More importantly, though, with bottoms in the precious metals market often occurring when gold trades in unison with the USD Index (after ceasing to respond to the USD’s rallies with declines), we’re still far away from that milestone in terms of both price and duration.
Moreover, as the journey unfolds, the bullish signals from 2014 have resurfaced once again. For example, the USD Index’s RSI is hovering near a similar level (marked with red ellipses), and back then, a corrective downswing also occurred at the previous highs. More importantly, though, the short-term weakness was followed by a profound rally in 2014, and many technical and fundamental indicators signal that another reenactment could be forthcoming.
Please see below:
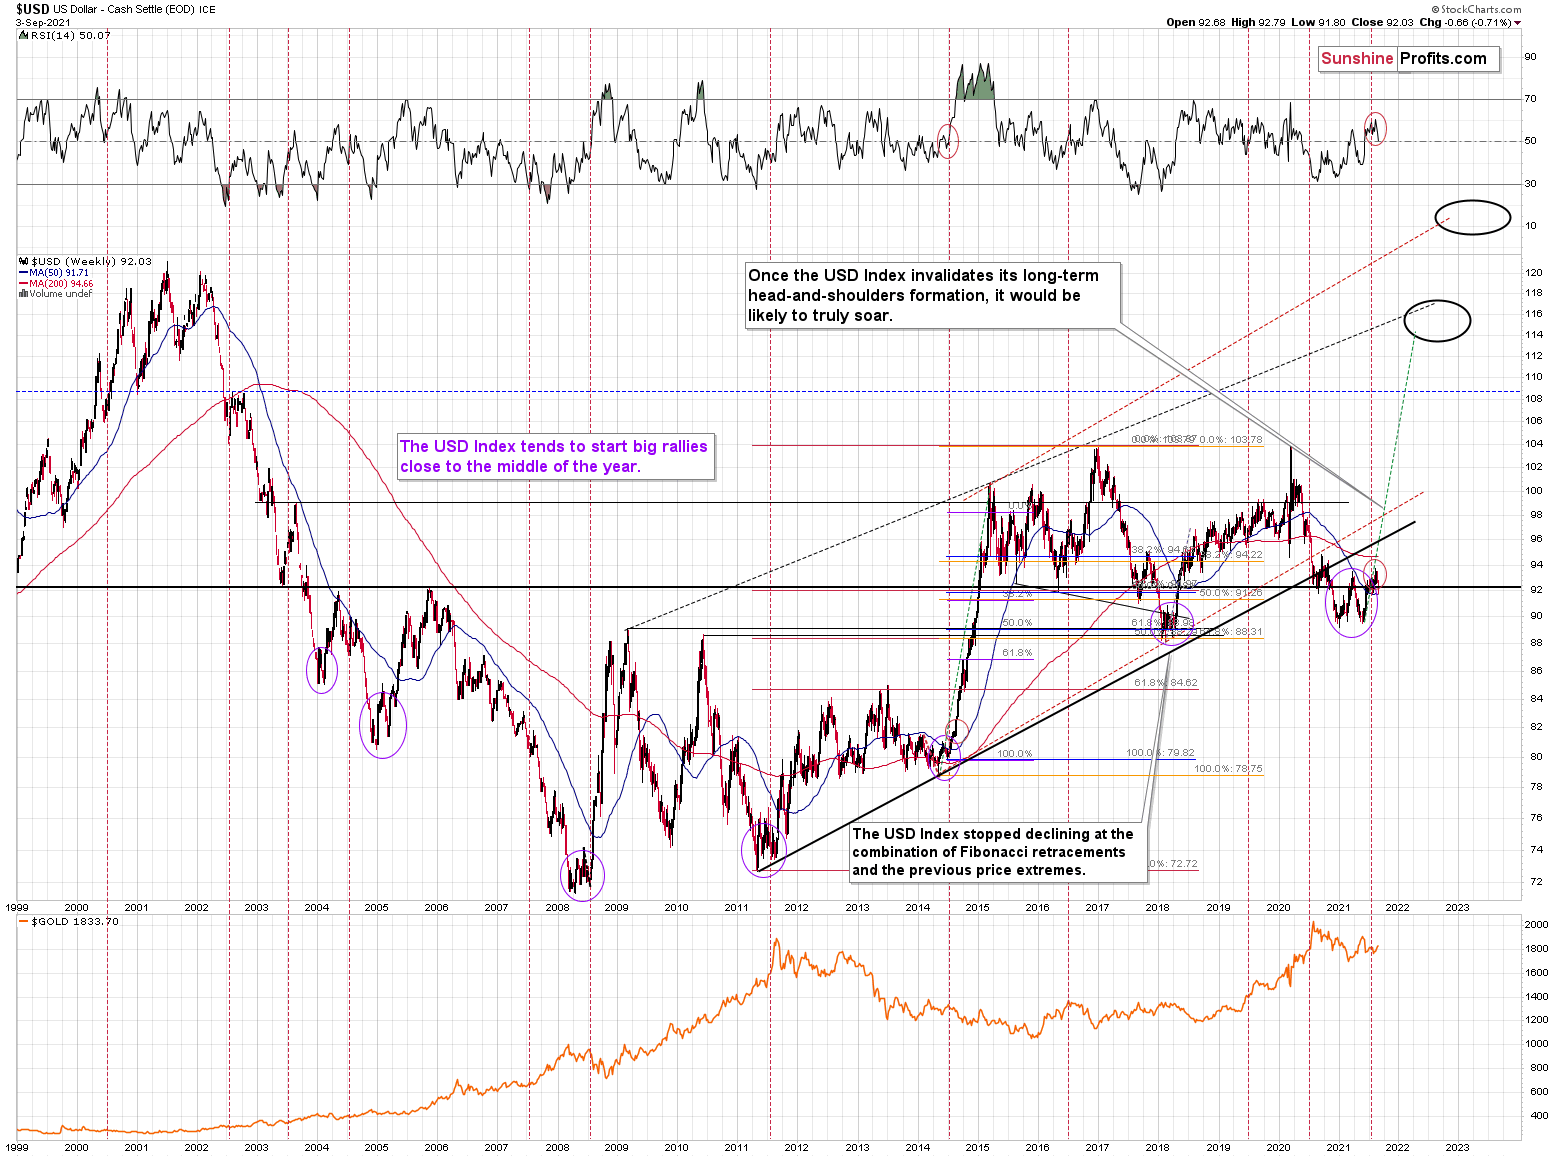
Just as the USD Index took a breather before its massive rally in 2014, it seems that we saw the same recently. This means that predicting higher gold prices (or the ones of silver)here is likely not a good idea.
Continuing the theme, the eye in the sky doesn’t lie. And with the USDX’s long-term breakout clearly visible, the wind still remains at the greenback’s back.
Please see below:
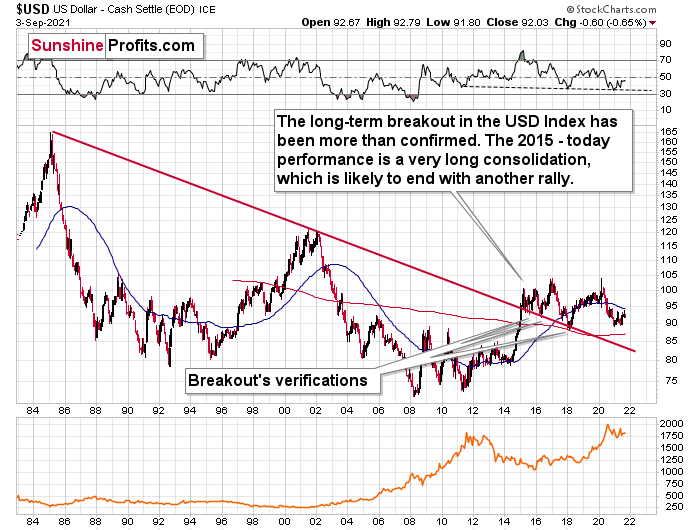
The bottom line?
Once the momentum unfolds, ~94.5 is likely the USD Index’s first stop, ~98 is likely the next stop, and the USDX will likely exceed 100 at some point over the medium or long term. Keep in mind though: we’re not bullish on the greenback because of the U.S.’ absolute outperformance. It’s because the region is fundamentally outperforming the Eurozone, the EUR/USD accounts for nearly 58% of the movement of the USD Index, and the relative performance is what really matters.
In conclusion, the USD Index was a marked man over the last two weeks, and the dovish assassins had the dollar basket right in their crosshairs. And while the barrage of bullets fired at the greenback was bullish for gold, silver and mining stocks, the former’s ability to escape the infirmary highlights the shift in sentiment surrounding the USD Index. As a result, with technicals, fundamentals and sentiment supporting a stronger U.S. dollar over the medium term, the precious metals won the recent very short-term battle, but they’re still unlikely to win the medium-term war. Of course, I continue to think that gold is going to soar in the following years, but not before declining profoundly first. At the moment of writing these words, gold futures are already down over $15 from their Friday’s close and about $20 below their last week’s high – it could be the case that the news-based rally is already over.
Thank you for reading our free analysis today. If you enjoyed it, I have great news for you! As soon as you sign up for our free mailing list (mostly about gold, but with extra analyses of stocks and crude oil), you'll get 7 days of completely free (no-obligation). Sign up today.
Sincerely,
Przemyslaw Radomski, CFA
Founder, Editor-in-chief -
Early (Video) Heads-up before Tomorrow’s Session
September 6, 2021, 10:10 AMAvailable to premium subscribers only.


Gold Investment News
Delivered To Your Inbox
Free Of Charge
Bonus: A week of free access to Gold & Silver StockPickers.
Gold Alerts
More-
Status
New 2024 Lows in Miners, New Highs in The USD Index
January 17, 2024, 12:19 PM -
Status
Soaring USD is SO Unsurprising – And SO Full of Implications
January 16, 2024, 8:40 AM -
Status
Rare Opportunity in Rare Earth Minerals?
January 15, 2024, 2:06 PM

