
tools spotlight

-
FED: Powell’s Dovish Comments Might Not Be the Whole Truth
July 29, 2021, 8:17 AMPowell’s stance increased investors’ optimism, though the narrative sounds like a broken record. Meanwhile, the tapering clock may already be ticking…
While I usually finish the analyses with the fundamental discussion and start with the technicals, it seems justified to switch the usual order today. The reason is that a large part of yesterday’s and today’s pre-market price moves could be attributed to yesterday’s FOMC (and the following press conference), while today’s moves could be attributed to the aftermath of the above, as well as to the tensions preceding today’s initial jobless claims numbers.
Look at Everything Powell Does
With Jerome Powell, Chairman of the U.S. Federal Reserve (FED), conducting his dovish orchestra on Jul. 28, the maestro did what he often does during FOMC press conferences. To explain, I wrote prior to the announcement:
While the PMs may record a short-term bounce – which often occurs following Powell’s pressers – lower lows are still likely to materialize in the coming months.
And with the man living up to his reputation at 2:30 p.m. ET, his predictability resulted in another example of ‘PMs up, USD Index down.’
Please see below:
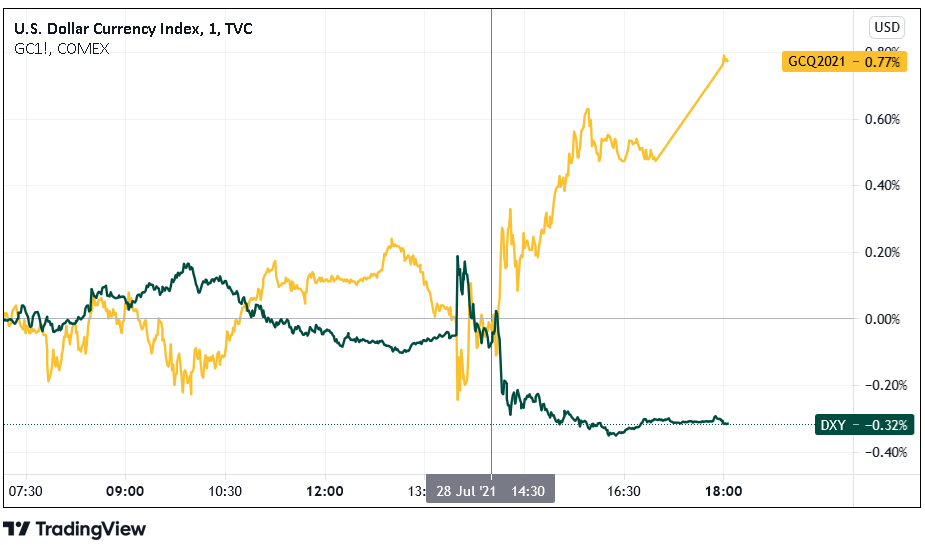
However, because the price action was largely expected, it’s likely another case of ‘been there, done that.’ For example, the PMs bounced and the USD Index sank following the last four FED meetings. However, after the sugar highs wore off and reality reemerged, the reversal of fortunes left the PMs on the wrong side of happiness. As a result, is this time really different?
To explain, we still expect the FED to announce its taper timeline by (or before) its Sep. 21/22 policy meeting. And while the surging reverse repurchase agreements (another $965 billion sold on Jul. 28) are the fundamental equivalent of a taper, if Powell utters the words, it will have a much greater effect on the financial markets. Thus, while the FED Chairman remained staunch in his dovish stance, signs of slippage are already emerging.
Please see below:
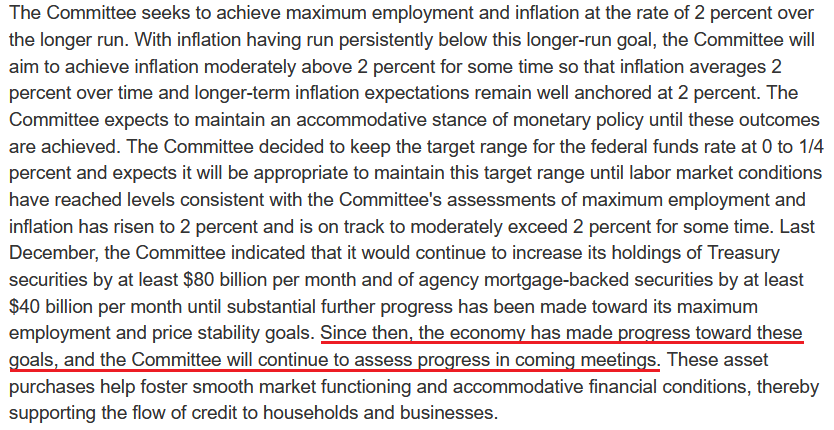 Source: U.S. FED
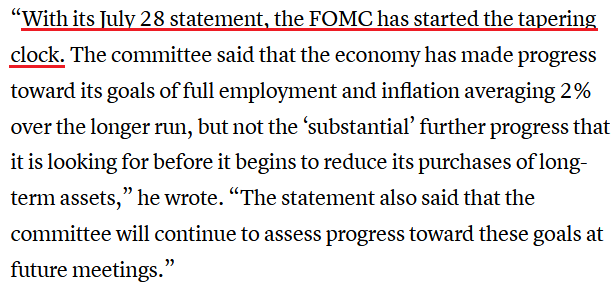
To explain, the FED released its standard statement on Jul. 28, and as expected, ~$120 billion per month of QE remains on autopilot. However, what differs from June and now is that the FED added the underlined section above. And while the FED parrots “substantial further progress” as its criteria for reducing its bond-buying program, the mere mention of “progress” is a subtly hawkish shift. For context, the identical paragraph below (released following the FOMC meeting in June) made no mention of progress whatsoever.
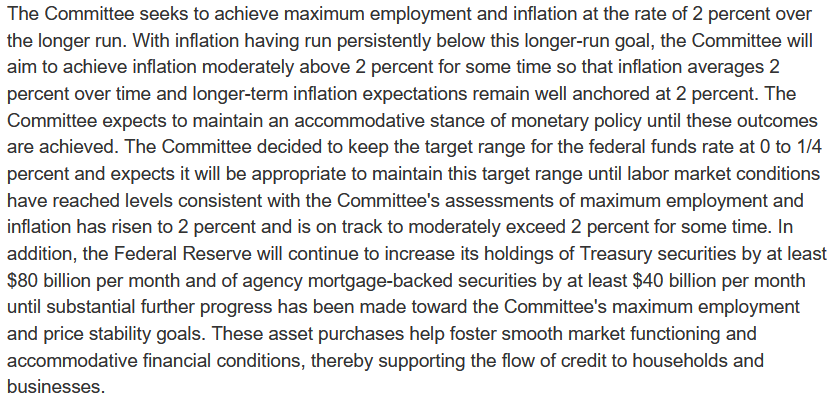 Source: U.S. FED
Furthermore, Powell said the following about the labor market during his press conference:
“I’d say we have some ground to cover on the labor market side. I think we’re some way away from having had substantial further progress toward the maximum employment goal.”
However, during his opening statement, he said:
“As with overall economic activity, conditions in the labor market have continued to improve. Demand for labor is very strong, and employment rose 850,000 in June, with the
leisure and hospitality sector continuing to post notable gains. Nonetheless, the labor market has ways to go. The unemployment rate in June was 5.9 percent, and this figure understates the shortfall in employment, particularly as participation in the labor market has not moved up from the low rates that have prevailed for most of the past year. Factors related to the pandemic, such as caregiving needs, ongoing fears of the virus, and unemployment insurance payments, appear to be weighing on employment growth. These factors should wane in coming months, leading to strong gains in employment.”“In coming months?” That sounds a lot like Sep. 21/22…
In addition, another subtly hawkish shift was Powell’s nonchalant attitude toward the Delta variant. While the recent spike offered the perfect opportunity for him to use it as an excuse, the FED Chairman essentially brushed aside its potential impact.
He said:
“With successive waves of COVID over the past year and some months now, there has tended to be ... less in the way of economic implications from each wave, and we will see whether that is the case with the Delta variety.”
On top of that:
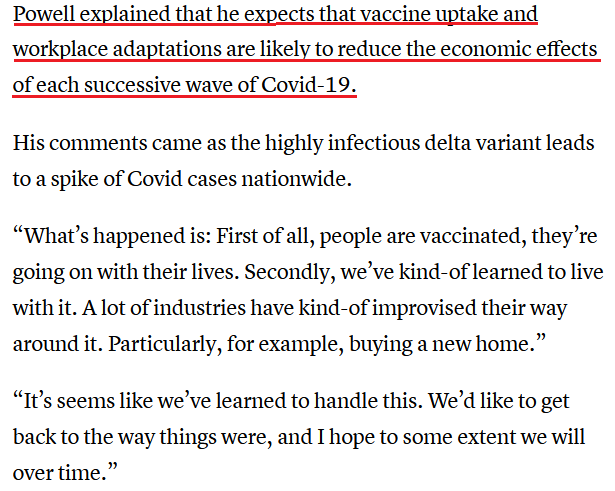 Source: CNBC
What’s more, Powell said the following about inflation during his opening statement:
“Inflation is running well above our 2% objective, and has been for a few months, and is expected to run certainly above our objective for a few months before we believe it’ll move back down toward our objective. The question of whether we’ve met that objective, formally, is really one for the committee to make.”
Could Inflation Overshoot the FED’s Forecasts?
Well, even though the FED increased its headline Personal Consumption Expenditures (PCE) Index forecast from a 2.4% year-over-year (YoY) rise to a 3.4% YoY rise on Jun. 16, another dose of reality could be forthcoming. For example, with the PCE Index data scheduled for release on Jul. 30, the YoY percentage change in the Commodity Producer Price Index (PPI) implies a print of roughly 3.75% to 4.25%.
Please see below:
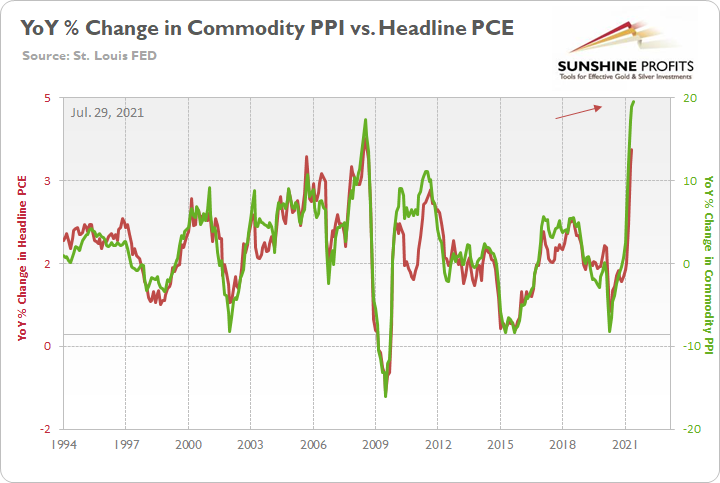
To explain, the green line above tracks the YoY percentage change in the commodity PPI, while the red line above tracks the YoY percentage change in the headline PCE Index. If you analyze the right side of the chart, you can see that a material gap is clearly visible. As a result, inflation is still likely to overshoot the FED’s already drastically upgraded forecast.
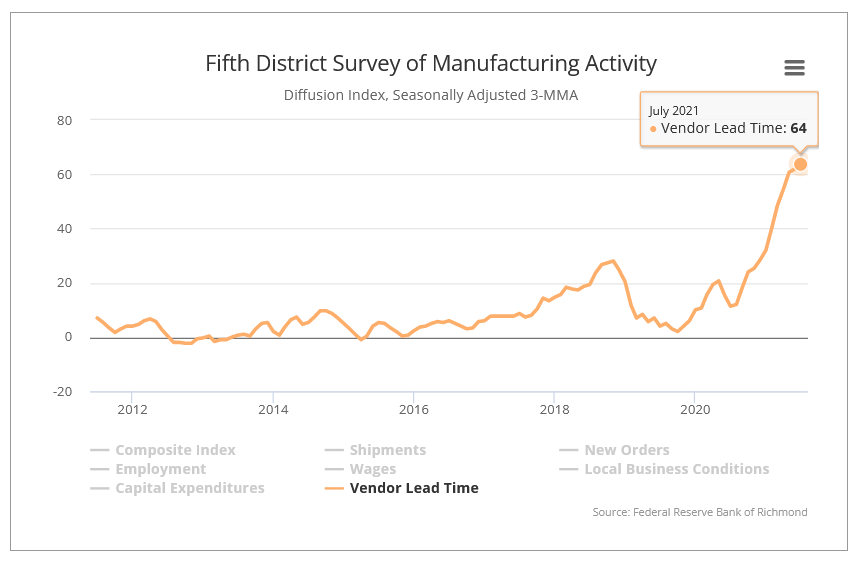
As further evidence, the Richmond FED released its Fifth District Survey of Manufacturing Activity on Jul. 27. And while the composite index rose from 26 in June to 27 in July (an all-time high), “the indexes for inventories of raw materials and of finished goods declined, as both of these indexes hit record lows, and vendor lead times continued to lengthen.” For context, low inventories and rising vendor lead times are extremely inflationary. Not only do they signal that businesses are running low on raw materials (meaning that producers have the pricing power), but shipping delays add upward pressure, as businesses have to compete for what little supply is available.
Please see below:
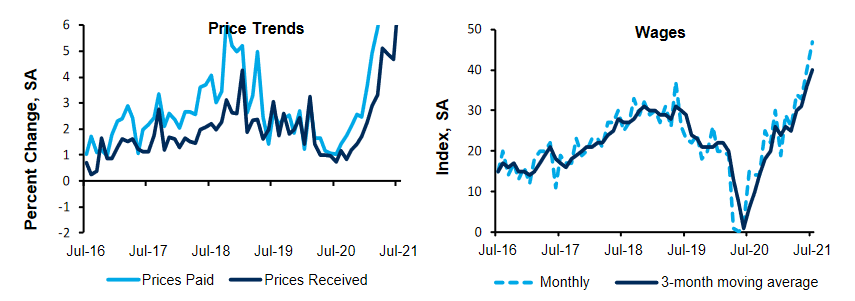
However, even more newsworthy, the Richmond FED’s price paid index, prices received index and its wages index all hit new all-time highs in July.
Please see below:
 Source: Richmond FED
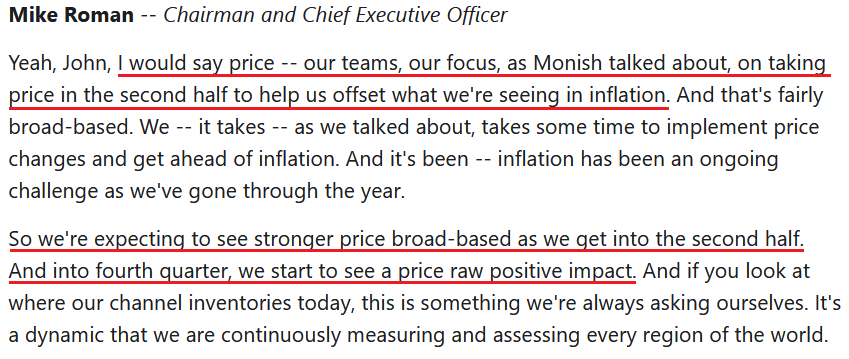
Finally, with 3M the latest company to sound the alarm on inflation, the American conglomerate is knee-deep in the chaos. For context, 3M manufactures products for all kinds of businesses, including those within the automotive, health care and consumer industries.
When asked during the company’s second-quarter earnings call on Jul. 27, “when do you expect commodity inflation to peak?” CFO Monish Patolawala said the following:
“So if you're asking specifically on commodities, I think it's a really hard one to call. For example, I would tell you, when we first gave our guide of $0.30 to $0.50, which has now been guided to $0.65 to $0.80, I would tell you, what we have seen is a broad-based increase in all commodities, whether it is polypropylene, chemical, resins we are seeing in our outsourced manufacturing goods, not just the labor cost but other commodities that go into that also getting passed. And then, logistics cost has continued to be a pretty strong headwind. Where that will peak, I think, in my view, and I may be wrong here, at some point, demand and supply need to start settling itself out.
There's a lot of demand. There's not enough supply based on all the V-shape recovery with the congestion in the ports, etc. And until that stabilizes itself out, I think we're going to continue to see inflation.”
And how is the company responding to the inflationary pressures?
 Source: 3M/The Motley Fool
The Clock Is Ticking…
Piecing it all together, what was Gus Faucher’s, Chief Economist at PNC, takeaway from the FOMC release?
 Source: CNBC
In conclusion, the PMs received a helping hand on Jul. 28, as Powell’s standard response increased investors’ optimism. However, with his words, the price action and the narrative sounding like a broken record, it’s important to remember that the medium-term implications remain intact. With inflation surging and the clock ticking toward the FED’s taper timeline announcement, the PMs are fighting an uphill battle. And because corrective upswings are expected within a medium-term downtrend, the PMs’ price action on Jul. 28 was likely nothing more.
It seems that the markets reacted to the Fed’s comments at their face value, but as the time goes by, the markets are likely to start reading between the lines and note what’s coming. And since the markets are forward-looking, yesterday’s price moves are likely to be reversed and it seems that we might not have to wait too long for that to happen.
In fact, if it was the case that yesterday’s price moves were triggered just by a very emotional reaction to the news, without their analysis, it could be the case that they will be reversed soon, as analysts will dig into the comments and report to investors soon, perhaps as soon as today – just like me, writing this text to you right now.
The implication of the above is that perhaps the price moves and their technical implications shouldn’t be taken at their face value just yet.
Having said that, let’s look at the technicals.
Rally or Fakeout?
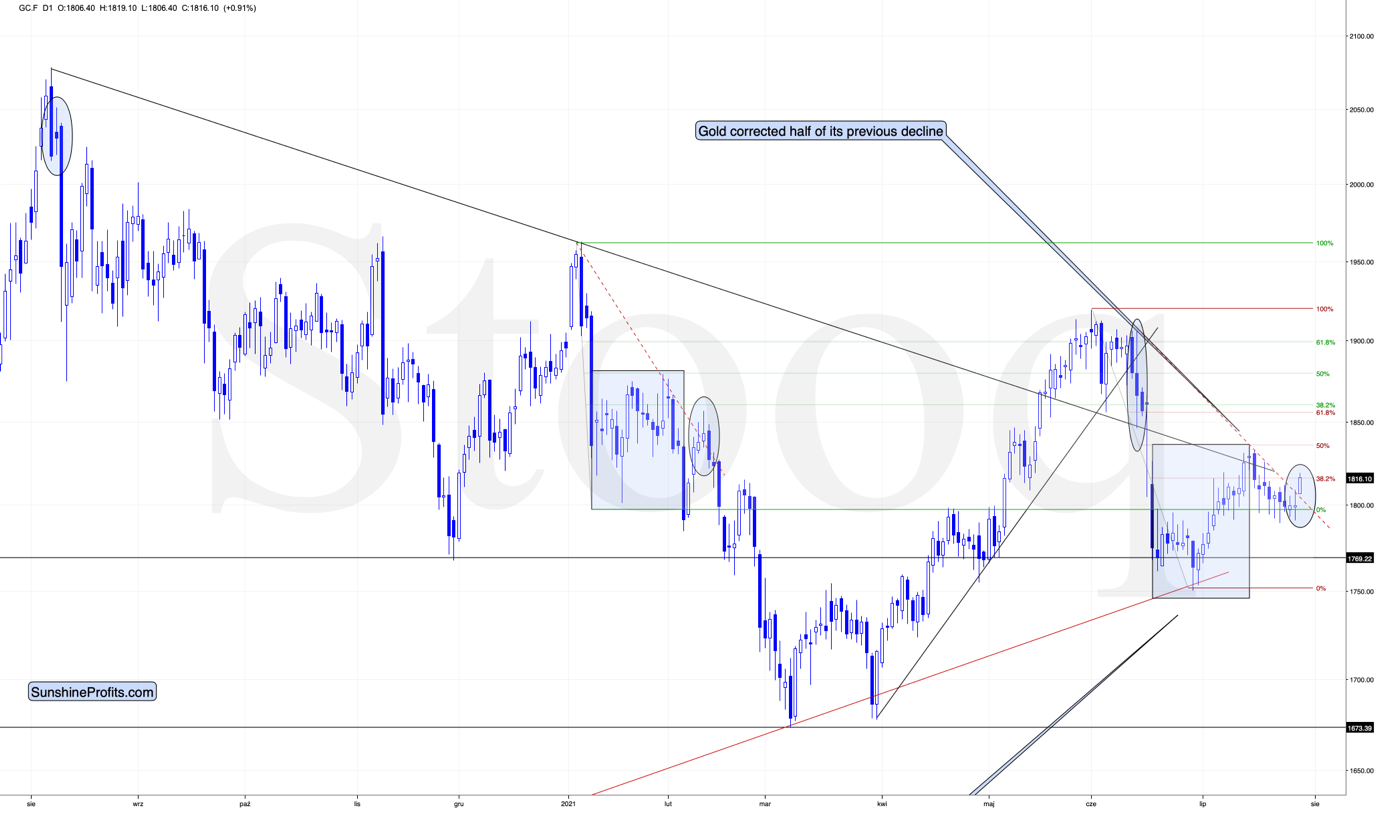
Gold rallied in today’s pre-market trading, and it even moved above its rising short-term resistance line that I marked with a red, dashed line. This seems bullish until you compare it with a very similar price action that took place in mid-February when gold was after a very similar pattern (sharp decline, corrective upswing to the 50% retracement, another move lower, and then another move up before sliding).
It seems that we are in the “then another move up” stage right now. Back in February, gold moved to about 38.2% Fibonacci retracement based on the initial big decline before turning south. Guess what price level gold is trying to breach today – the 38.2% Fibonacci retracement that’s based on the initial big decline.
Therefore, is gold’s rally really bullish right now? Or is it a fakeout just like what we saw in mid-February? The context provided by what happened yesterday suggests that the fakeout scenario is more probable.
Thank you for reading our free analysis today. Please note that the above is just a small fraction of the full analyses that our subscribers enjoy on a regular basis. They include multiple premium details such as the interim targets for gold and mining stocks that could be reached in the next few weeks. We invite you to subscribe now and read today’s issue right away.
Sincerely,
Przemyslaw Radomski, CFA
Founder, Editor-in-chief -
USDX: More Sideways Trading Ahead?
July 28, 2021, 8:21 AMThe USDX reportedly invalidated its bullish H&S pattern yesterday, but did it actually do so? The line based on daily closing prices says otherwise.
Yesterday’s (Jul. 27) supposedly big news was the breakdown below the neck level of the inverse head-and-shoulders pattern in the USD Index. Invalidations of breakouts are bearish, and what’s bearish for the USDX is usually bullish for gold, silver, and mining stocks. So, what happened? And what didn’t happen?
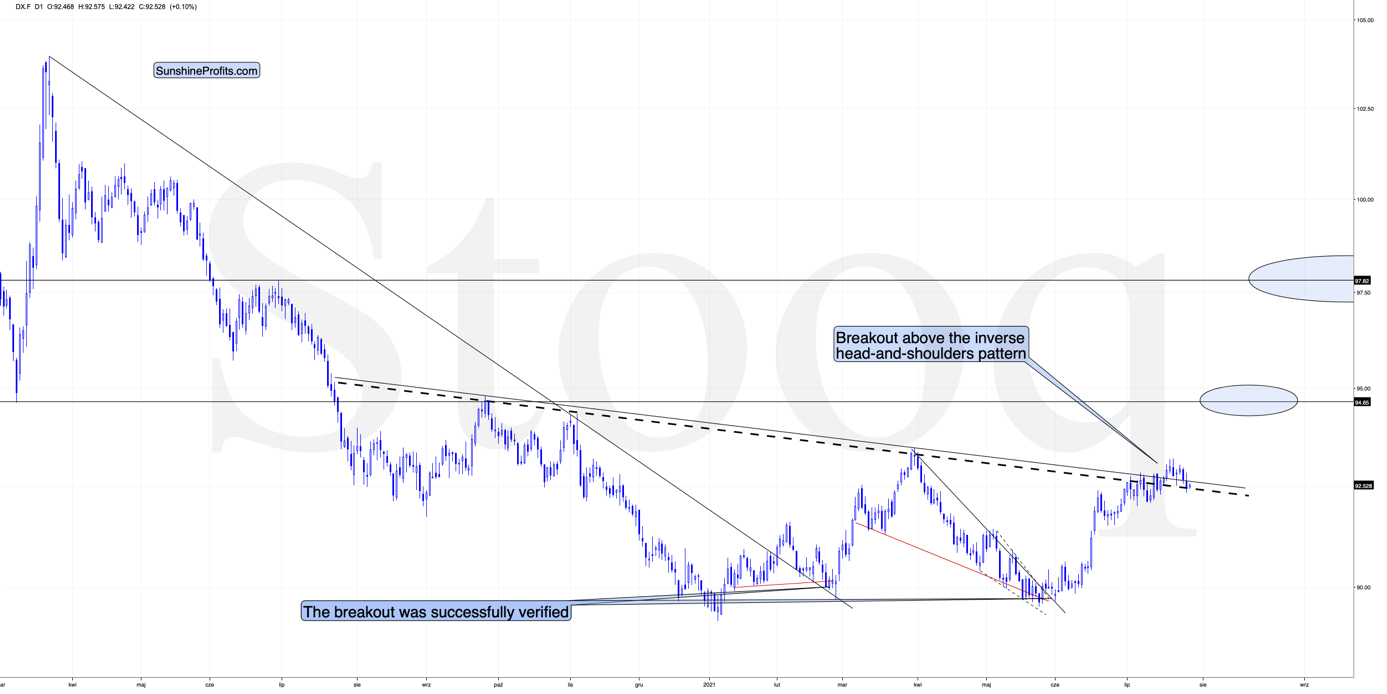
What happened was that the USD Index moved a bit below the declining neckline based on the previous intraday highs.
What didn’t happen was the move below the declining neckline based on the previous highs in terms of daily closing prices (dashed line).
So, was the breakout really invalidated? Not necessarily, especially that the USDX is moving back up in today’s pre-market trading (at least at the moment of writing these words).
Moreover, while the USD Index moved lower yesterday, gold refused to rally.
To be precise, it did move higher, but only by $0.60, so it generally ignored the USD’s movement.
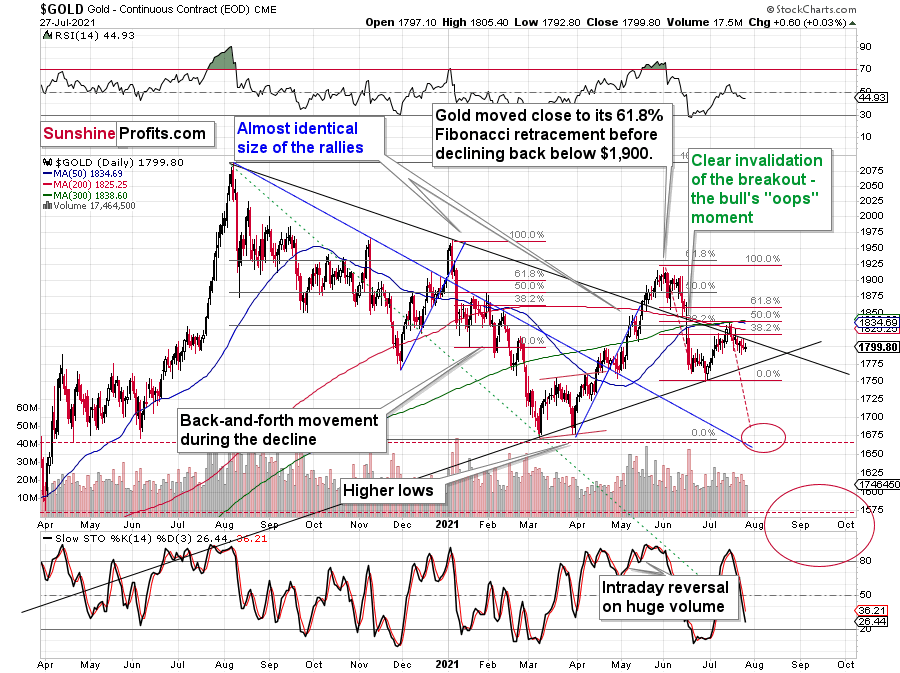
Consequently, yesterday’s session might have seemed to be a game-changer at first sight, but it seems much more likely that it wasn’t one. In my view, yesterday’s price movement was the continuation of the back-and-forth trading that’s analogous to what we saw in the first half of June. Gold was moving back and forth in a boring manner then too. The boredom was over quite quickly and a big short-term slide followed – I think the same is likely to happen shortly.
Gold Miners’ Aid
Mining stocks’ performance also supports this scenario.
If it was the beginning of another sizable move higher in the PMs and miners, the latter would be likely to show strength before gold. And that’s not taking place.
Senior gold miners were practically flat yesterday, just as gold was – that is, only slightly higher. On the other hand, junior gold miners ended the session slightly lower – very close to their previous 2021 lows.
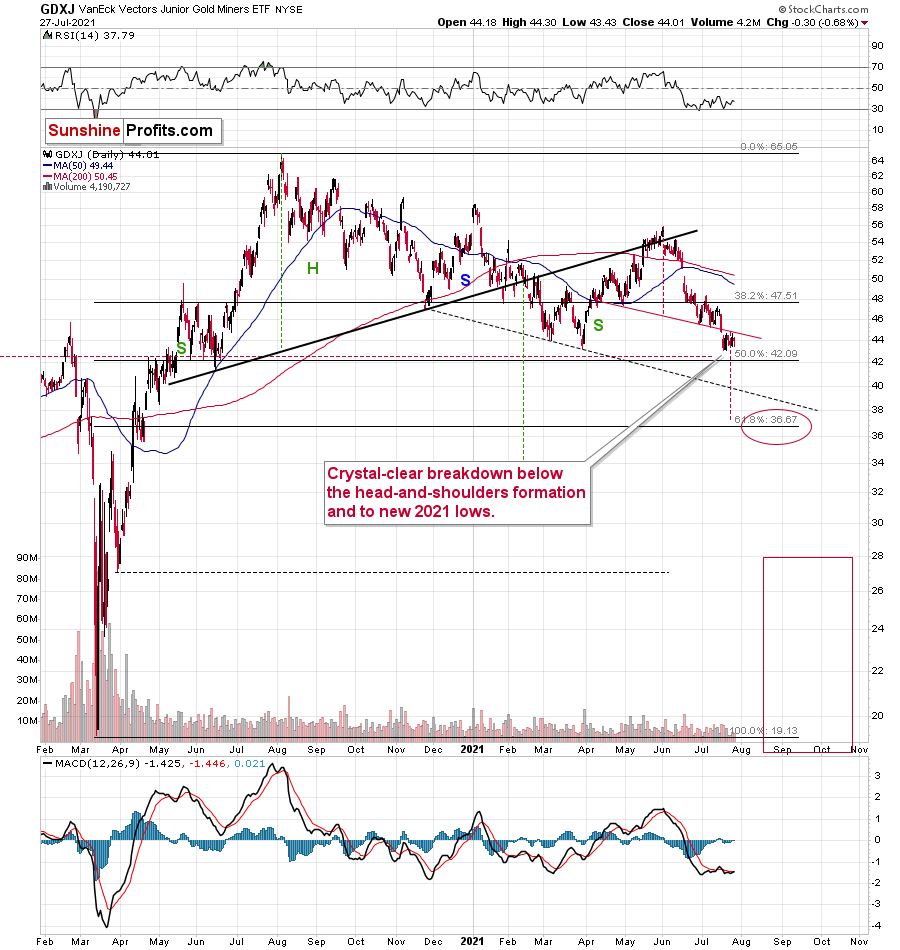
Junior miners (the GDXJ ETF) haven’t invalidated the breakdown below the neck level of the bearish head and shoulders formation. Consequently, the very bearish implications of the breakdown remain intact.
All in all, the precious metals sector seems poised for another move lower, quite likely to the previous yearly lows in the case of gold and well below the previous 2021 lows in the case of the mining stocks. Yesterday’s decline in the USD index doesn’t change that. To clarify, the above-mentioned targets will most likely be just interim stops within an even bigger decline that will get us to the ultimate buying opportunity for the PMs and miners later this year.
Thank you for reading our free analysis today. Please note that the above is just a small fraction of the full analyses that our subscribers enjoy on a regular basis. They include multiple premium details such as the interim targets for gold and mining stocks that could be reached in the next few weeks. We invite you to subscribe now and read today’s issue right away.
Sincerely,
Przemyslaw Radomski, CFA
Founder, Editor-in-chief -
The Calm Before the USDX Storm. May It Harm Gold?
July 27, 2021, 7:55 AMWith the completed inverse H&S formation, the USDX will likely soar, which is very negative for gold. Are these the last calm moments at the PMs’ sea?
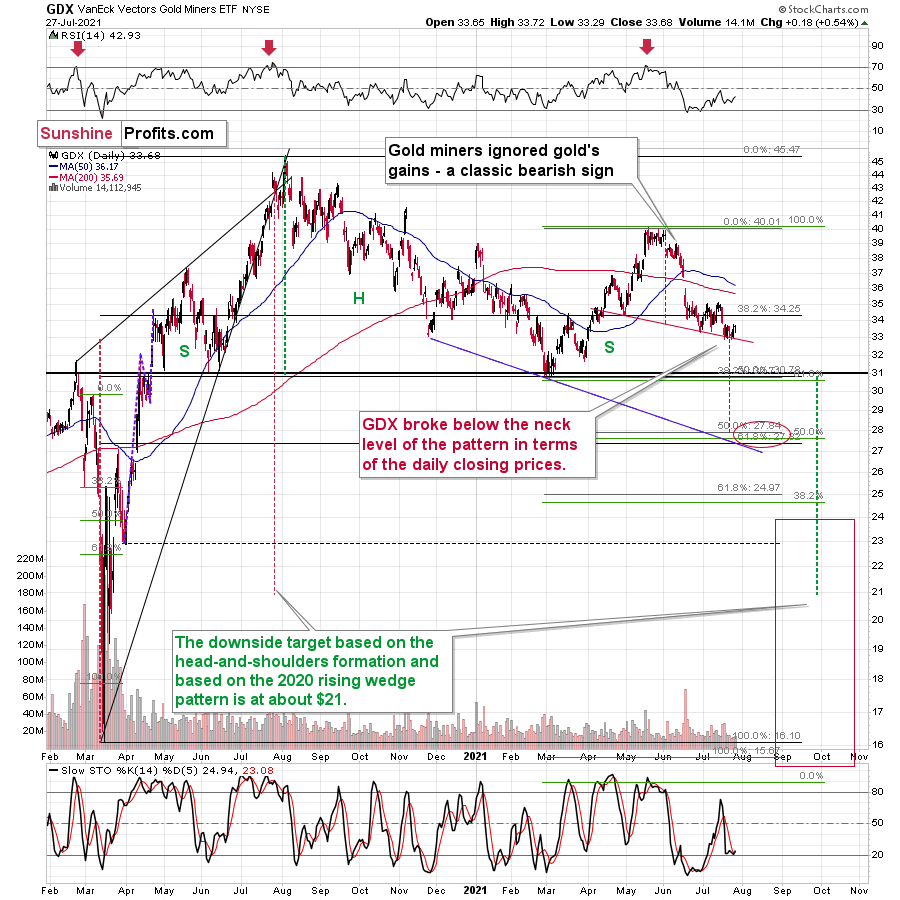
Gold Miners
Yesterday’s (Jul. 26) session might have seemed to be something important or game-changing, as miners moved higher. But it wasn’t.
But miners moved higher while gold moved lower! Wasn’t that the opposite of what you described as very bearish?
It was, but the context was different. The magnitude and time frame were different. The miners’ underperformance that I had described took place over the previous weeks, and what happened yesterday was limited to… well, yesterday.
Consequently, miners’ strength seems to have just been a blip on the radar screen – a tiny correction in the moves in prices and ratios that have been taking place for many weeks.
It didn’t change anything from the technical point of view either.

Senior miners even corrected before the end of the day.
And junior gold mining stocks?
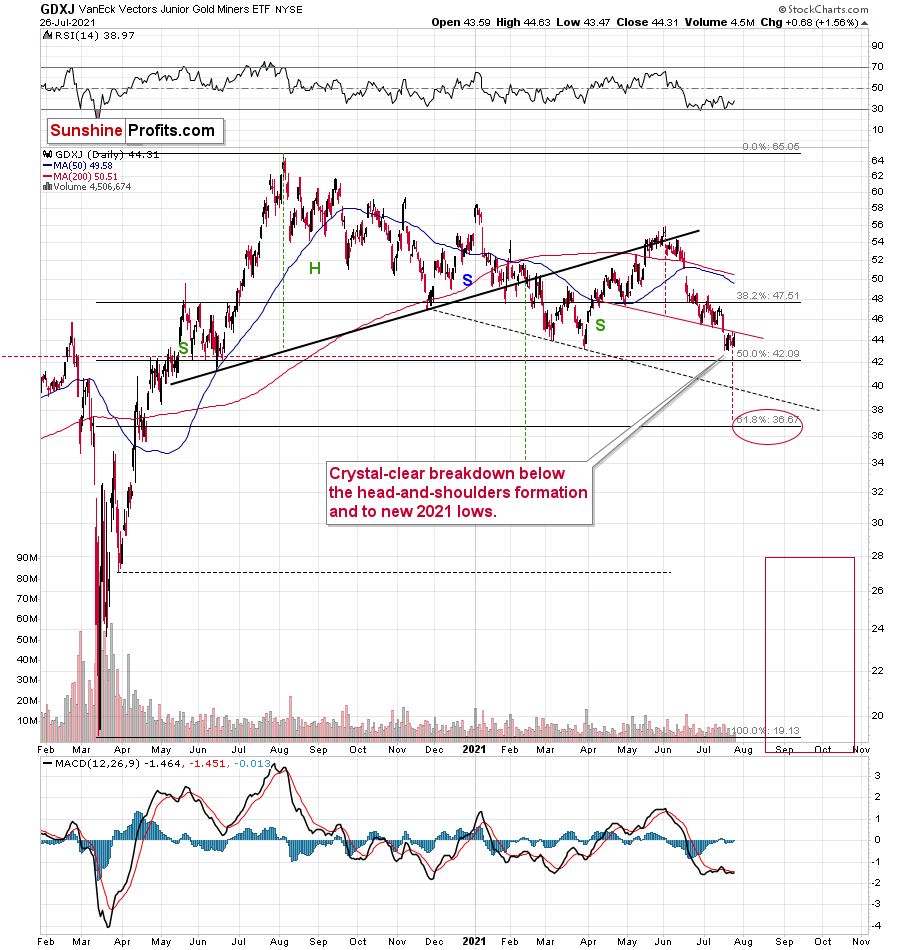
Junior miners (the GDXJ ETF) didn’t invalidate the breakdown below the neck level of the bearish head and shoulders formation. Consequently, the very bearish implications of the breakdown remain intact.
While the last several days were relatively calm in the PMs and in the USD Index, it seems that it’s not only the calm before the storm, but also the final part thereof.

As I wrote earlier, gold didn’t do much yesterday – it moved slightly lower. The same is taking place in today’s pre-market trading – gold is about $2 lower. Basically, nothing changed, and gold is likely to move lower based, i.a., on the self-similarity to what happened in 2012-2013 and 2008 (as I discussed yesterday).
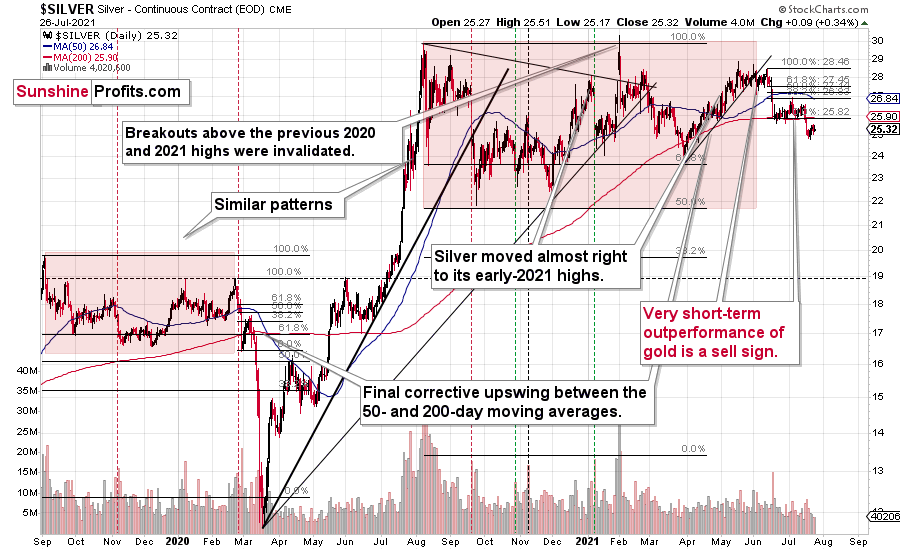
Silver corrected a bit, but it didn’t move back above its mid-June lows, so the breakdown below them was definitely not invalidated. It seems that the next big move in the price of the white metal will be to the downside.
The USD Index
The situation in the USD Index perfectly fits the “final part of the calm before the storm” narrative.

The USDX moved a bit lower yesterday, but this move didn’t take it back below the neck level of the previously broken inverse head-and-shoulders formation. Consequently, the USDX is likely to soar in the following weeks, which is likely to put very negative pressure on the PMs, almost (!) guaranteeing that they will decline in consequence.
Moreover, please note that the correlation between gold and the USD Index (lower part of the above chart) is now moving back toward the 0 level after a long period of being close to -1. This might not seem interesting until one compares it to what happened in gold when that was the case previously. In early September 2020, in mid-November 2020, and in mid-February 2021 we saw the same thing and that heralded short-term declines in gold in all three cases. Thus, the implications are bearish.
Thank you for reading our free analysis today. Please note that the above is just a small fraction of the full analyses that our subscribers enjoy on a regular basis. They include multiple premium details such as the interim targets for gold and mining stocks that could be reached in the next few weeks. We invite you to subscribe now and read today’s issue right away.
Sincerely,
Przemyslaw Radomski, CFA
Founder, Editor-in-chief -
USDX Defends Its Growth Thesis - Will It Pass With Honors?
July 26, 2021, 9:36 AMThe USDX rose above its inverse H&S pattern neckline. After months-long preparation, is it ready to take its final test… and shine?
The USD Index (USDX)
With investors putting the USD Index through a rigorous exam last week (ending Jul. 23), months of study helped the greenback pass the test with flying colors. Case in point: with the USD Index rising above the neckline of its inverse (bullish) head & shoulders pattern, the head implies a medium-term target of roughly 98. On top of that, with the USD Index’s textbook validation adding to the bullish momentum last week – with the greenback verifying its recent breakout and responding with further strength – the U.S. dollar is likely to graduate with honors in the coming months.
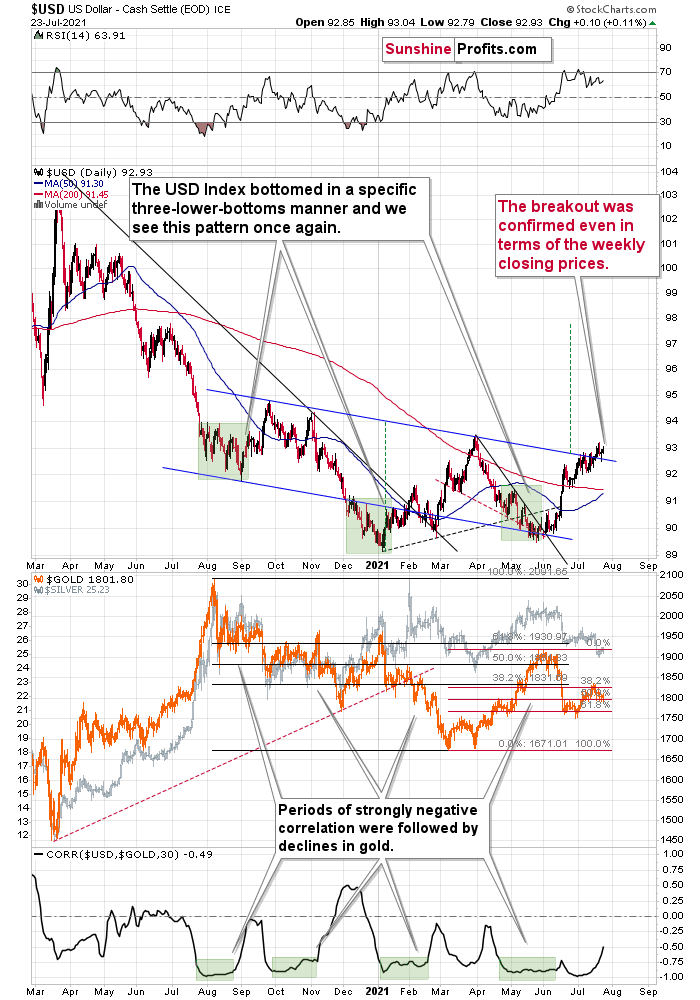
What’s more, the bullish breakout was further validated when the USD Index closed the week above the neck level of its H&S pattern, and it’s difficult to imagine a more sanguine sign for the U.S. dollar. Thus, with the greenback poised to move sharply higher in the coming weeks, gold, silver and mining stocks are likely to head in the opposite direction.
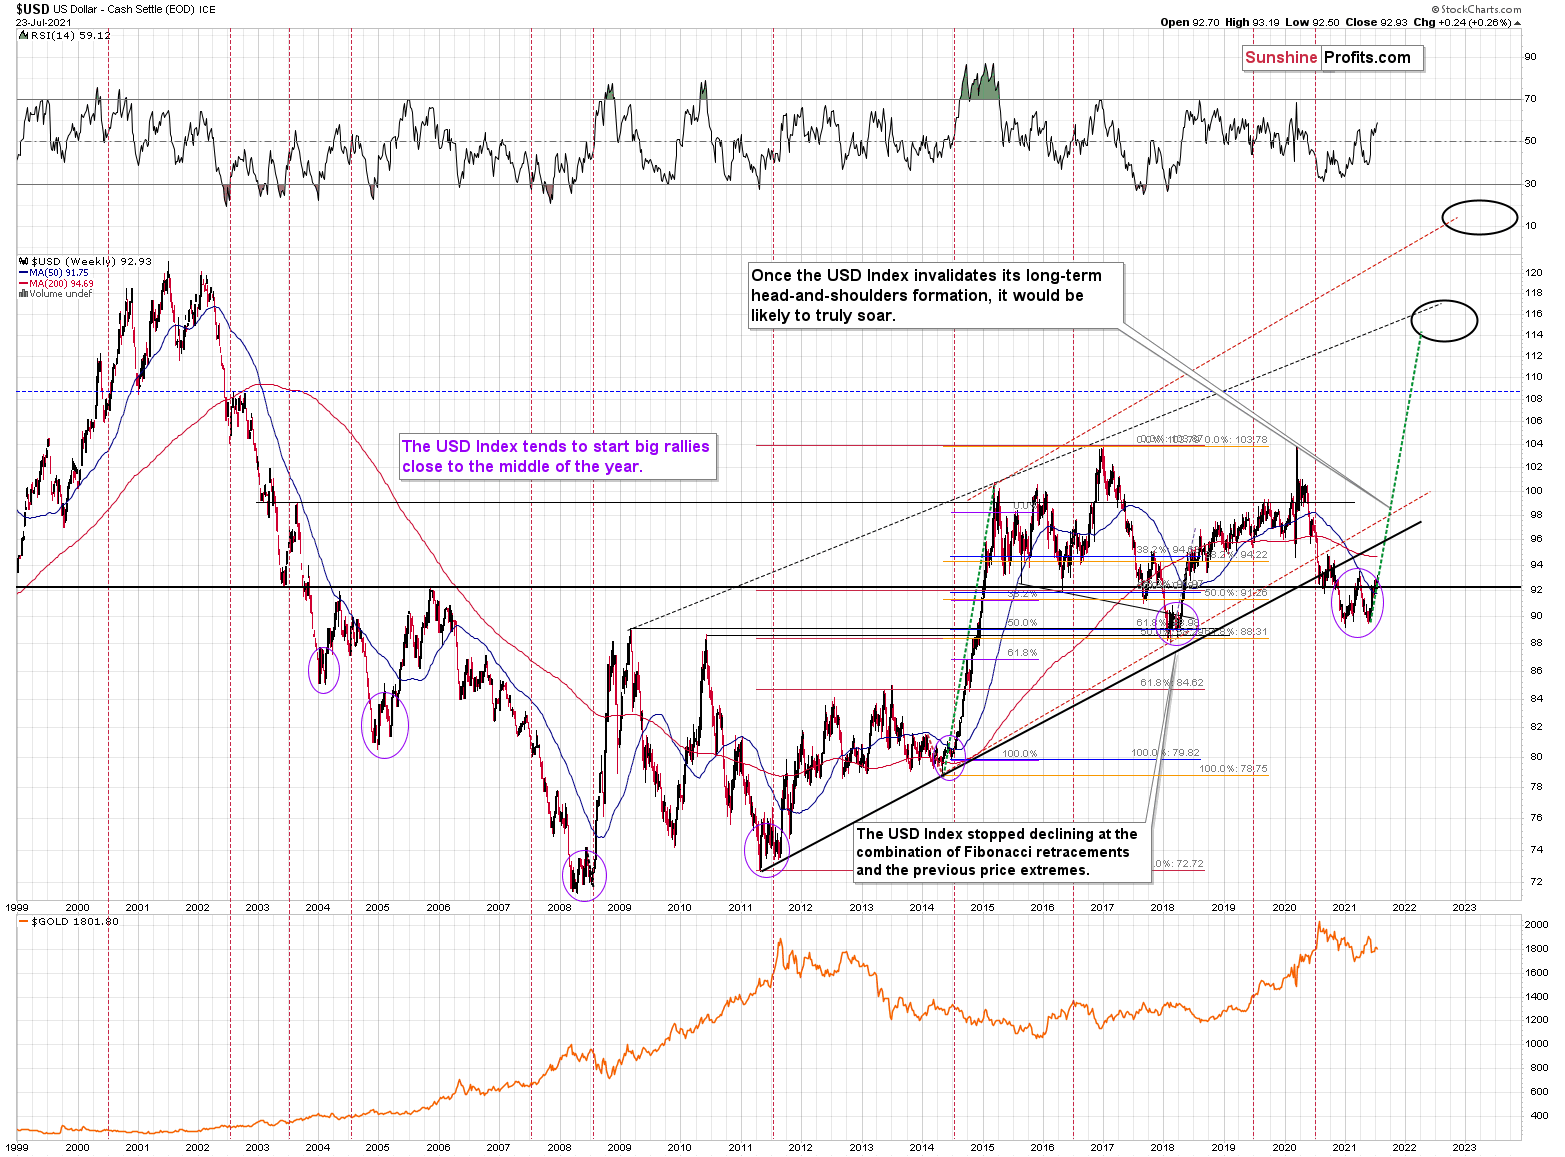
In addition, the USD Index often sizzles in the summer sun. To explain, major USDX rallies often start during the middle of the year, and with the dollar’s bullish IQ often rising with the temperature, gold, silver and mining stocks will likely feel the heat over the medium term.
If you analyze the chart below, you can see that summertime surges have been mainstays on the USD Index’s historical record and double bottoms often signal the end of major declines or ignite significant rallies. For example, in 2004, 2005, 2008, 2011, 2014 and 2018, a retest of the lows (or close to them) occurred before the USD Index began its upward flights. In addition, back in 2008, U.S. equities’ plight added even more wind to the USD Index’s sails. And if the general stock market suffers another profound decline (along with gold miners and silver), a sharp re-rating of the USDX is likely in the cards.
Please see below (quick reminder: you can click on the chart to enlarge it):
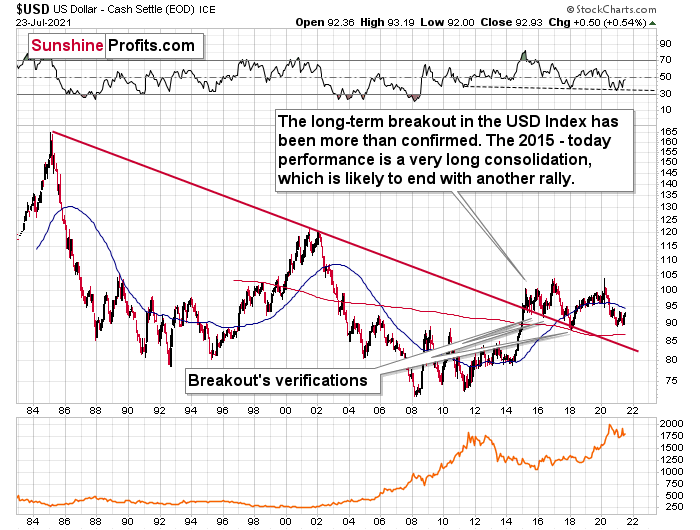
On top of that, the eye in the sky doesn’t lie. And with the USDX’s long-term breakout clearly visible, the smart money is already backing the greenback.
Please see below:
As further evidence, the latest Commitments of Traders (COT) report shows that non-commercial (speculative) futures traders have increased their long exposure to the U.S. dollar (the light blue line below). More importantly, though, with longs bouncing off a roughly 10-year low and the current positioning still well below the highs set in previous years, the U.S. dollar still has plenty of room to run.
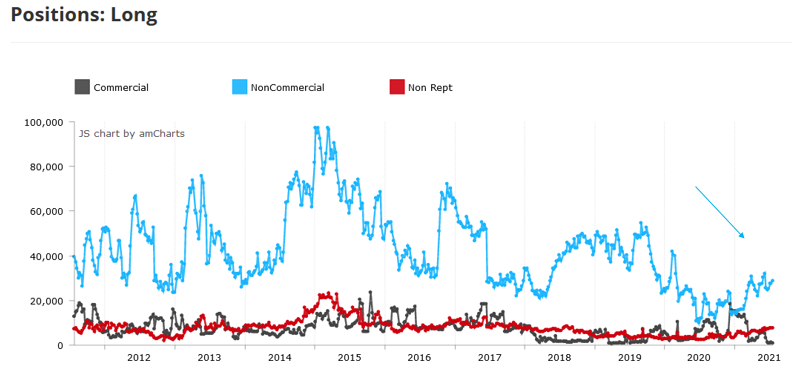 Source: COT
Finally, as the polar opposite of the USD Index, the Euro Index’s recent symmetrical decline mirrors the drawdown that we witnessed in mid-2020. And while the breakdown below the neckline of its bearish head & shoulders pattern still requires further verification, a continuation of the trend could usher the index back to the June 2020 lows or even lower. For context, the EUR/USD accounts for nearly 58% of the movement of the USD Index.
In addition, when the Euro Index reached the neckline of its bearish H&S pattern in early April 2021, late September 2020, and late October 2020, a fierce rally ensued. However, this time around, the corrective upswing has been extremely weak. As a result, with lower highs and lower lows plaguing the Euro Index in recent weeks, it’s likely only a matter of time before the neckline officially breaks.
Please see below:
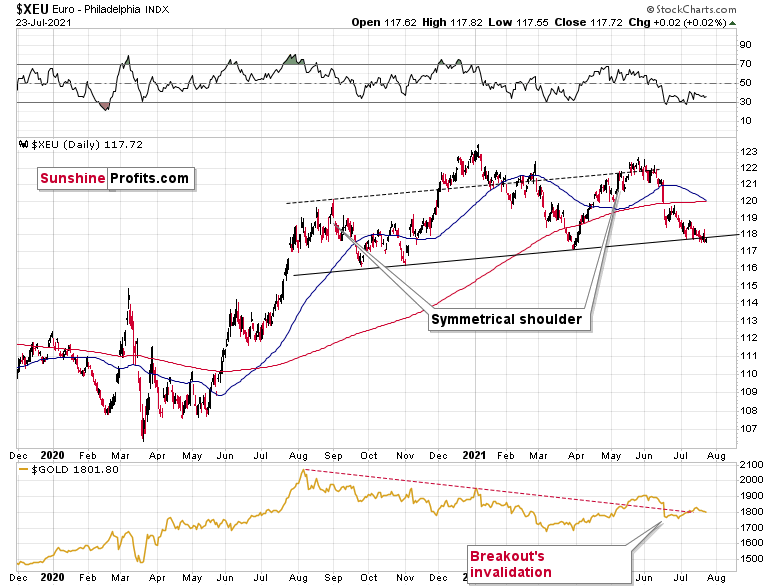
Even more relevant, the completion of the masterpiece could have a profound impact on gold, silver and mining stocks. To explain, gold continues to underperform the euro. If you analyze the bottom half of the chart above, you can see that material upswings in the Euro Index have resulted in diminishing marginal returns for the yellow metal. Thus, the relative weakness is an ominous sign. That’s another point for the bearish price prediction for gold.
The bottom line?
Once the momentum unfolds, ~94.5 is likely the USD Index’s first stop, ~98 is likely the next stop, and the USDX will likely exceed 100 at some point over the medium or long term. Keep in mind though: we’re not bullish on the greenback because of the U.S.’ absolute outperformance. It’s because the region is fundamentally outperforming the Eurozone, and the relative performance is what really matters.
In conclusion, the USD Index will likely emerge victorious in this epic battle of wits. Moreover, with the GDXJ ETF (our short position) avoiding mirroring gold’s recent strength, it seems that when the USDX finally does rally profoundly, junior mining stocks will fall substantially. However, following a profound climax, gold, silver and mining stocks will likely resume their secular uptrends.
Thank you for reading our free analysis today. Please note that the above is just a small fraction of the full analyses that our subscribers enjoy on a regular basis. They include multiple premium details such as the interim targets for gold and mining stocks that could be reached in the next few weeks. We invite you to subscribe now and read today’s issue right away.
Sincerely,
Przemyslaw Radomski, CFA
Founder, Editor-in-chief -
FED: A Psychological Battle Held Against Investors
July 23, 2021, 7:29 AMEven if the FED’s taper doesn’t come until 2023, the threat itself will have a material psychological effect. Will we keep a clear head in September?
The Worst Kept Secret
While investors worried that the European Central Bank (ECB) would turn hawkish as the summer months heat up, I warned on Apr. 27 that the prospect was quite laughable.
I wrote:
There seems to be some confusion about the European Central Bank’s (ECB) – and other major central banks’ – suspension of their 84-day U.S. dollar liquidity operations. For context, the swap facility was created to ensure that U.S. dollars remained abundant during the coronavirus crisis. However, keep in mind that “an important liquidity backstop to ease strains in global funding markets,” is code for avoiding a large spike in the U.S. dollar. The bottom line? The suspension of the facility is not bearish for the greenback, if anything, it’s bullish because it reduces the available supply of U.S. dollars.
If that wasn’t enough, recent whispers of the ECB tapering its bond-buying program are extremely premature. With the European economy still drastically underperforming the U.S., it’s actually more likely that the ECB increases the pace of its bond-buying program.
The U.S. Federal Reserve (FED) and the ECB are worlds apart. With the FED likely to reveal its taper timeline in September, inflation differentials highlight the regional dichotomy.
Please see below:
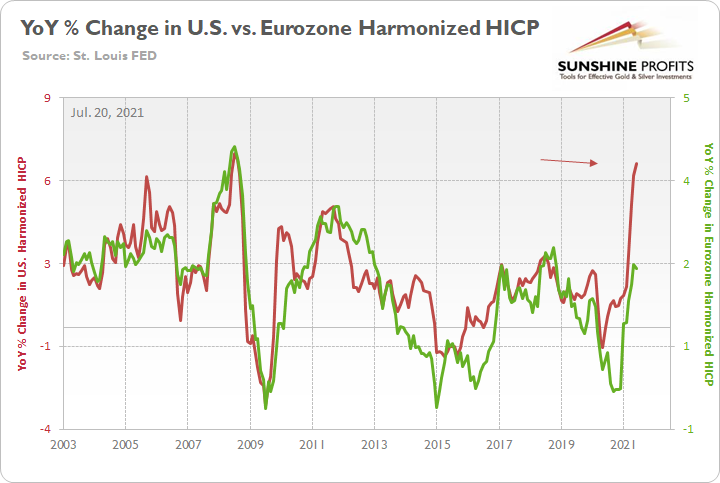
To explain, the green line above tracks the year-over-year (YoY) percentage change in the Eurozone Harmonized Index of Consumer Prices (HICP), while the red line above tracks the YoY percentage change in the U.S. HICP. If you analyze the right side of the chart, it’s not even close. And with the U.S. HICP rising by 6.41% YoY in June and the Eurozone HICP rising by 1.90%, the FED is likely to taper well in advance of the ECB.
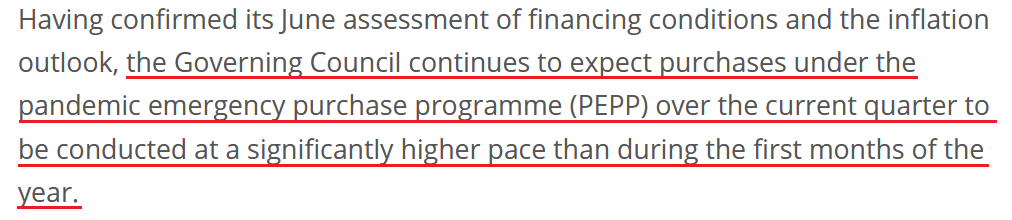
And with the ECB releasing its monetary policy decision on Jul. 22, the Governing Council “revised its forward guidance on interest rates” (spoiler alert, lower for longer) and it doubled down on its “commitment to maintain a persistently accommodative monetary policy stance to meet its inflation target.”
Please see below:
 Source: ECB
On top of that:
“The Governing Council also intends to continue reinvesting, in full, the principal payments from maturing securities purchased under the APP for an extended period of time past the date when it starts raising the key ECB interest rates, and in any case for as long as necessary to maintain favourable liquidity conditions and an ample degree of monetary accommodation.”
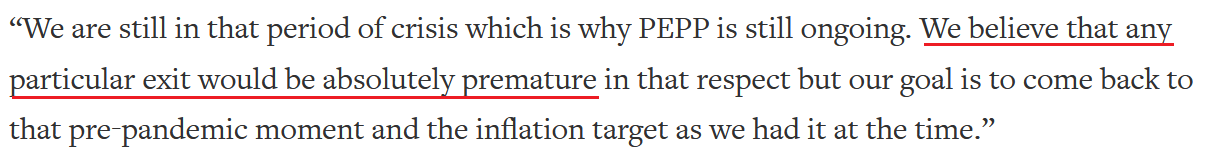
Furthermore, ECB President Christine Lagarde removed any doubt during her press conference on Jul. 22:
 Source: Reuters
 She added:
“The forward guidance rests on three key criteria’s if you will:
We see inflation reaching 2% well ahead of the end of our projection or rising, that’s like number one and number two, durably for the rest of the projection horizon. And thirdly, we judge that realized progress in underlying inflation is sufficiently advanced to be consistent with inflation stabilizing at 2% over the medium term …. So, by these three legs, we’re essentially saying, first of all, that we want to see inflation reach 3% well ahead of the end of our projection horizon.”
And why is this quote so important? Well, because Euro area inflation (released on Jul. 16) rose by 1.90% year-over-year (YoY) in June. And if the ECB wants inflation to reach 3% well before it turns hawkish, any talk of a forthcoming taper is much more semblance than substance.
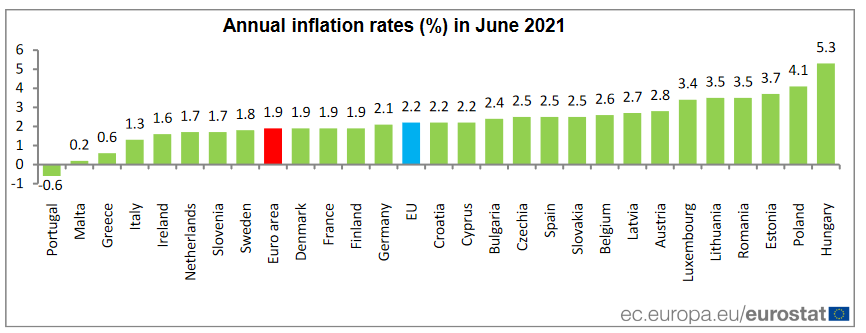
The bottom line? With the U.S. Consumer Price Index (CPI) surging by 5.32% YoY in June and tracking well ahead of the Eurozone, again, the FED and the ECB are worlds apart.
Kansas City FED Has Something to Say
Speaking of inflation, the Kansas City FED released its Tenth District Manufacturing Survey on Jul. 22. And with its prices paid index remaining “near record highs” and its prices received index hitting an all-time high, inflationary momentum in the U.S. remains robust.
Please see below:
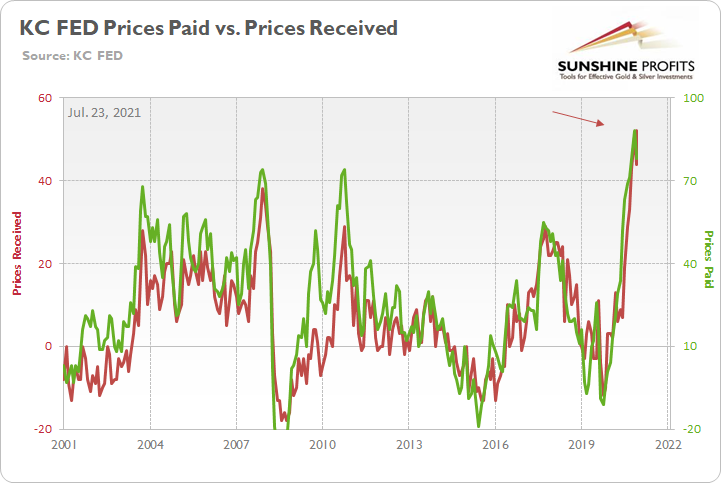
To explain, the green line above tracks the KC FED’s prices paid index, while the red line above tracks the KC FED’s prices received index. If you analyze the right side of the chart, you can see that both remain extremely elevated.
What’s more, while the “month-over-month composite index was 30 in July, up from 27 in June and 26 in May … indexes for shipments, new orders, order backlog, and new orders for exports rose at a faster pace in July, and supplier delivery time increased.” Moreover, while the “future composite index edged down from the record high 37 in June to 33 in July, [it’s] still indicating solid expectations over the next six months.”
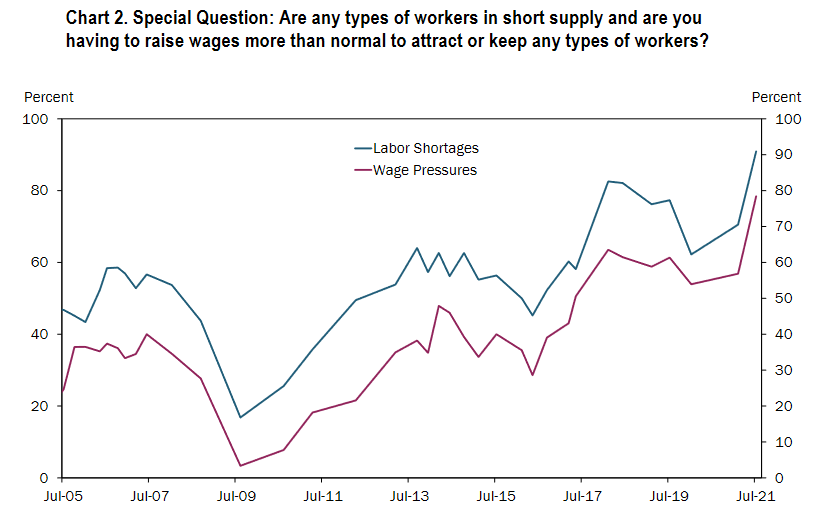
On top of that, “91% of firms reported workers were in short supply, more than any time previously asked in survey history. Wage pressures also surpassed survey records as 78% of firms reported having to raise wages more than normal to attract or keep workers. To attract new talent, 72% of manufacturers reported raising compensation, 60% reported hiring less qualified workers with more on the job training, and another 60% increased advertising for open positions.”
Please see below:
 Source: KC FED
For anecdotal evidence, please have a look at respondents’ opinions about the current economic climate:
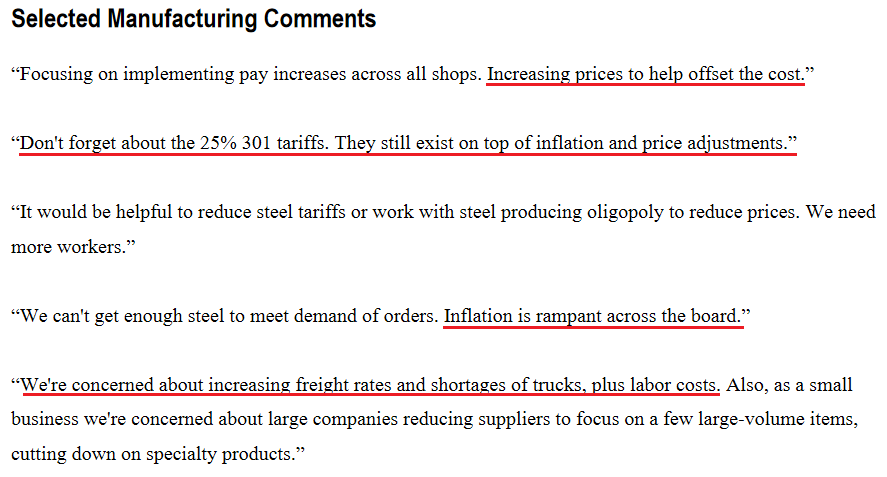 Source: KC FED
Who’s Talking About Inflation? Harley-Davidson?
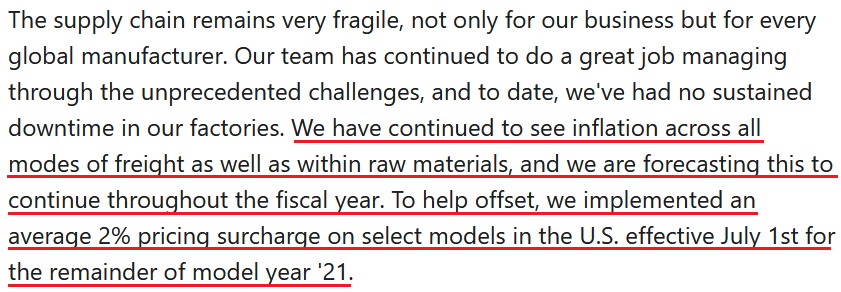
Finally, Harley-Davidson – an American motorcycle manufacturer – is also sounding the alarm on inflation. During its second-quarter earnings call on Jul. 21, CFO Gina Goetter said the following:
“In terms of impact within the quarter and as you think about the margin change, the raw material increase was worth about two points of margin. So it was fairly material. And then you add on top of that all the logistics rate inflation that we're seeing that was roughly another three points of margin. So, those headwinds that are coming at us are roughly five points of margin within the quarter.”
And how is the company responding to the inflationary pressures?
 Source: Harley-Davidson/The Motley Fool
The bottom line? With inflation surging and the FED likely to announce its taper timeline in September, the time-tested relationship of ‘U.S. dollar up, PMs down’ will likely be a major storyline during the Autumn months.
In conclusion, the gold miners continued underperformance of gold is an ominous sign for the PMs’ medium-term outlook. With the former unable to gain any traction even while the U.S. 10-Year real yield languishes, the threat of a FED taper is having a material psychological effect on investors. Moreover, with the ECB turning dovish at a time when the FED is turning hawkish, the EUR/USD’s plight has helped uplift the USD Index (the currency pair accounts for nearly 58% of the USD Index’s movement). As a result, while the PMs’ long-term outlook remains bright, a rising U.S. dollar will likely dampen their performance over the next few months.
Thank you for reading our free analysis today. Please note that the above is just a small fraction of the full analyses that our subscribers enjoy on a regular basis. They include multiple premium details such as the interim targets for gold and mining stocks that could be reached in the next few weeks. We invite you to subscribe now and read today’s issue right away.
Sincerely,
Przemyslaw Radomski, CFA
Founder, Editor-in-chief


Gold Investment News
Delivered To Your Inbox
Free Of Charge
Bonus: A week of free access to Gold & Silver StockPickers.
Gold Alerts
More-
Status
New 2024 Lows in Miners, New Highs in The USD Index
January 17, 2024, 12:19 PM -
Status
Soaring USD is SO Unsurprising – And SO Full of Implications
January 16, 2024, 8:40 AM -
Status
Rare Opportunity in Rare Earth Minerals?
January 15, 2024, 2:06 PM

