
tools spotlight

-
Still Hiding? Nothing’s Changed, Get Out of the Bear’s Den!
August 24, 2021, 8:29 AMI could write a nice lengthy introduction today, but it seems that there’s only one question on your mind right now, so I’ll quickly address it instead. Has the outlook for gold, silver, and mining stocks become bullish because of yesterday’s rally? My answer is: no, it hasn’t changed.
Let’s jump into the charts.
Support the Dollar
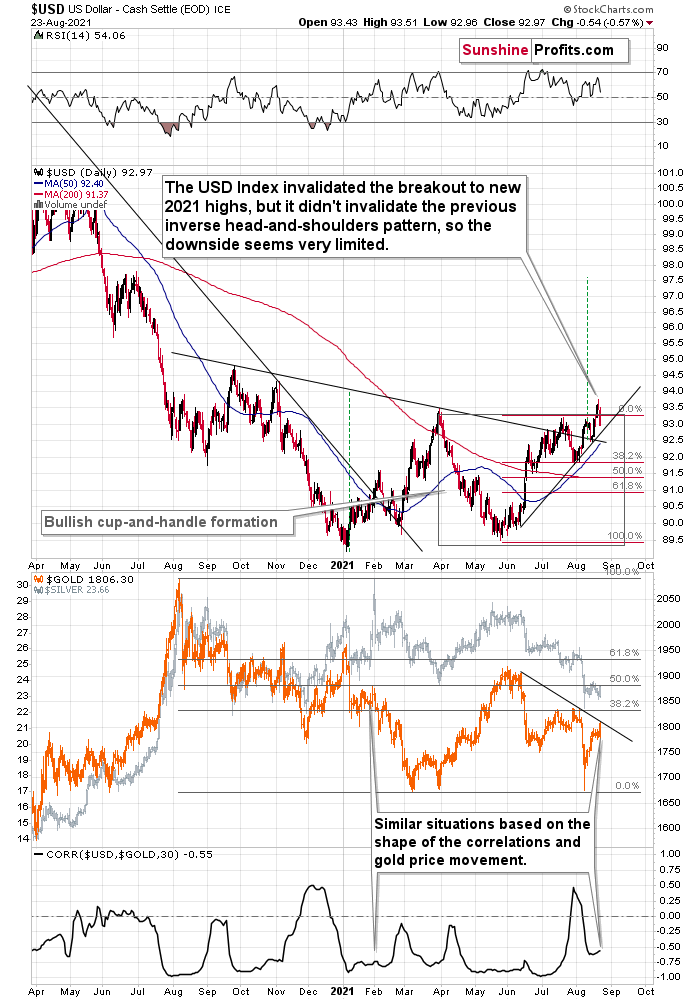
The USD Index invalidated the breakout to new 2021 highs, but it didn't invalidate the previous inverse head-and-shoulders pattern, so the downside seems very limited.
There’s a rising short-term support line based on the June and July lows that currently “says” that the USD Index is unlikely to fall below ~92.75. At the moment of writing these words, the USD Index is trading at about 93.07, so it’s very close to above-mentioned level.
And even if the USDX declines below it, there’s support at about 92.5 provided by the neck level of the previously confirmed inverse head-and-shoulders pattern. This means that the USDX is unlikely to decline below this level, and this in turn means that the downside seems to be limited to about 0.6 index point. That’s not a lot.
Remember when the USD Index previously invalidated the breakout above the inverse H&S pattern? I wrote then that it could decline to the nearest support level provided – then – by the 38.2% Fibonacci retracement. Now the nearest support is provided by the rising support line at about 92.75.
This doesn’t mean that gold will necessarily rally from here or that the rally will be substantial. On the lower part of the above chart, you can see that gold moved to its declining resistance line, which means that it could decline right away. We can see it more clearly on the gold chart below.
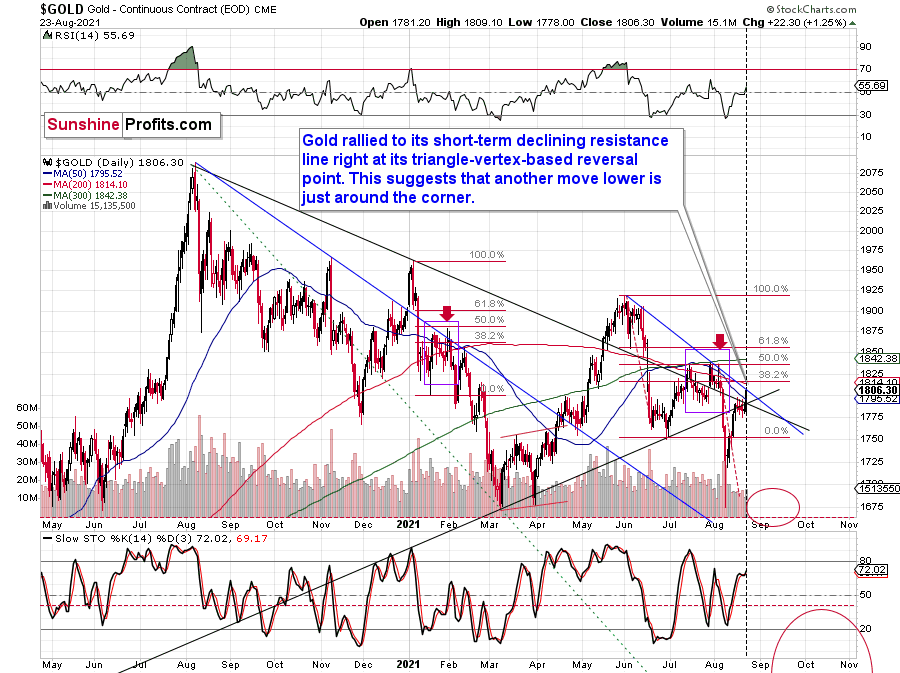
In this case, I marked the declining short-term resistance line with blue. The combination of the resistance line being reached with the fact that gold did that right on its reversal day indicated by the triangle’s vertex makes it even more likely that gold will reverse its course shortly.
We can see the same thing – gold moving to its resistance line – also when we look at its performance through its most popular proxy – the GLD ETF.
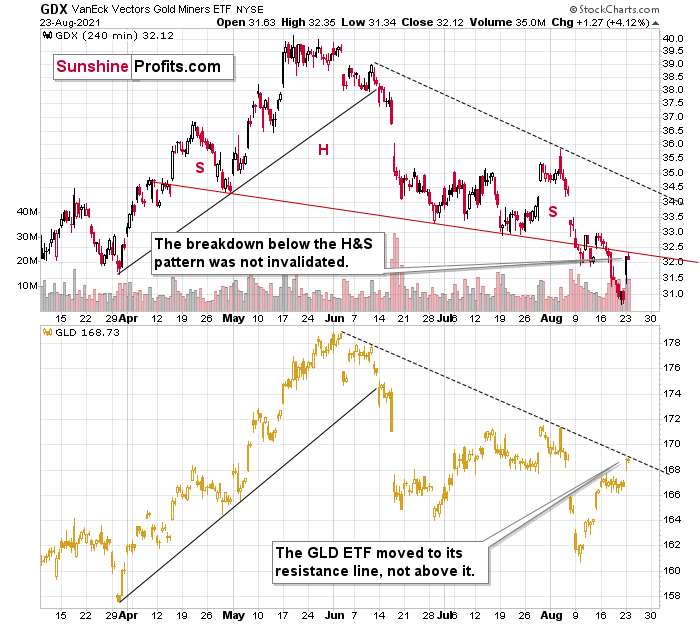
In this case, we can compare where gold rallied to where the mining stocks (the GDX ETF) rallied. And while the GLD moved to its declining resistance line, the GDX ETF was not even close to its analogous dashed declining resistance line.
Instead, the GDX ETF moved back to its previously broken neckline of the head and shoulders pattern and closed slightly below it.
This is more important than comparing the GDX’s closing price to its previous yearly low — it closed slightly above it.
The 2013 Analogue Still in Play
And speaking of mining stocks, the HUI Index closed slightly above its previous March lows (in terms of the closing prices), but it was just 0.24 index point rally above it.
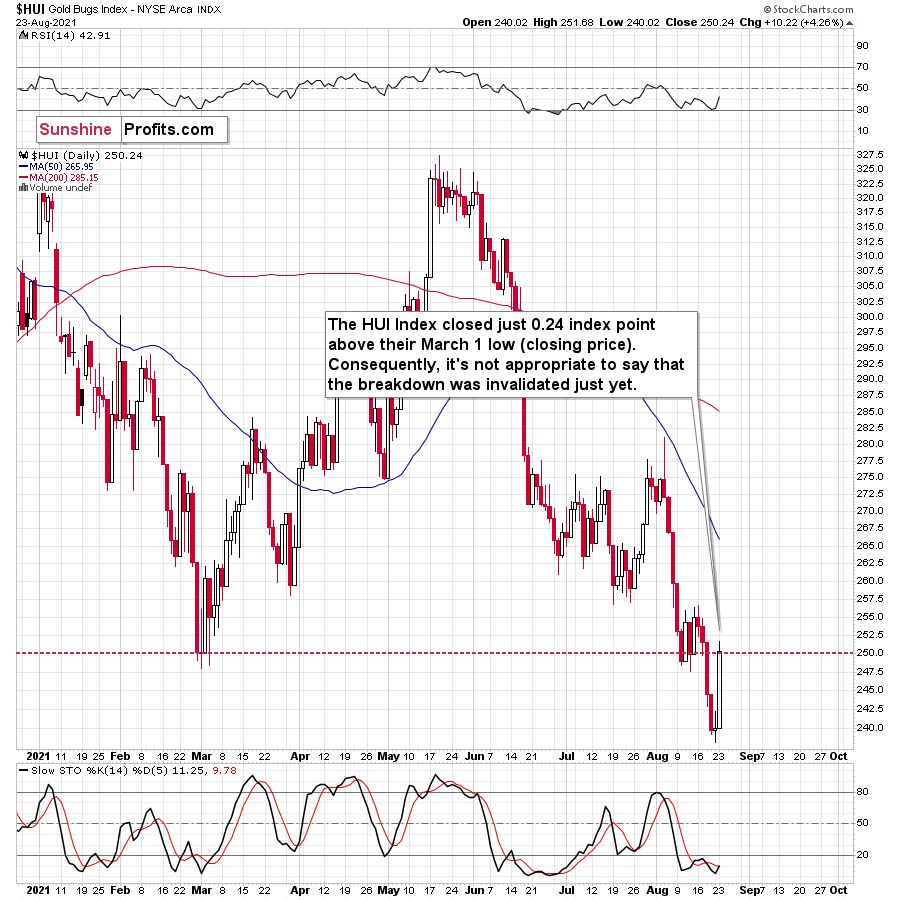
Consequently, it’s not appropriate to say that the breakdown was truly invalidated. It’s kind of a “gray area” of invalidations. That’s not the most important point of view though.
The most important point of view is the broad point of view.

Do you see any change with regard to the similarity between now and what happened in 2013? No? Because nothing changed with regard to it.
It’s useful to keep in mind that the current post-broad-head-and-shoulders pattern is not only similar to what happened in 2013 but also to what happened in 2008 and… in 2000. In the case of the former, there were ~4%-8% corrective upswings after the breakdown below the H&S pattern. In the case of the 2008 slide, there was no short-term correction, and in the case of the 2000 decline, there was even a corrective upswing that pretended (!!!) to invalidate the head and shoulders pattern, after which the HUI Index declined about half of its value.
Gold stocks moved higher about 4% so far this week. This is in perfect tune with what happened in 2013 and in 2000.
In fact, let’s check what exactly happened in 2013 in the GDX ETF.
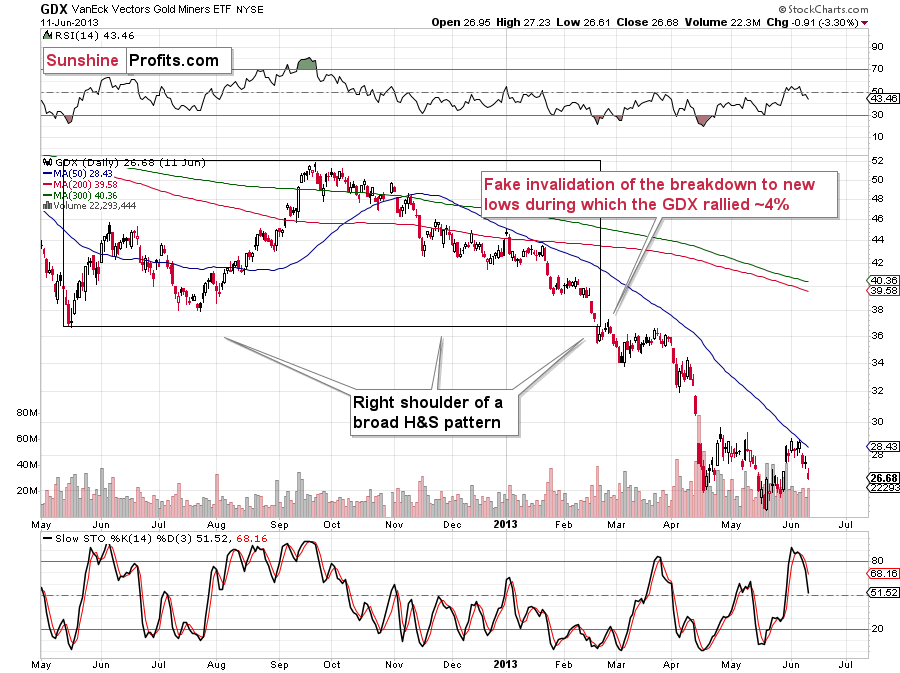
Right after breaking below the previous lows, there was a ~4% rally that took the GDX ETF above the previous low in terms of the closing price, but only slightly so. Seems familiar?
Yes, that’s exactly what happened yesterday.
If the analogy to 2013 is being repeated almost to the letter, should this performance be really treated as something bullish? No.
Thank you for reading our free analysis today. Please note that the above is just a small fraction of the full analyses that our subscribers enjoy on a regular basis. They include multiple premium details such as the interim targets for gold and mining stocks that could be reached in the next few weeks. We invite you to subscribe now and read today’s issue right away.
Sincerely,
Przemyslaw Radomski, CFA
Founder, Editor-in-chief -
USDX Resurgence: Don’t Let It Catch You Flat-Footed!
August 23, 2021, 7:40 AMWith its negative correlation to the metals, the USDX rally weighed heavily on gold, silver and stocks. Stop and think: what would be if it continued?
While the overwhelming majority of investors entered 2021 with a bearish outlook for the U.S. dollar, our optimism has proved quite prescient. The USDX bottomed at the beginning of the year. With the USD Index hitting a new 2021 high last week – combined with the EUR/USD, the GDX ETF, the GDXJ ETF, and the price of silver (in terms of the closing prices) hitting new 2021 lows – the ‘pain trade’ has caught many market participants flat-footed. Even silver stocks (the SIL ETF) closed at new yearly lows.
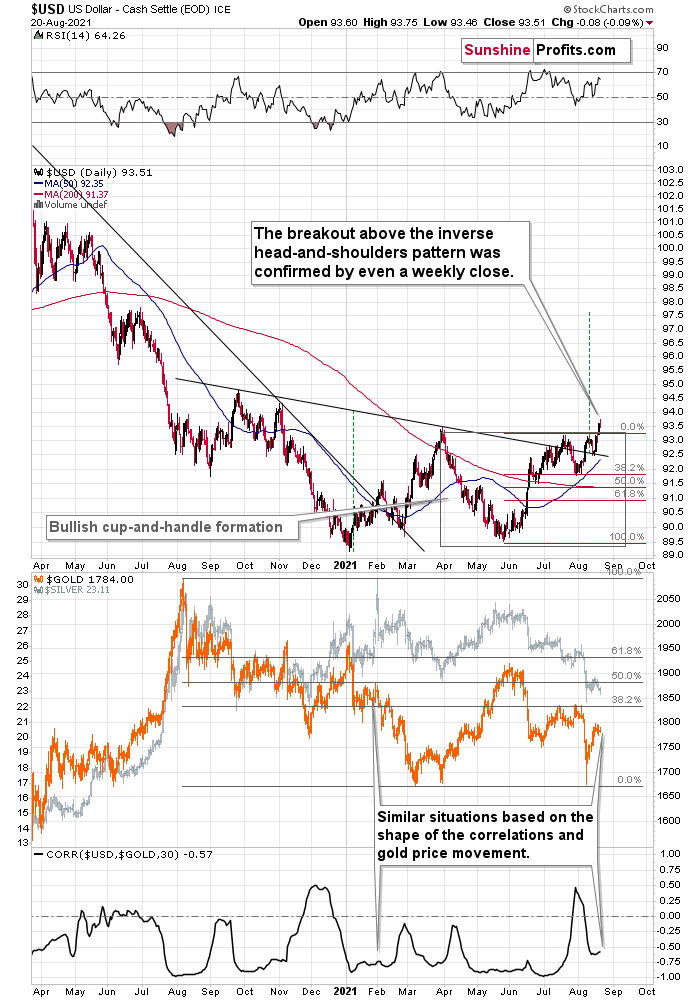
Moreover, after the USD Index surged above the neckline of its inverse (bullish) head & shoulders pattern and confirmed the breakout above its cup and handle pattern, the combination of new daily and weekly highs is quite a bullish cocktail. Given all that, even if a short-term pullback materializes, the USDX remains poised to challenge ~97.5 - 98 over the medium term — perhaps even over the short term (next several weeks).
Please see below:
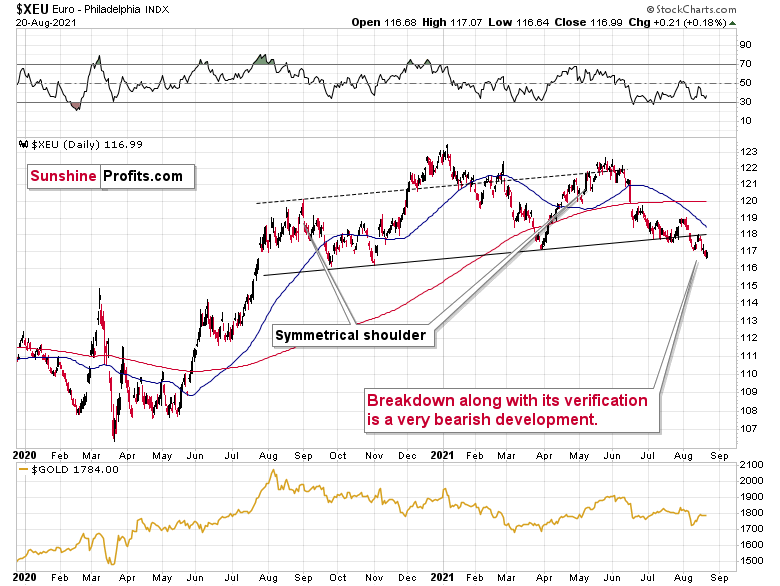
Furthermore, as the USD Index seeks higher ground, the euro has fallen off a cliff. For context, the EUR/USD accounts for nearly 58% of the movement of the USD Index, and that’s why the currency pair’s performance is so important. If you analyze the chart below, you can see that the Euro Index has confirmed the breakdown below its bearish head & shoulders pattern, and the ominous event was further validated after the back-test of the breakdown failed and the Euro Index hit a new 2021 low.
Please see below:
Eye In the Sky Doesn’t Lie
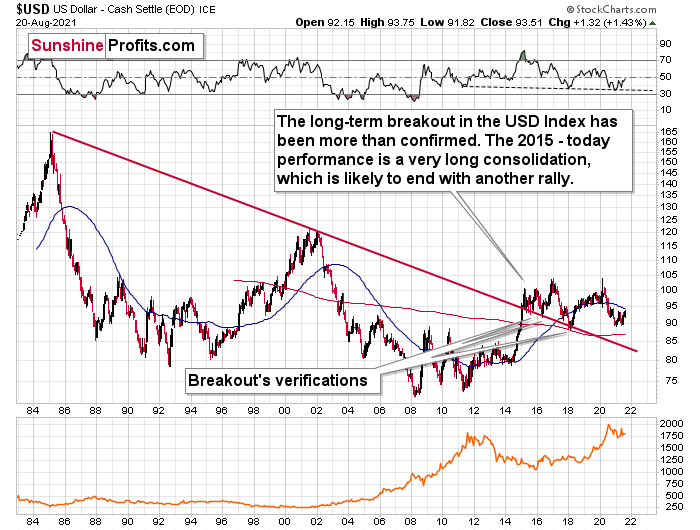
What is signaling trouble for dollar bears as well, the USD Index often sizzles in the summer sun and major USDX rallies often start during the middle of the year. Summertime spikes have been mainstays on the USD Index’s historical record and in 2004, 2005, 2008, 2011, 2014 and 2018 a retest of the lows (or close to them) occurred before the USD Index began its upward flights (which is exactly what’s happened this time around).
What’s more, profound rallies (marked by the red vertical dashed lines below) followed in 2008, 2011 and 2014. With the current situation mirroring the latter, a small consolidation on the long-term chart is exactly what occurred before the USD Index surged in 2014. Likewise, the USD Index recently bottomed near its 50-week moving average; an identical development occurred in 2014. More importantly, though, with bottoms in the precious metals market often occurring when gold trades in unison with the USD Index (after ceasing to respond to the USD’s rallies with declines), we’re still far away from that milestone in terms of both price and duration.
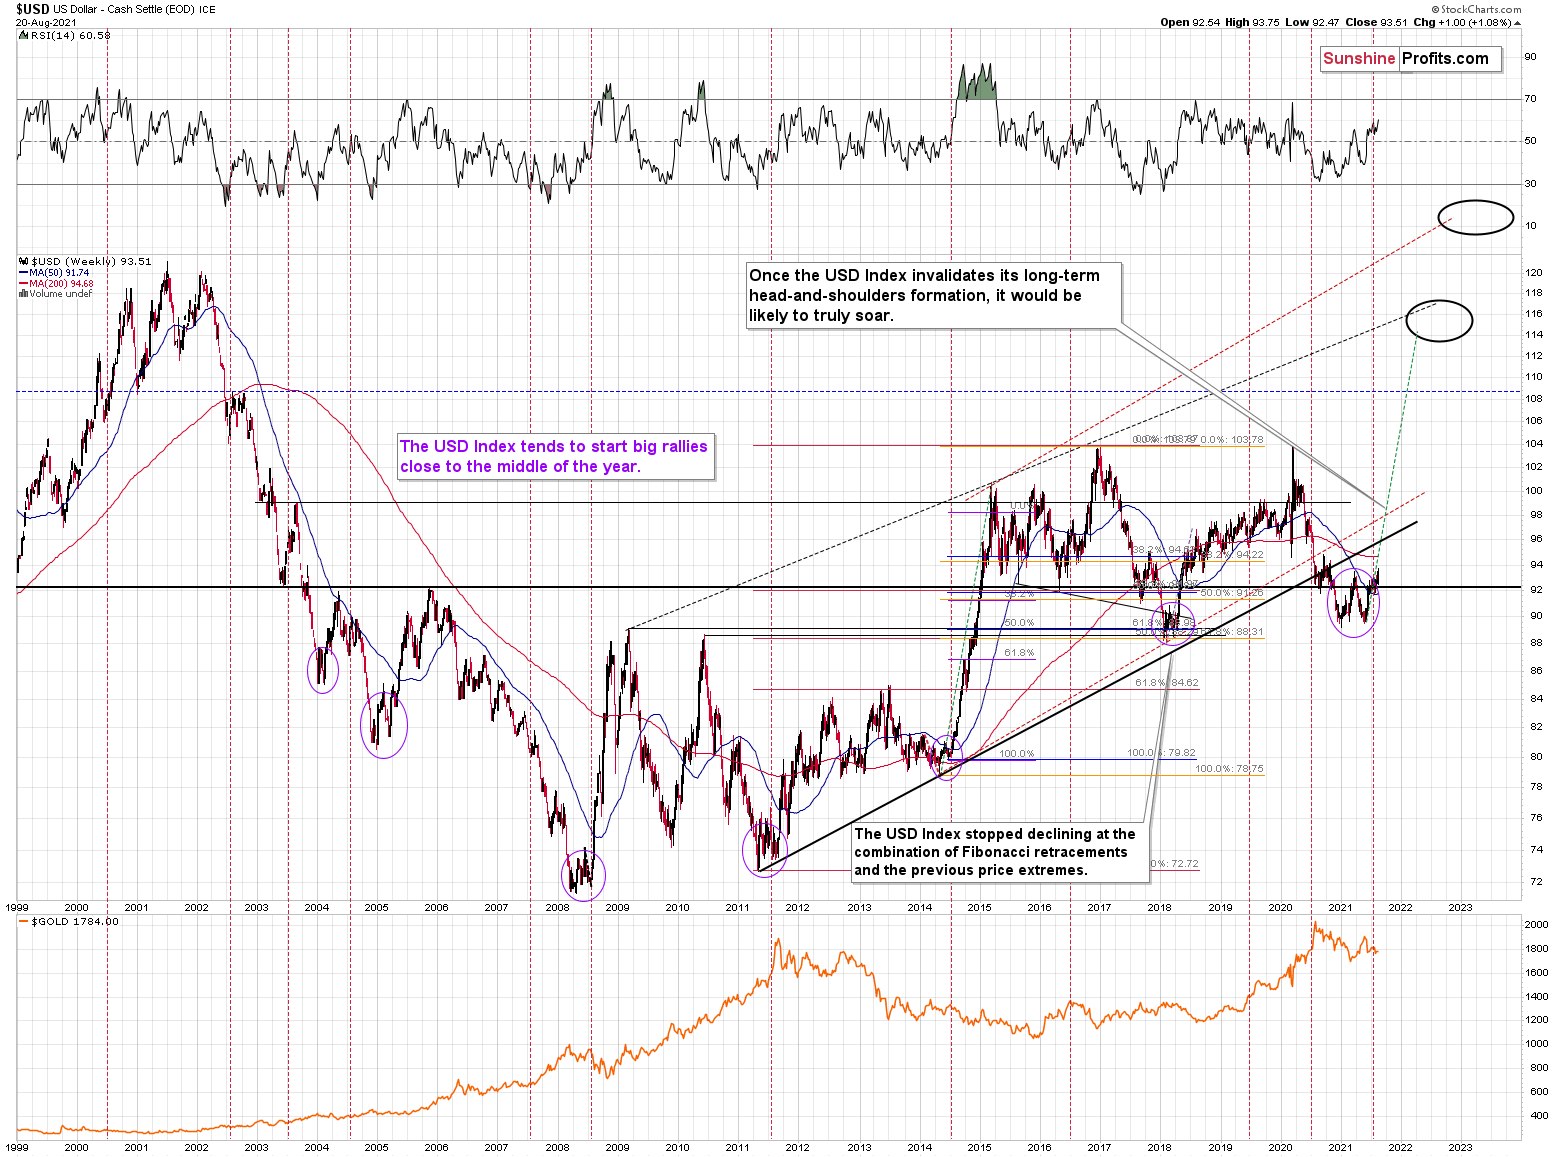
Just as the USD Index took a breather before its massive rally in 2014, it seems that we saw the same recently. This means that predicting higher gold prices here is likely not a good idea.
Ok, but didn’t we just see strength in gold – the one that you just wrote about? The USD Index soared last week by a full index point, and yet gold didn’t decline…
That’s a good question, but the context is very important when analyzing specific price moves and their relative strengths. As I wrote earlier, we saw new yearly lows in practically every other important asset used for determining next moves in the precious metals sector: the EUR/USD, silver, and mining stocks (including practically all noteworthy ETFs and indices). So, did gold really show strength by not declining despite the USD’s strength, or was gold’s performance just a small, local deviation from the ongoing trend? Since practically everything else points to lower PM prices in the next weeks, the latter is more probable.
Besides, there are both: technical and fundamental reasons for gold to behave in this way right now.
The technical reason comes from the looming triangle-vertex-based turning point in gold, which is due today.
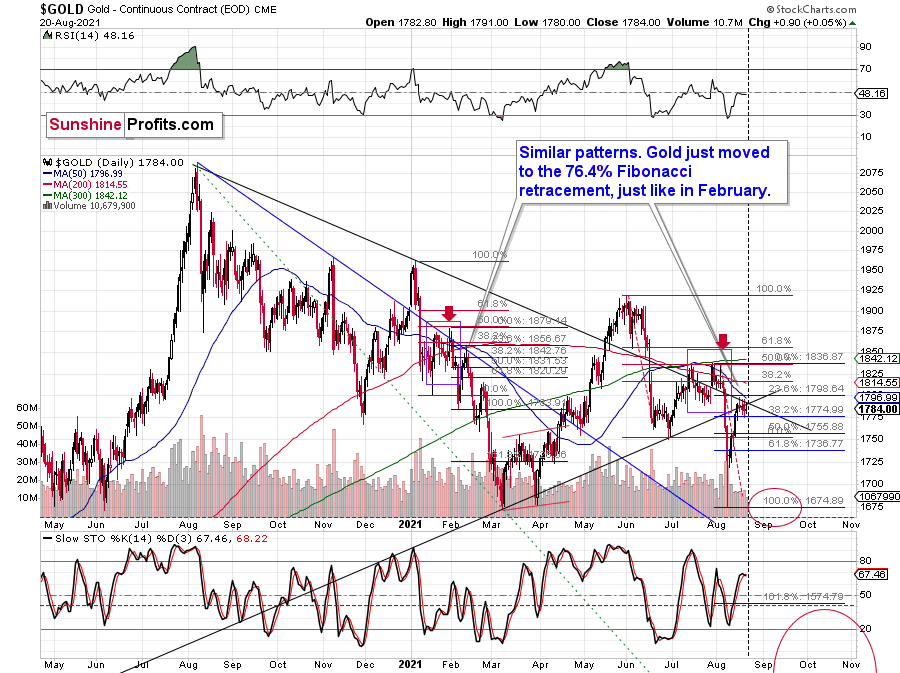
The rising black support line starts at the 2020 low, which is not visible on the chart.
Since these points work on a near-to basis, we might see a turnaround today or within the next few days.
Seen Anything on the News Recently?
Fundamentally, did anything important from the geopolitical point of view happen recently? Like, for example, the U.S. withdrawing from Afghanistan? Exactly…
Geopolitical events tend to impact gold much more than they impact other parts of the precious metals sector, which serves as a perfect explanation of why gold didn’t decline along with the rest of the PMs. As a reminder, geopolitical events usually have a visible but temporary impact on the gold price. They change its short-term price moves, but they don’t change the forecast for gold in general.
Consequently, it was not really the strength in gold vs. the USD Index that took place last week. It was a mix of the above and gold’s weakness relative to what happened in a geopolitical arena sprinkled with technicals. All in all, it’s not bullish for the PMs.
On top of that, the eye in the sky doesn’t lie. And with the USDX’s long-term breakout clearly visible, the smart money is already backing the greenback.
Please see below:
Finally, while short covering helped propel the USD Index higher last week, speculators’ positioning still has room to run. For example, while the latest Commitments of Traders (COT) report shows that net-positioning (long 19,211 contracts) by non-commercial (speculative) futures traders is near its 2021 highs, enthusiasm for the U.S. dollar is still well below the highs witnessed in previous years.
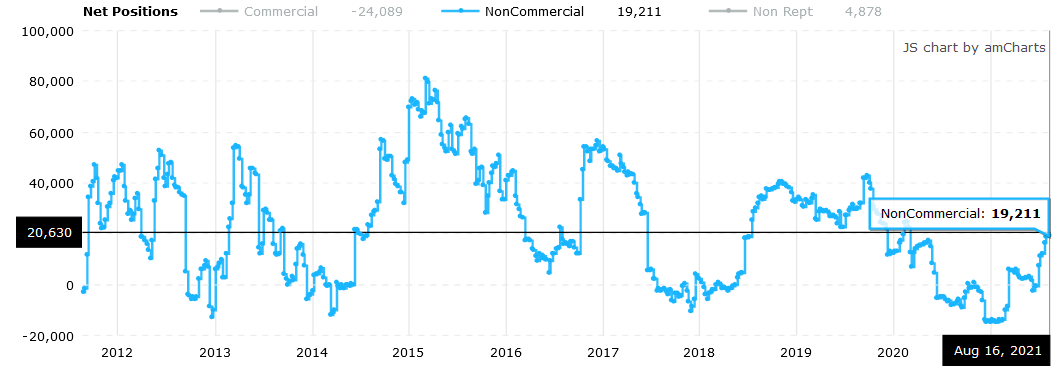 Source: COT
The bottom line?
Once the momentum unfolds, ~94.5 is likely the USD Index’s first stop, ~98 is likely the next stop, and the USDX will likely exceed 100 at some point over the medium or long term. Keep in mind though: we’re not bullish on the greenback because of the U.S.’ absolute outperformance. It’s because the region is fundamentally outperforming the Eurozone, the EUR/USD accounts for nearly 58% of the movement of the USD Index, and the relative performance is what really matters.
In conclusion, the U.S. dollar’s resurgence has weighed heavily on gold, silver and mining stocks. And with the technicals, fundamentals and shifting sentiment supporting a higher USD Index over the medium term, the metals’ strong negative correlation with the U.S. dollar should give investors a cause for pause. To that point, while we’re bullish on gold, silver and mining stocks’ long-term prospects, sharp declines will likely materialize over the medium term before they continue their secular uptrends.
Thank you for reading our free analysis today. Please note that the above is just a small fraction of the full analyses that our subscribers enjoy on a regular basis. They include multiple premium details such as the interim targets for gold and mining stocks that could be reached in the next few weeks. We invite you to subscribe now and read today’s issue right away.
Sincerely,
Przemyslaw Radomski, CFA
Founder, Editor-in-chief -
Gold Stocks Break to New Yearly Lows!
August 20, 2021, 8:26 AMLadies and gentlemen, we have a breakdown! Gold stocks underperformed the yellow metal so much that they reached the lowest levels seen this year…
The HUI Index (gold stocks) broke to new 2021 lows while the USD Index broke to new 2021 highs. Just as I’ve been warning you.
Mining stocks’ extreme weakness relative to gold continued yesterday, and while it may seem like the weakness has to have a limit, this limit is likely still quite far from the markets right now.
Let’s take a look at the long-term HUI Index chart for details.
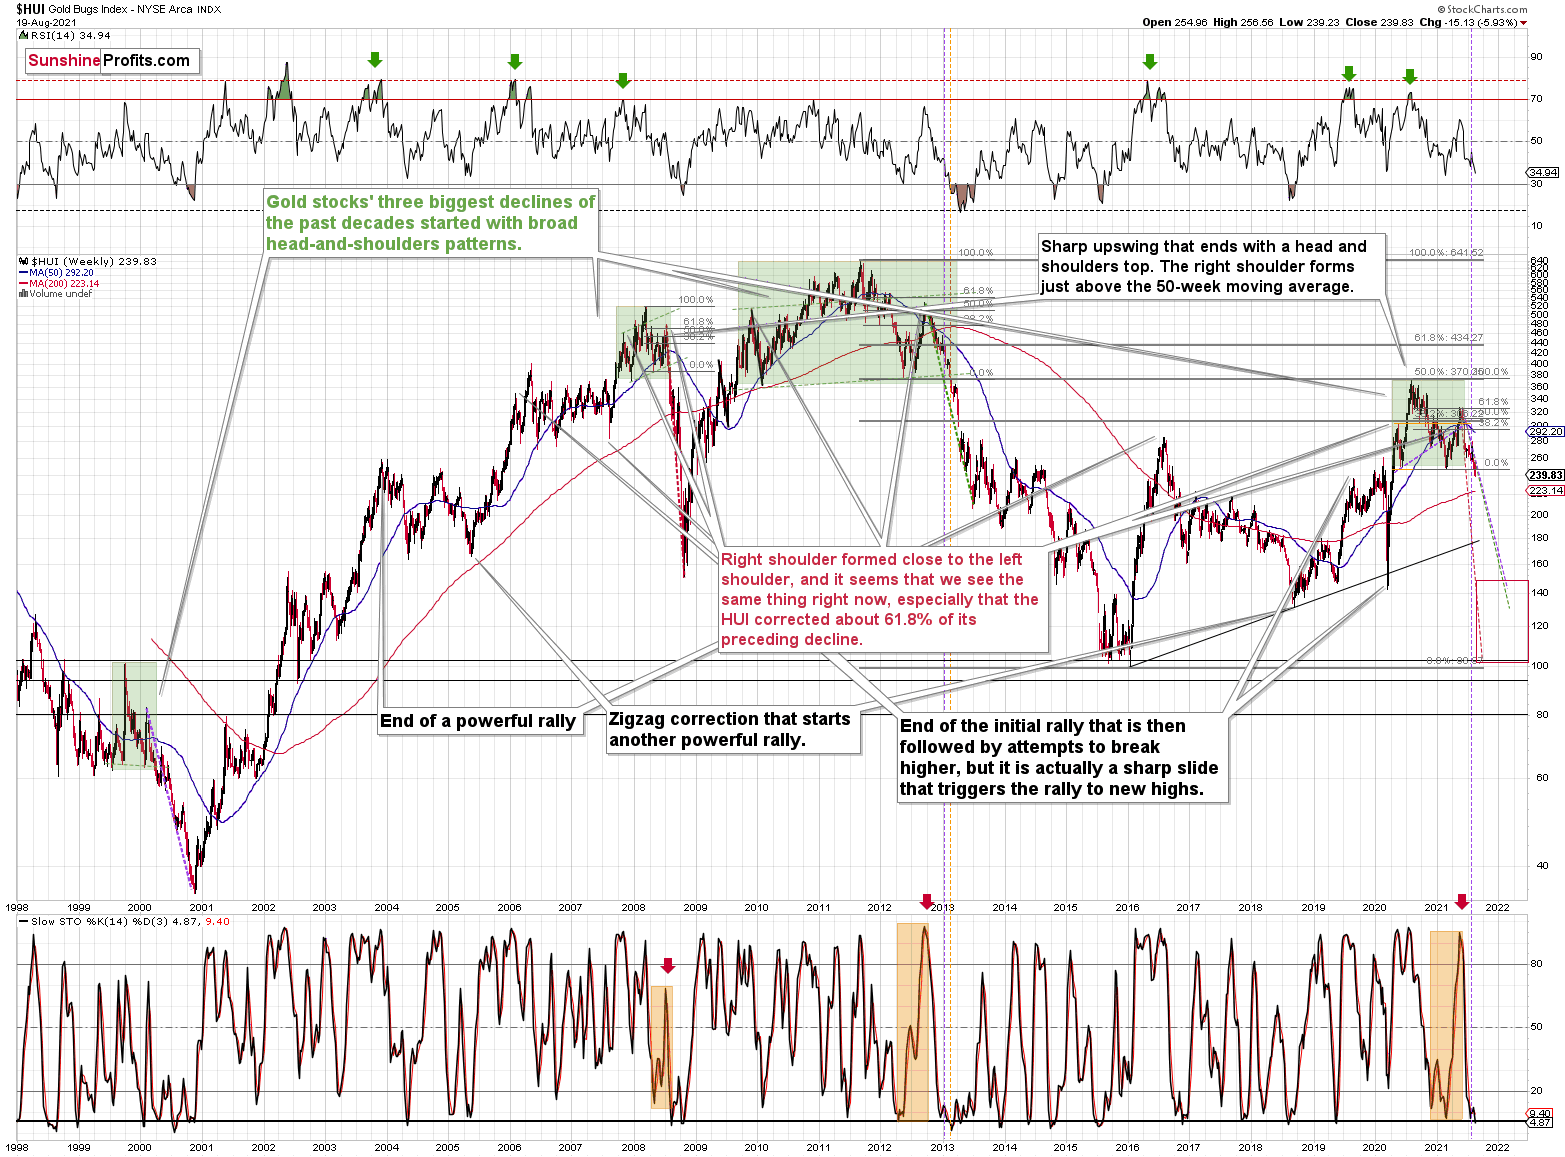
Remember when I told you that the tiny buy signal from the stochastic indicator was unlikely to trigger anything more than a brief pause? That was based on the analogy to what happened in late 2012 when miners paused, and then the decline simply continued. Well, gold stocks did exactly that and gold stocks declined once again. Right now, they are right after the breakdown to new yearly lows, and this has profound implications in light of the analogy to the 2012 – 2013 decline.
You see, when the HUI Index declined below the previous lows back in 2013, it meant that the biggest part of the slide was underway. The profit potential was still there, as it was still the first half of the biggest decline, but it meant that waiting for another big rebound in order to add to one’s short positions was not a good idea.
To clarify, there were two short-term consolidations soon after the breakdown in 2013. One of them took the HUI about 4% higher (in February 2013) and then we saw a decline. Afterwards, about 7%-8% correction (in March 2013) followed and then the biggest part of the decline took place.
Consequently, we might see a consolidation in gold stocks quite soon, but I wouldn’t expect it to be anything to write home about. At the current price levels, 4% – 8% means a decline of about 9 – 19 index. In the case of the GDXJ (if it moved in tune with the HUI), it would imply a move up by $1.5 - $3.
Of course, this is a hypothetical discussion of what might happen when gold stocks correct, but it doesn’t imply that they are likely to correct now. Actually, the opposite seems likely because of the HUI’s breakdown and the USD’s breakout. Again, forecasting gold stocks at higher levels in the near term might be a dangerous thing to do.
So, to clarify, the above-mentioned corrective upswing is likely to take place after another short-term move lower. If the GDXJ bottoms at about $35, then seeing it correct to about $36.5 - $38 will be quite normal.
As far as the short-term price moves in the mining stocks are concerned, my previous comments remain up-to-date. Yesterday, I wrote the following about the GDX ETF:
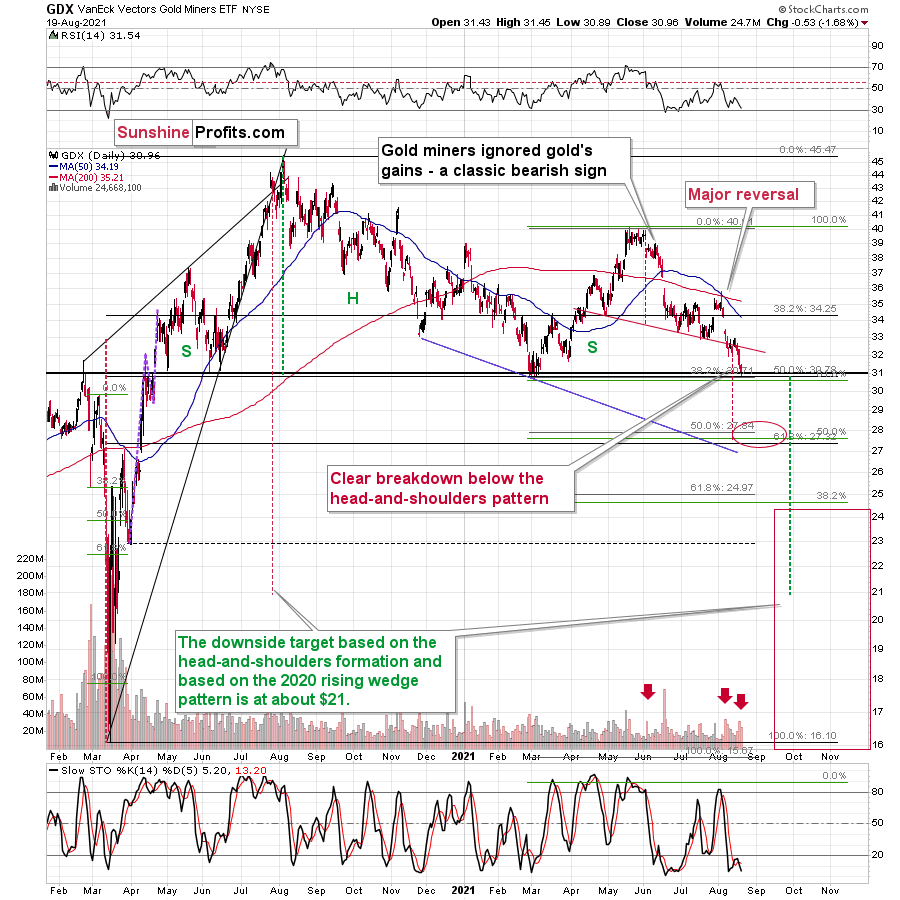
What happened? Senior gold miners finally broke decisively below the neck level of their head-and-shoulders formation, while juniors’ freefall continued.
Yesterday, senior miners closed below the neck level of the pattern for the second day, which means that the breakdown is almost confirmed.
The GDX has encountered strong support provided by the previous 2021 lows, but it doesn’t mean that we have to see a rebound here. Why? Because other proxies for mining stocks are already after the breakdown. This is the case with the GDXJ ETF, the HUI Index, and also the XAU Index. Even silver stocks – the SIL ETF –closed below the previous 2021 lows for the second day in a row.
So, did mining stocks encounter strong support here? Not really, only one of the proxies did – the GDX ETF. The remaining ones are already after a breakdown to new 2021 lows, and if we get a weekly close below them as well, the breakdown will be confirmed.
Thank you for reading our free analysis today. Please note that the above is just a small fraction of the full analyses that our subscribers enjoy on a regular basis. They include multiple premium details such as the interim targets for gold and mining stocks that could be reached in the next few weeks. We invite you to subscribe now and read today’s issue right away.
Sincerely,
Przemyslaw Radomski, CFA
Founder, Editor-in-chief -
Fed: Rocking the Financial Boat
August 19, 2021, 7:24 AMWhile I’ve been warning for months that the U.S. Federal Reserve (FED) will likely taper its asset purchases much sooner than investors expect, enlightenment struck the financial markets on Aug. 18.
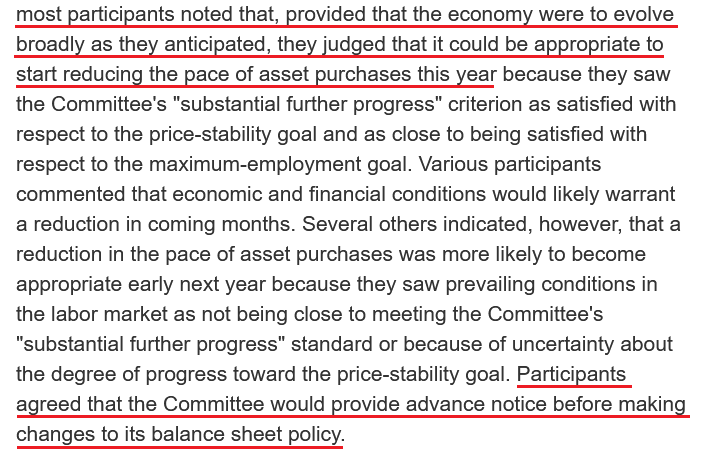
To explain, with the FED releasing the minutes from its July 27/28 policy meeting, “most participants judged that the Committee's standard of ‘substantial further progress’ toward the maximum-employment goal had not yet been met. At the same time, most participants remarked that this standard had been achieved with respect to the price-stability goal.” For context, this means that FED officials are now acknowledging surging inflation…
“The staff's near-term outlook for inflation was revised up further in response to incoming data, but the staff continued to expect that this year's rise in inflation would prove to be transitory.”
More importantly, though:
 Source: U.S. FED
As a result, with the phrase “most participants” indicating a hawkish majority, the idea that “the Committee would provide advance notice before making changes to its balance sheet policy” also means that the taper timeline remains on schedule. For example, while the Delta variant has the potential to delay the fireworks, our projection of a taper announcement at the FED’s September 21/22 policy meeting (or even during the Jackson Hole Symposium) still looks quite prescient. When you combine “it could be appropriate to start reducing the pace of asset purchases this year” with the promise of “advance notice,” it means that an announcement will have to commence in September or October for an official slowing of the FED’s bond-buying program to begin in December. As a result, the PMs’ medium-term outlook remains quite treacherous.
What’s more, the FED’s report also highlighted several financial stability risks. And with tightening financial conditions the only prescription for the ailment, the stars are likely aligning:
“The staff judged that asset valuation pressures were elevated. In particular, the forward price-to-earnings ratio for the S&P 500 index stood at the upper end of its historical distribution; high-yield corporate bond spreads tightened further and were near the low end of their historical range; and house prices continued to increase rapidly, leaving valuation measures stretched.”
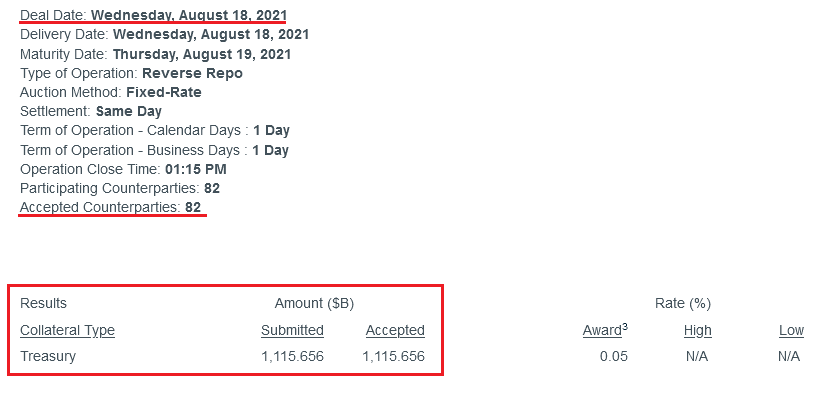
Furthermore, amidst the FED-induced chaos on Aug. 18, the central bank’s daily reverse repurchase agreements also hit another all-time high. And with 82 counterparties siphoning nearly $1.116 trillion out of the financial system, the liquidity drain continues to accelerate.
 Source: New York FED
To explain, a reverse repurchase agreement (repo) occurs when an institution offloads cash to the FED in exchange for a Treasury security (on an overnight or short-term basis). And with U.S. financial institutions currently flooded with excess liquidity, they’re shipping cash to the FED at an alarming rate. And while I’ve been warning for months that the activity is the fundamental equivalent of a taper – due to the reduced supply of U.S. dollars (which is bullish for the USD Index) – the psychological effect pales in comparison. However, with the chorus growing louder, an official taper announcement will likely occur sooner rather than later.
In addition, while I’ve been sounding the alarm on inflation as well, the “transitory” narrative is losing clout with economists. Case in point: while ‘peak’ and ‘slowing’ inflation have dominated the news cycle, economists’ consensus estimates remain on the up and up.
Please see below:
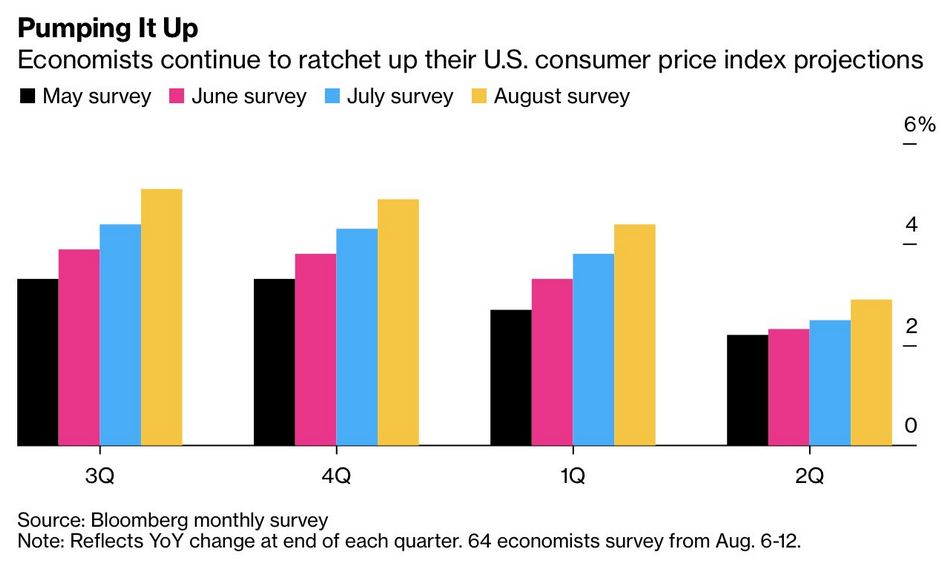
To explain, the various bars above depicts economists’ consensus estimates for the year-over-year (YoY) percentage change in the core Consumer Price Index (CPI) over the next four quarters. And not only is there a clear uptrend, but economists once again increased their estimates in August (the gold bars).
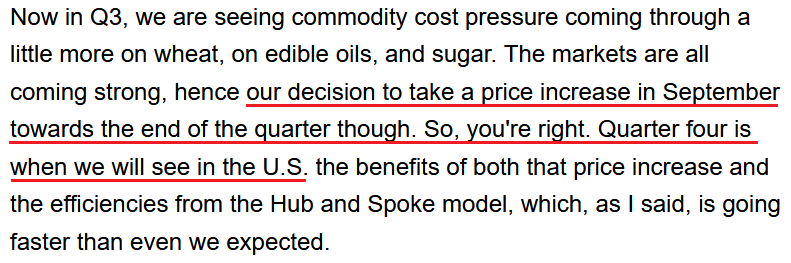
And for good reason: Krispy Kreme – an American doughnut company and coffeehouse chain – revealed during its second-quarter earnings call on Aug. 17 that “Q3, which is typically a seasonally softer quarter, is expected to see increased pressure from wage and commodities inflation, especially in the U.S.” Moreover, CEO Michael Tattersfield added that “I must admit, the commodity pressure in the short-term has just been quite extraordinary.”
On top of that, with enhanced employment benefits putting upward pressure on wages, he said:
“A temporary increase in training costs and associated overtime plus increase wage inflation pressures are impacting short-term margin growth…. We are seeing wage inflation typical that you're seeing across the industry, and actually in line with our expectations.”
And how is the company responding to the inflationary pressures?
 Source: Krispy Kreme/Seeking Alpha
Likewise, data from Nordea implies that wage growth still has room to run. For context, with the U.S. Employment Cost Index (ECI) rising by more than 3% YoY in Q2, wage inflation is now at its highest level since 2008.
Please see below:
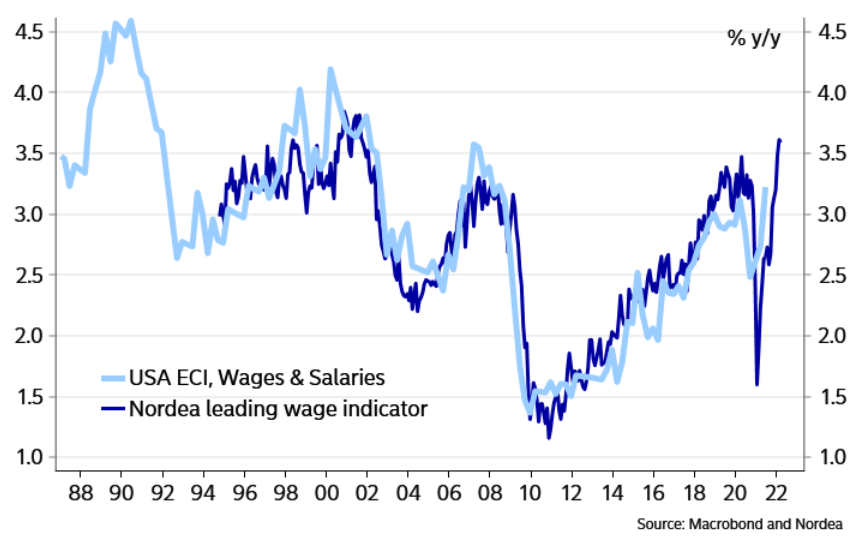
To explain, the light blue line above tracks the YoY percentage change in the U.S. ECI, while the dark blue line above tracks the YoY percentage change in Nordea’s wage model. And with the small, but meaningful, gap on the right side of the chart implying another YoY rise in Q3, Krispy Kreme isn’t the only company experiencing wage inflation.
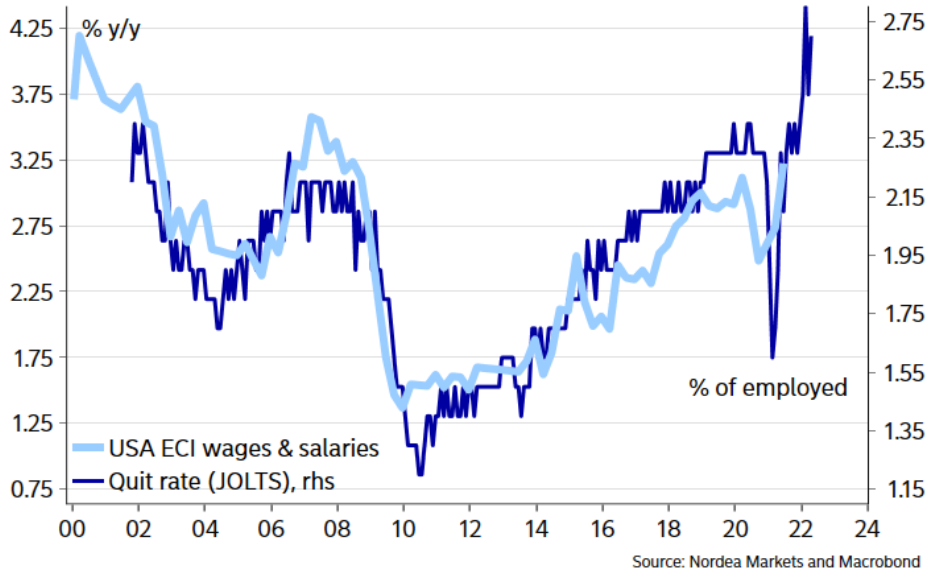
To that point, Nordea also compared the YoY ECI metric to the U.S. Bureau of Labor Statistics’ (BLS) quit rate. And with that, the potential for wage inflation is even more striking.
Please see below:
Rent Inflation Lag
In addition, while I’ve been warning for months about the forthcoming tsunami, the U.S. government’s measure of rent inflation is still extremely subdued.
Please see below:
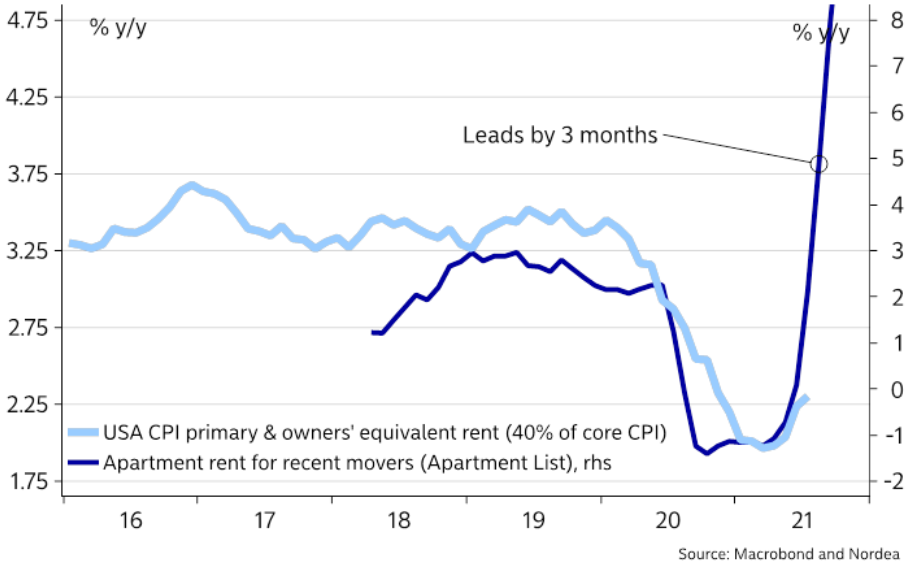
To explain, the light blue line above tracks the YoY percentage change in the Owners’ Equivalent Rent CPI (U.S. government data), while the dark blue line above tracks the YoY percentage change in rents tracked by Apartment List. And because rents account for more than 30% of the movement of the headline CPI and more than 40% of the movement of the core CPI, the light blue line’s lag is quite material.
For context, I wrote previously:
Apartment List – an online marketplace for apartment listings – released its National Rent Report on Jul. 26. An excerpt read:
“The first half of 2021 has seen the fastest growth in rent prices since the start of our estimates in 2017. Our national rent index has increased by 11.4 percent since January. Prices are up by 10.3 percent compared to this time last year and up 9.4 percent compared to the pre-pandemic level from March 2020. The recent spike has now put actual rents well ahead of the trend they were on prior to the pandemic. The national median rent currently stands at $1,244, which is $44 greater than where we project it would be if rent growth over the past year and a half had been in line with the growth rates we saw in 2018 and 2019.”
Finally, with “substantial further progress” hinging on the FED reaching its full-employment mandate, U.S. nonfarm payrolls are the canary in the coal mine. And while the Delta variant may have affected hiring growth in August (?), the employment tailwinds remain:
- Enhanced unemployment benefits are scheduled to expire in September
- There are actually 589 more job openings in the U.S. than citizens unemployed
Please see below:
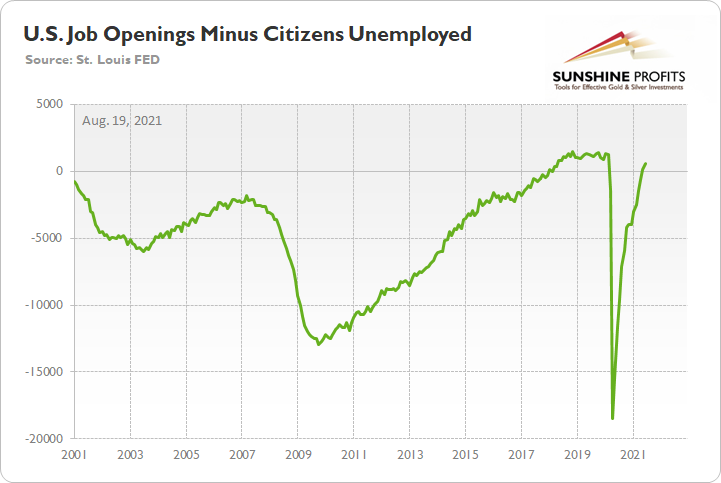
To explain, the green line above subtracts the number of unemployed U.S. citizens from the number of U.S. job openings. If you analyze the right side of the chart, you can see that the epic collapse has completely reversed, and the green line is now in positive territory. Thus, with more jobs available than people looking for work, it’s only a matter of time before “substantial further progress” materializes.
In conclusion, volatility rocked the financial markets again on Aug. 18, as the FED’s minutes struck a negative chord with investors. And with gold mining stocks caught up in the plunge, their continued underperformance of gold remains profoundly bearish. What’s more, while the USD Index remained surprisingly subdued, the U.S. 2-through-10 year yields rallied once again. As a result, the PMs’ medium-term outlook is growing colder by the day.
Thank you for reading our free analysis today. Please note that the above is just a small fraction of the full analyses that our subscribers enjoy on a regular basis. They include multiple premium details such as the interim targets for gold and mining stocks that could be reached in the next few weeks. We invite you to subscribe now and read today’s issue right away.
Sincerely,
Przemyslaw Radomski, CFA
Founder, Editor-in-chief


Gold Investment News
Delivered To Your Inbox
Free Of Charge
Bonus: A week of free access to Gold & Silver StockPickers.
Gold Alerts
More-
Status
New 2024 Lows in Miners, New Highs in The USD Index
January 17, 2024, 12:19 PM -
Status
Soaring USD is SO Unsurprising – And SO Full of Implications
January 16, 2024, 8:40 AM -
Status
Rare Opportunity in Rare Earth Minerals?
January 15, 2024, 2:06 PM

