

Briefly: in our opinion, full (300% of the regular position size) speculative short positions in mining stocks are justified from the risk/reward point of view at the moment of publishing this Alert. I’m moving the profit-take levels lower.
New Normal
The “new normal” in the precious metals sector continues. Mining stocks are ridiculously weak, and based on how weak they were yesterday, I’m moving our profit-take levels for our short position in the junior mining stocks even lower. So, yes, the profit potential in the short term is even bigger than I thought previously.
What happened? Senior gold miners finally broke decisively below the neck level of their head-and-shoulders formation, while juniors’ freefall continued.
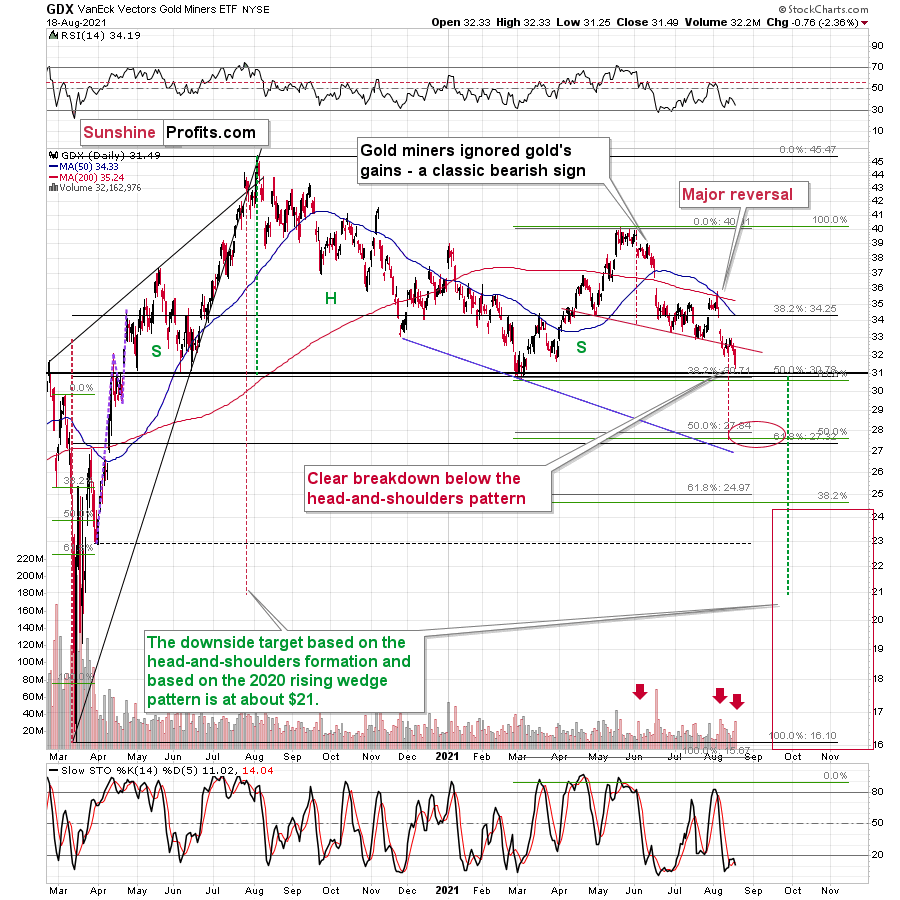
The breakdown makes the slide to ~$28 very likely.
The volume that accompanied yesterday’s decline was significant, and the last two times when we saw volume of similar magnitude even more weakness followed. It seems that it’s only a matter of little time (several days, not several weeks) before the GDX breaks down to new 2021 lows.
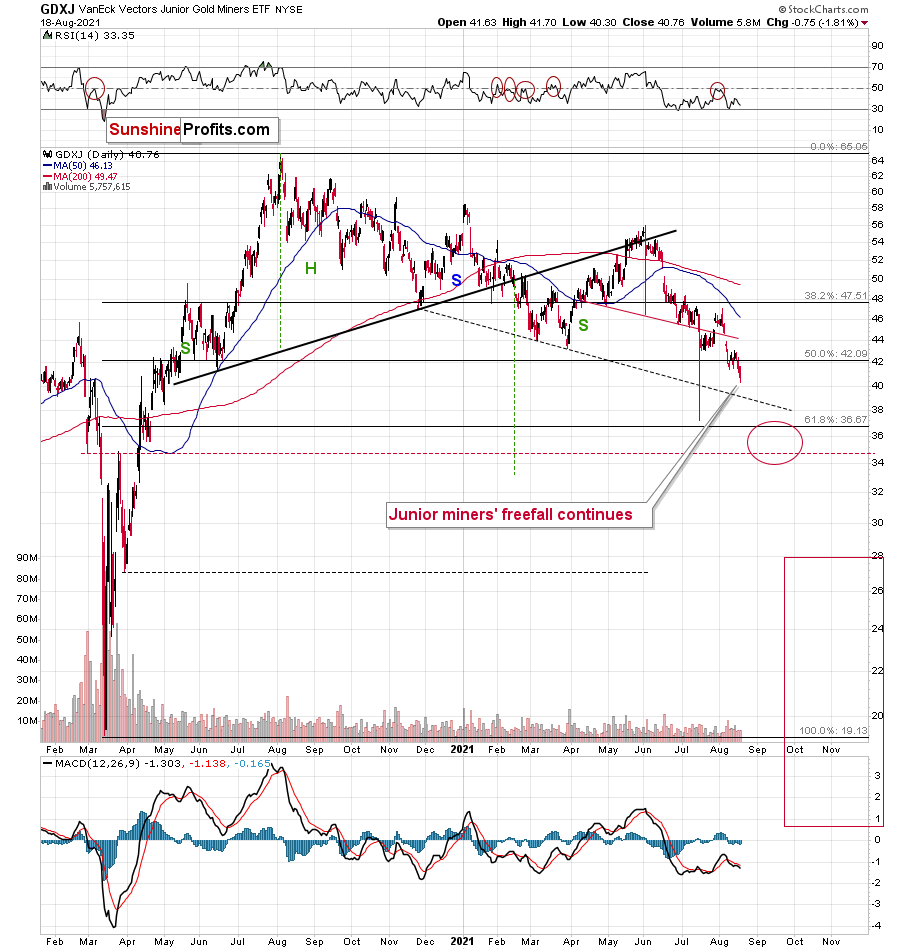
The GDXJ proxy for junior miners moved lower once again – just as it was likely to do based on, i.a., the short-term flag (consolidation) pattern.
Now, based on the previously completed head-and-shoulders pattern, the downside target is at about $37. However, since this level is now relatively close (while the GDX has still some more to decline to reach its short-term downside target), it seems justified to expect the GDXJ to decline more than the head-and-shoulders pattern suggests. Besides, the H&S targets work on a “minimum” basis.
If you look at the ratio between both ETFs, you’ll see that unless something major changes, juniors are likely to continue to underperform seniors.
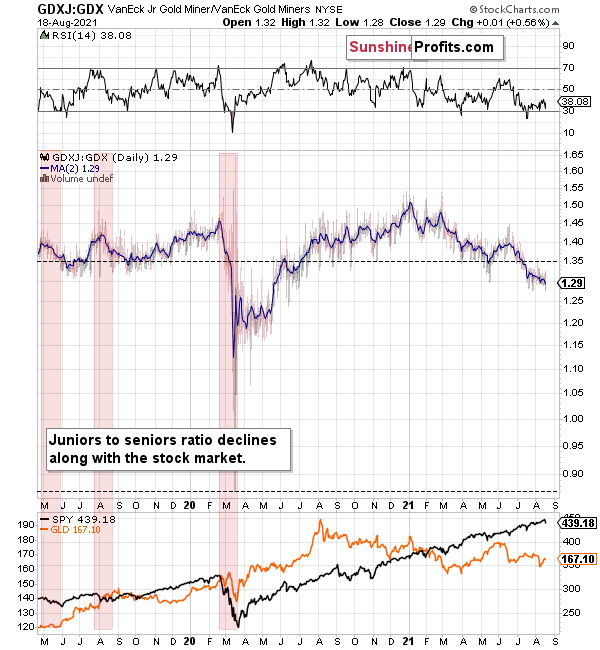
The trend in the ratio this year has been clearly down, and there’s no sign of a reversal, especially that the ratio broke below its 2019 support (which served as resistance in mid-2020). When the same thing happened in 2020, the ratio then spiked even below 1.
So, if the ratio is likely to continue its decline, then on a short-term basis we can expect it to decline to 1.27 or so. If the general stock market plunges, the ratio could move even lower, but let’s assume that stocks decline moderately (just as they did in the last couple of days) or that they do nothing or rally slightly. They’ve done all the above recently, so it’s natural to expect that this will be the case. Consequently, the trend in the GDXJ to GDX ratio would also be likely to continue, and thus expecting a move to about 1.26 - 1.27 seems rational.
If the GDX is about to decline to approximately $28 before correcting, then we might expect the GDXJ to decline to about $28 x 1.27 = $35.56 or $28 x 1.26 = $35.28. In other words, $28 in the GDX is likely to correspond to about $35 in the GDXJ.
Is there any technical support around $35 that would be likely to stop the decline? Yes. It’s provided by the late-Feb. 2020 low ($34.70) and the late-March high ($34.84). There’s also the late-April low at $35.63. Conservatively, I’m going to place the profit-take level just above the latter.
Consequently, it seems that expecting the GDXJ to decline to about $35 is justified from the technical point of view as well.
Let’s move to gold.
The Yellow Metal
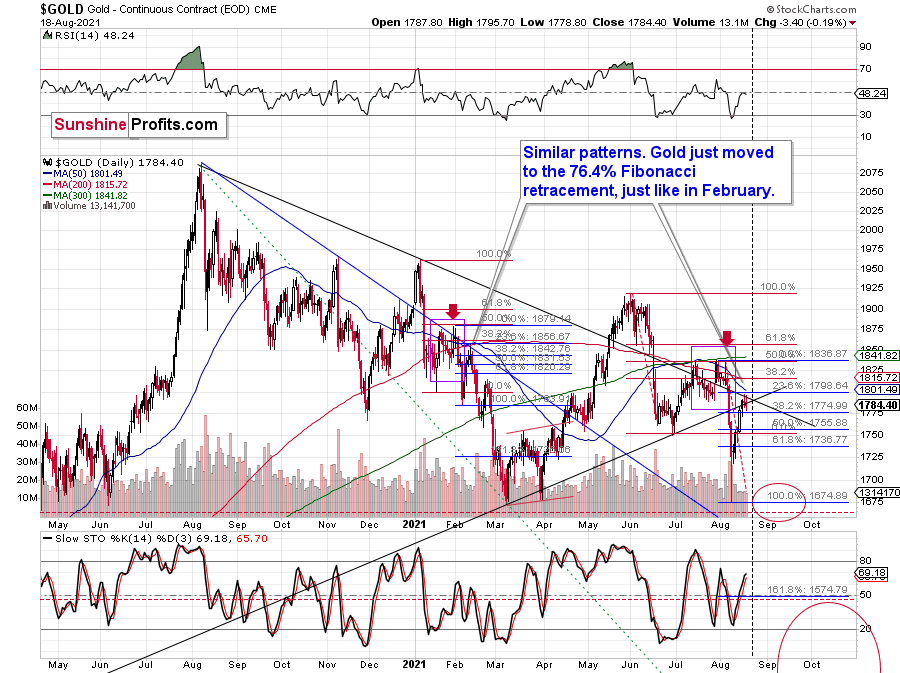
Gold didn’t do much yesterday – it declined by only $3.40, which makes the declines in the mining stocks even more bearish, as it was yet another day when they were exceptionally weak.
Why didn’t gold decline more? Probably because of technical reasons. It seems that gold is waiting for the triangle-vertex-based reversal that’s due on Monday. Gold doesn’t have to be 100% precise in this timing, but the existence of this reversal is enough for one to understand that gold’s reluctance to decline is not really a sign of strength, but something that can be easily explained otherwise.
This is an important observation, as one might also think that gold’s lack of substantial declines despite rallies in the USDX is bullish for the PMs. It isn’t.
And speaking of the USD Index, let’s take a look at what’s happening in it.
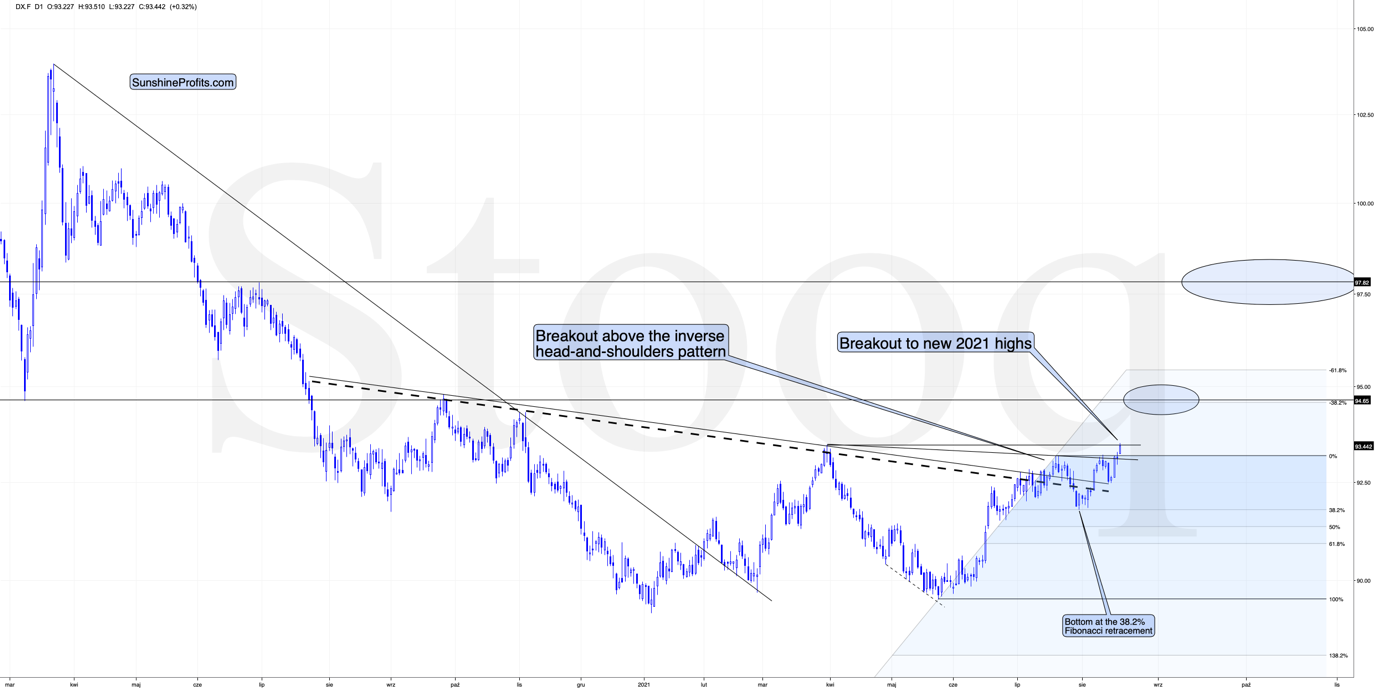
The USDX just broke to new 2021 highs!
That’s yet another attempt to rally above 93, and it seems that this time the move will be sustained. Why? Because the situation is already different. There was only one other time in 2021 when the USDX managed to close above the 93 level for two days in a row. That was in late March, and it was immediately followed by lower USDX prices on the following day (Apr. 1). This time, we saw a daily rally – one that took the U.S. currency to new intraday highs.
The implications are bullish for the USD Index and very bearish for the precious metals sector.
Having said that, let’s take a look at the markets from a more fundamental angle.
Acknowledging Reality
While I’ve been warning for months that the U.S. Federal Reserve (FED) will likely taper its asset purchases much sooner than investors expect, enlightenment struck the financial markets on Aug. 18. To explain, with the FED releasing the minutes from its July 27/28 policy meeting, “most participants judged that the Committee's standard of ‘substantial further progress’ toward the maximum-employment goal had not yet been met. At the same time, most participants remarked that this standard had been achieved with respect to the price-stability goal.” For context, this means that FED officials are now acknowledging surging inflation…
“The staff's near-term outlook for inflation was revised up further in response to incoming data, but the staff continued to expect that this year's rise in inflation would prove to be transitory.”
More importantly, though:
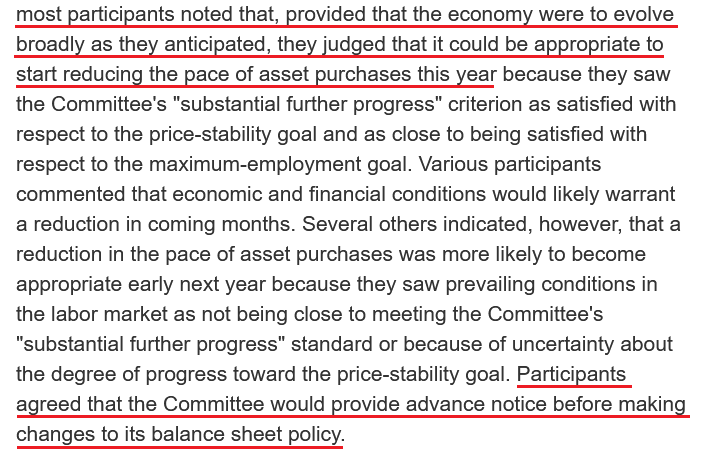 Source: U.S. FED
As a result, with the phrase “most participants” indicating a hawkish majority, the idea that “the Committee would provide advance notice before making changes to its balance sheet policy” also means that the taper timeline remains on schedule. For example, while the Delta variant has the potential to delay the fireworks, our projection of a taper announcement at the FED’s September 21/22 policy meeting (or even during the Jackson Hole Symposium) still looks quite prescient. When you combine “it could be appropriate to start reducing the pace of asset purchases this year” with the promise of “advance notice,” it means that an announcement will have to commence in September or October for an official slowing of the FED’s bond-buying program to begin in December. As a result, the PMs’ medium-term outlook remains quite treacherous.
What’s more, the FED’s report also highlighted several financial stability risks. And with tightening financial conditions the only prescription for the ailment, the stars are likely aligning:
“The staff judged that asset valuation pressures were elevated. In particular, the forward price-to-earnings ratio for the S&P 500 index stood at the upper end of its historical distribution; high-yield corporate bond spreads tightened further and were near the low end of their historical range; and house prices continued to increase rapidly, leaving valuation measures stretched.”
Furthermore, amidst the FED-induced chaos on Aug. 18, the central bank’s daily reverse repurchase agreements also hit another all-time high. And with 82 counterparties siphoning nearly $1.116 trillion out of the financial system, the liquidity drain continues to accelerate.
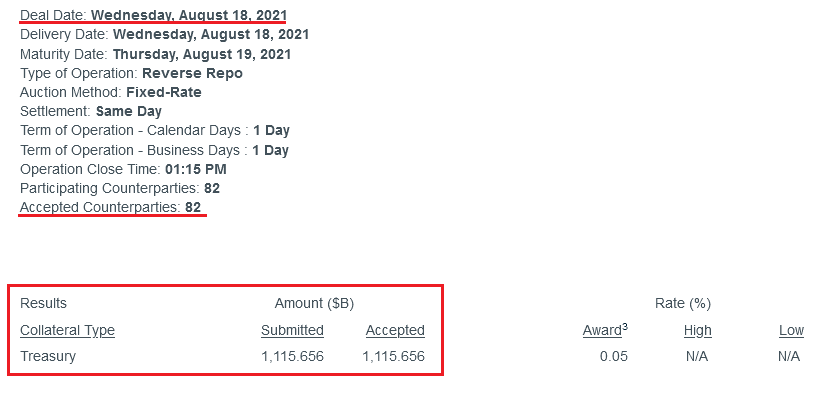 Source: New York FED
To explain, a reverse repurchase agreement (repo) occurs when an institution offloads cash to the FED in exchange for a Treasury security (on an overnight or short-term basis). And with U.S. financial institutions currently flooded with excess liquidity, they’re shipping cash to the FED at an alarming rate. And while I’ve been warning for months that the activity is the fundamental equivalent of a taper – due to the reduced supply of U.S. dollars (which is bullish for the USD Index) – the psychological effect pales in comparison. However, with the chorus growing louder, an official taper announcement will likely occur sooner rather than later.
In addition, while I’ve been sounding the alarm on inflation as well, the “transitory” narrative is losing clout with economists. Case in point: while ‘peak’ and ‘slowing’ inflation have dominated the news cycle, economists’ consensus estimates remain on the up and up.
Please see below:
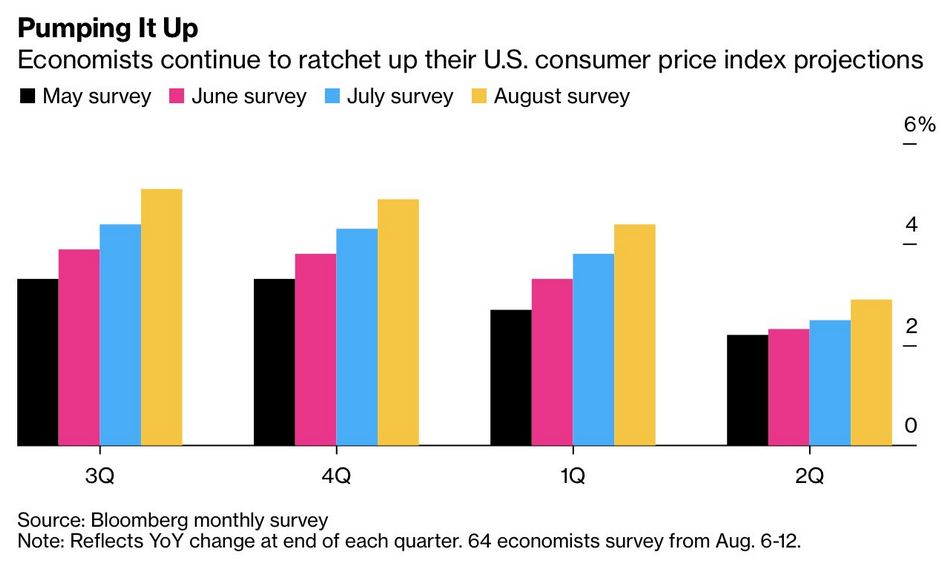
To explain, the various bars above depicts economists’ consensus estimates for the year-over-year (YoY) percentage change in the core Consumer Price Index (CPI) over the next four quarters. And not only is there a clear uptrend, but economists once again increased their estimates in August (the gold bars).
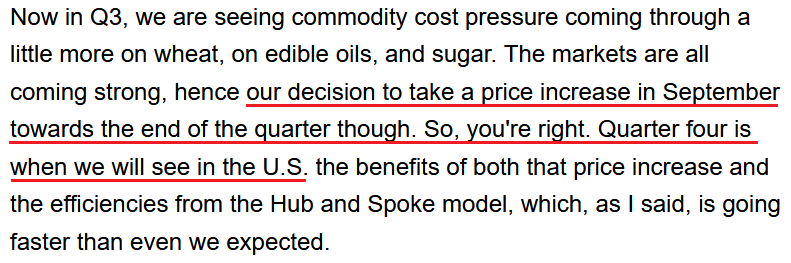
And for good reason: Krispy Kreme – an American doughnut company and coffeehouse chain – revealed during its second-quarter earnings call on Aug. 17 that “Q3, which is typically a seasonally softer quarter, is expected to see increased pressure from wage and commodities inflation, especially in the U.S.” Moreover, CEO Michael Tattersfield added that “I must admit, the commodity pressure in the short-term has just been quite extraordinary.”
On top of that, with enhanced employment benefits putting upward pressure on wages, he said:
“A temporary increase in training costs and associated overtime plus increase wage inflation pressures are impacting short-term margin growth…. We are seeing wage inflation typical that you're seeing across the industry, and actually in line with our expectations.”
And how is the company responding to the inflationary pressures?
 Source: Krispy Kreme/Seeking Alpha
Likewise, data from Nordea implies that wage growth still has room to run. For context, with the U.S. Employment Cost Index (ECI) rising by more than 3% YoY in Q2, wage inflation is now at its highest level since 2008.
Please see below:
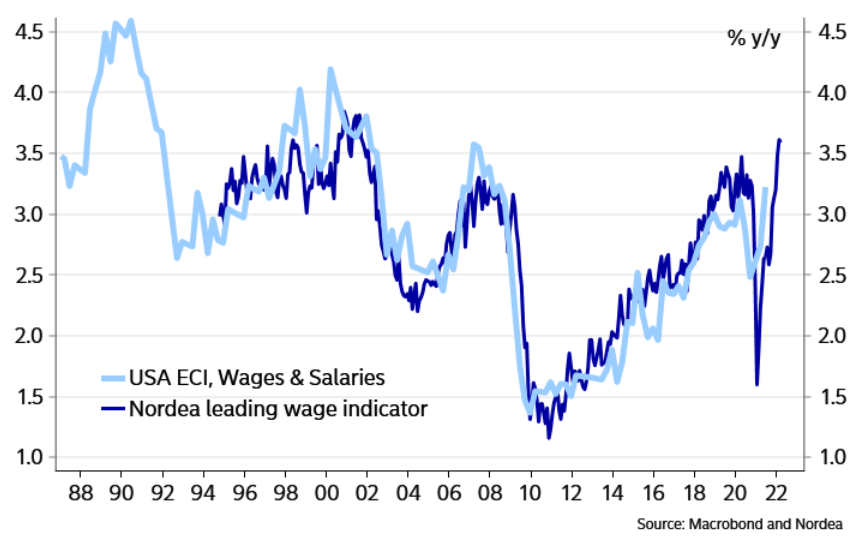
To explain, the light blue line above tracks the YoY percentage change in the U.S. ECI, while the dark blue line above tracks the YoY percentage change in Nordea’s wage model. And with the small, but meaningful, gap on the right side of the chart implying another YoY rise in Q3, Krispy Kreme isn’t the only company experiencing wage inflation.
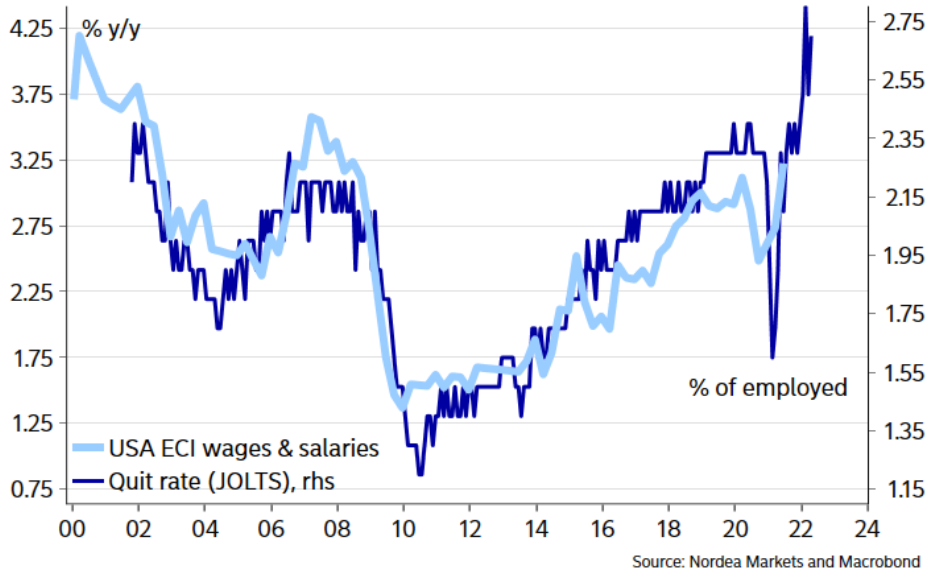
To that point, Nordea also compared the YoY ECI metric to the U.S. Bureau of Labor Statistics’ (BLS) quit rate. And with that, the potential for wage inflation is even more striking.
Please see below:
Rent Inflation Lag
In addition, while I’ve been warning for months about the forthcoming tsunami, the U.S. government’s measure of rent inflation is still extremely subdued.
Please see below:
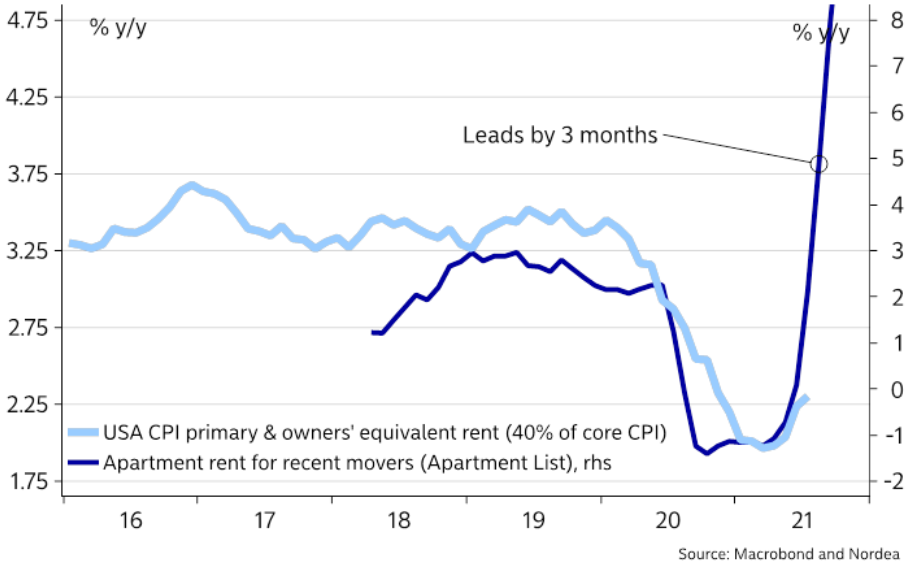
To explain, the light blue line above tracks the YoY percentage change in the Owners’ Equivalent Rent CPI (U.S. government data), while the dark blue line above tracks the YoY percentage change in rents tracked by Apartment List. And because rents account for more than 30% of the movement of the headline CPI and more than 40% of the movement of the core CPI, the light blue line’s lag is quite material.
For context, I wrote previously:
Apartment List – an online marketplace for apartment listings – released its National Rent Report on Jul. 26. An excerpt read:
“The first half of 2021 has seen the fastest growth in rent prices since the start of our estimates in 2017. Our national rent index has increased by 11.4 percent since January. Prices are up by 10.3 percent compared to this time last year and up 9.4 percent compared to the pre-pandemic level from March 2020. The recent spike has now put actual rents well ahead of the trend they were on prior to the pandemic. The national median rent currently stands at $1,244, which is $44 greater than where we project it would be if rent growth over the past year and a half had been in line with the growth rates we saw in 2018 and 2019.”
Finally, with “substantial further progress” hinging on the FED reaching its full-employment mandate, U.S. nonfarm payrolls are the canary in the coal mine. And while the Delta variant may have affected hiring growth in August (?), the employment tailwinds remain:
- Enhanced unemployment benefits are scheduled to expire in September
- There are actually 589 more job openings in the U.S. than citizens unemployed
Please see below:
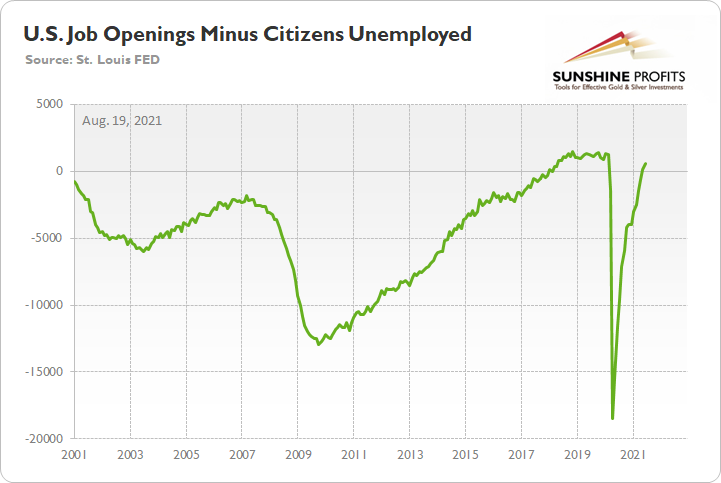
To explain, the green line above subtracts the number of unemployed U.S. citizens from the number of U.S. job openings. If you analyze the right side of the chart, you can see that the epic collapse has completely reversed, and the green line is now in positive territory. Thus, with more jobs available than people looking for work, it’s only a matter of time before “substantial further progress” materializes.
In conclusion, volatility rocked the financial markets again on Aug. 18, as the FED’s minutes struck a negative chord with investors. And with gold mining stocks caught up in the plunge, their continued underperformance of gold remains profoundly bearish. What’s more, while the USD Index remained surprisingly subdued, the U.S. 2-through-10 year yields rallied once again. As a result, the PMs’ medium-term outlook is growing colder by the day.
Overview of the Upcoming Part of the Decline
- The corrective upswing in gold is over, and the big decline seems to be already underway.
- After miners slide in a meaningful and volatile way, but silver doesn’t (and it just declines moderately), I plan to switch from short positions in miners to short positions in silver. At this time, it’s too early to say at what price levels this would take place – perhaps with gold close to $1,600. I plan to exit those short positions when gold shows substantial strength relative to the USD Index, while the latter is still rallying. This might take place with gold close to $1,350 - $1,500 and the entire decline (from above $1,900 to about $1,475) would be likely to take place within 6-20 weeks, and I would expect silver to fall the hardest in the final part of the move. This moment (when gold performs very strongly against the rallying USD and miners are strong relative to gold – after gold has already declined substantially) is likely to be the best entry point for long-term investments, in my view. This might also happen with gold close to $1,475, but it’s too early to say with certainty at this time.
- As a confirmation for the above, I will use the (upcoming or perhaps we have already seen it?) top in the general stock market as the starting point for the three-month countdown. The reason is that after the 1929 top, gold miners declined for about three months after the general stock market started to slide. We also saw some confirmations of this theory based on the analogy to 2008. All in all, the precious metals sector would be likely to bottom about three months after the general stock market tops.
- The above is based on the information available today, and it might change in the following days/weeks.
Please note that the above timing details are relatively broad and “for general overview only” – so that you know more or less what I think and how volatile I think the moves are likely to be – on an approximate basis. These time targets are not binding or clear enough for me to think that they should be used for purchasing options, warrants or similar instruments.
Leverage ETF Target Calculations
Almost every time I adjust the targets for the ETFs and the leveraged ones, I then receive questions about how I calculated the latter, so I’m going to provide this information in advance below:
Yesterday’s close of the GDXJ was $40.76.
The target price for the GDXJ is $35.73
I’m estimating that it would take about 20 trading days for the target to be reached*
If this is the case, then the GDXJ would have to decline by 0.6564% each day (on average).
Let’s check: $40.76 x (1 – 0.006564)^20 = ~$35.73
Now, the JDST provides 2x leverage of the DAILY price moves of the GDXJ.
Consequently, if the GDXJ is going to decline by 0.6564% each day, then the JDST should theoretically move up by 2 x 0.6564% = 1.3128%
Yesterday’s closing price for the JDST was $13.15.
If it’s about to rally by 1.3128% for 20 days, then it’s likely to rally to $13.15 x (1 + 0.013128)^20 = ~$17.07
I’m putting the profit-take for the JDST slightly below the nearest round number, just in case it acts as resistance. So, the final profit-take level is $16.96.
I’m also applying a similar procedure to the GDXD. In the case of the latter, the profit-take was lowered, as the volatility-based decay ate some of the profits in the meantime (that’s one of the reasons it’s not suggested for most investors/traders). I’m also re-calculating the value for the HGD.TO (the target was also lowered – HGD.TO is underperforming the JDST and DUST).
Summary
To summarize, the corrective upswing in gold is over, and it seems that the big downswing in gold, silver, and mining stocks is already underway. I previously warned you that “the next few days may (!) bring some back-and-forth action instead of the decline’s continuation,” and I also wrote that it was unlikely that this would take place for long. It seems that it is exactly what happened – we saw some back and forth action, and while gold’s last week’s performance might seem bullish at first glance, neither gold’s volume, nor action in silver nor mining stocks confirm it. In fact, silver’s and junior miners’ breakdowns to new yearly lows were confirmed.
Based on the self-similar pattern in gold (similarity is mostly to the 2011-2013 period), gold is likely to decline to its previous 2021 lows relatively soon, even if it doesn’t happen right away. Based on the analogies to the recent past, it seems quite likely that gold will move lower in the following days and bottom in the second half of August.
It seems that our profits from the short position in the junior mining stocks are going to grow substantially in the following weeks.
Moreover, I’m moving the profit-take levels for our short position in the junior miners lower, as it seems that miners will decline more in the short run than it seemed likely previously.
After the sell-off (that takes gold to about $1,350 - $1,500), I expect the precious metals to rally significantly. The final part of the decline might take as little as 1-5 weeks, so it's important to stay alert to any changes.
Most importantly, please stay healthy and safe. We made a lot of money last March and this March, and it seems that we’re about to make much more on the upcoming decline, but you have to be healthy to enjoy the results.
As always, we'll keep you - our subscribers - informed.
By the way, we’re currently providing you with the possibility to extend your subscription by a year, two years or even three years with a special 20% discount. This discount can be applied right away, without the need to wait for your next renewal – if you choose to secure your premium access and complete the payment upfront. The boring time in the PMs is definitely over, and the time to pay close attention to the market is here. Naturally, it’s your capital, and the choice is up to you, but it seems that it might be a good idea to secure more premium access now while saving 20% at the same time. Our support team will be happy to assist you in the above-described upgrade at preferential terms – if you’d like to proceed, please contact us.
To summarize:
Trading capital (supplementary part of the portfolio; our opinion): Full speculative short positions (300% of the full position) in mining stocks are justified from the risk to reward point of view with the following binding exit profit-take price levels:
Mining stocks (price levels for the GDXJ ETF): binding profit-take exit price: $35.73; stop-loss: none (the volatility is too big to justify a stop-loss order in case of this particular trade)
Alternatively, if one seeks leverage, we’re providing the binding profit-take levels for the JDST (2x leveraged) and GDXD (3x leveraged – which is not suggested for most traders/investors due to the significant leverage). The binding profit-take level for the JDST: $16.96; stop-loss for the JDST: none (the volatility is too big to justify a SL order in case of this particular trade); binding profit-take level for the GDXD: $35.46; stop-loss for the GDXD: none (the volatility is too big to justify a SL order in case of this particular trade).
For-your-information targets (our opinion; we continue to think that mining stocks are the preferred way of taking advantage of the upcoming price move, but if for whatever reason one wants / has to use silver or gold for this trade, we are providing the details anyway.):
Silver futures upside profit-take exit price: unclear at this time - initially, it might be a good idea to exit, when gold moves to $1,683
Gold futures upside profit-take exit price: $1,683
HGD.TO – alternative (Canadian) inverse 2x leveraged gold stocks ETF – the upside profit-take exit price: $11.38
Long-term capital (core part of the portfolio; our opinion): No positions (in other words: cash
Insurance capital (core part of the portfolio; our opinion): Full position
Whether you already subscribed or not, we encourage you to find out how to make the most of our alerts and read our replies to the most common alert-and-gold-trading-related-questions.
Please note that we describe the situation for the day that the alert is posted in the trading section. In other words, if we are writing about a speculative position, it means that it is up-to-date on the day it was posted. We are also featuring the initial target prices to decide whether keeping a position on a given day is in tune with your approach (some moves are too small for medium-term traders, and some might appear too big for day-traders).
Additionally, you might want to read why our stop-loss orders are usually relatively far from the current price.
Please note that a full position doesn't mean using all of the capital for a given trade. You will find details on our thoughts on gold portfolio structuring in the Key Insights section on our website.
As a reminder - "initial target price" means exactly that - an "initial" one. It's not a price level at which we suggest closing positions. If this becomes the case (like it did in the previous trade), we will refer to these levels as levels of exit orders (exactly as we've done previously). Stop-loss levels, however, are naturally not "initial", but something that, in our opinion, might be entered as an order.
Since it is impossible to synchronize target prices and stop-loss levels for all the ETFs and ETNs with the main markets that we provide these levels for (gold, silver and mining stocks - the GDX ETF), the stop-loss levels and target prices for other ETNs and ETF (among other: UGL, GLL, AGQ, ZSL, NUGT, DUST, JNUG, JDST) are provided as supplementary, and not as "final". This means that if a stop-loss or a target level is reached for any of the "additional instruments" (GLL for instance), but not for the "main instrument" (gold in this case), we will view positions in both gold and GLL as still open and the stop-loss for GLL would have to be moved lower. On the other hand, if gold moves to a stop-loss level but GLL doesn't, then we will view both positions (in gold and GLL) as closed. In other words, since it's not possible to be 100% certain that each related instrument moves to a given level when the underlying instrument does, we can't provide levels that would be binding. The levels that we do provide are our best estimate of the levels that will correspond to the levels in the underlying assets, but it will be the underlying assets that one will need to focus on regarding the signs pointing to closing a given position or keeping it open. We might adjust the levels in the "additional instruments" without adjusting the levels in the "main instruments", which will simply mean that we have improved our estimation of these levels, not that we changed our outlook on the markets. We are already working on a tool that would update these levels daily for the most popular ETFs, ETNs and individual mining stocks.
Our preferred ways to invest in and to trade gold along with the reasoning can be found in the how to buy gold section. Furthermore, our preferred ETFs and ETNs can be found in our Gold & Silver ETF Ranking.
As a reminder, Gold & Silver Trading Alerts are posted before or on each trading day (we usually post them before the opening bell, but we don't promise doing that each day). If there's anything urgent, we will send you an additional small alert before posting the main one.
Thank you.
Przemyslaw Radomski, CFA
Founder, Editor-in-chief

