

Briefly: in our opinion, full (300% of the regular position size) speculative short positions in mining stocks are justified from the risk/reward point of view at the moment of publishing this Alert.
The HUI Index (gold stocks) broke to new 2021 lows while the USD Index broke to new 2021 highs. Just as I’ve been warning you.
Mining stocks’ extreme weakness relative to gold continued yesterday, and while it may seem like the weakness has to have a limit, this limit is likely still quite far from the markets right now.
Let’s take a look at the long-term HUI Index chart for details.
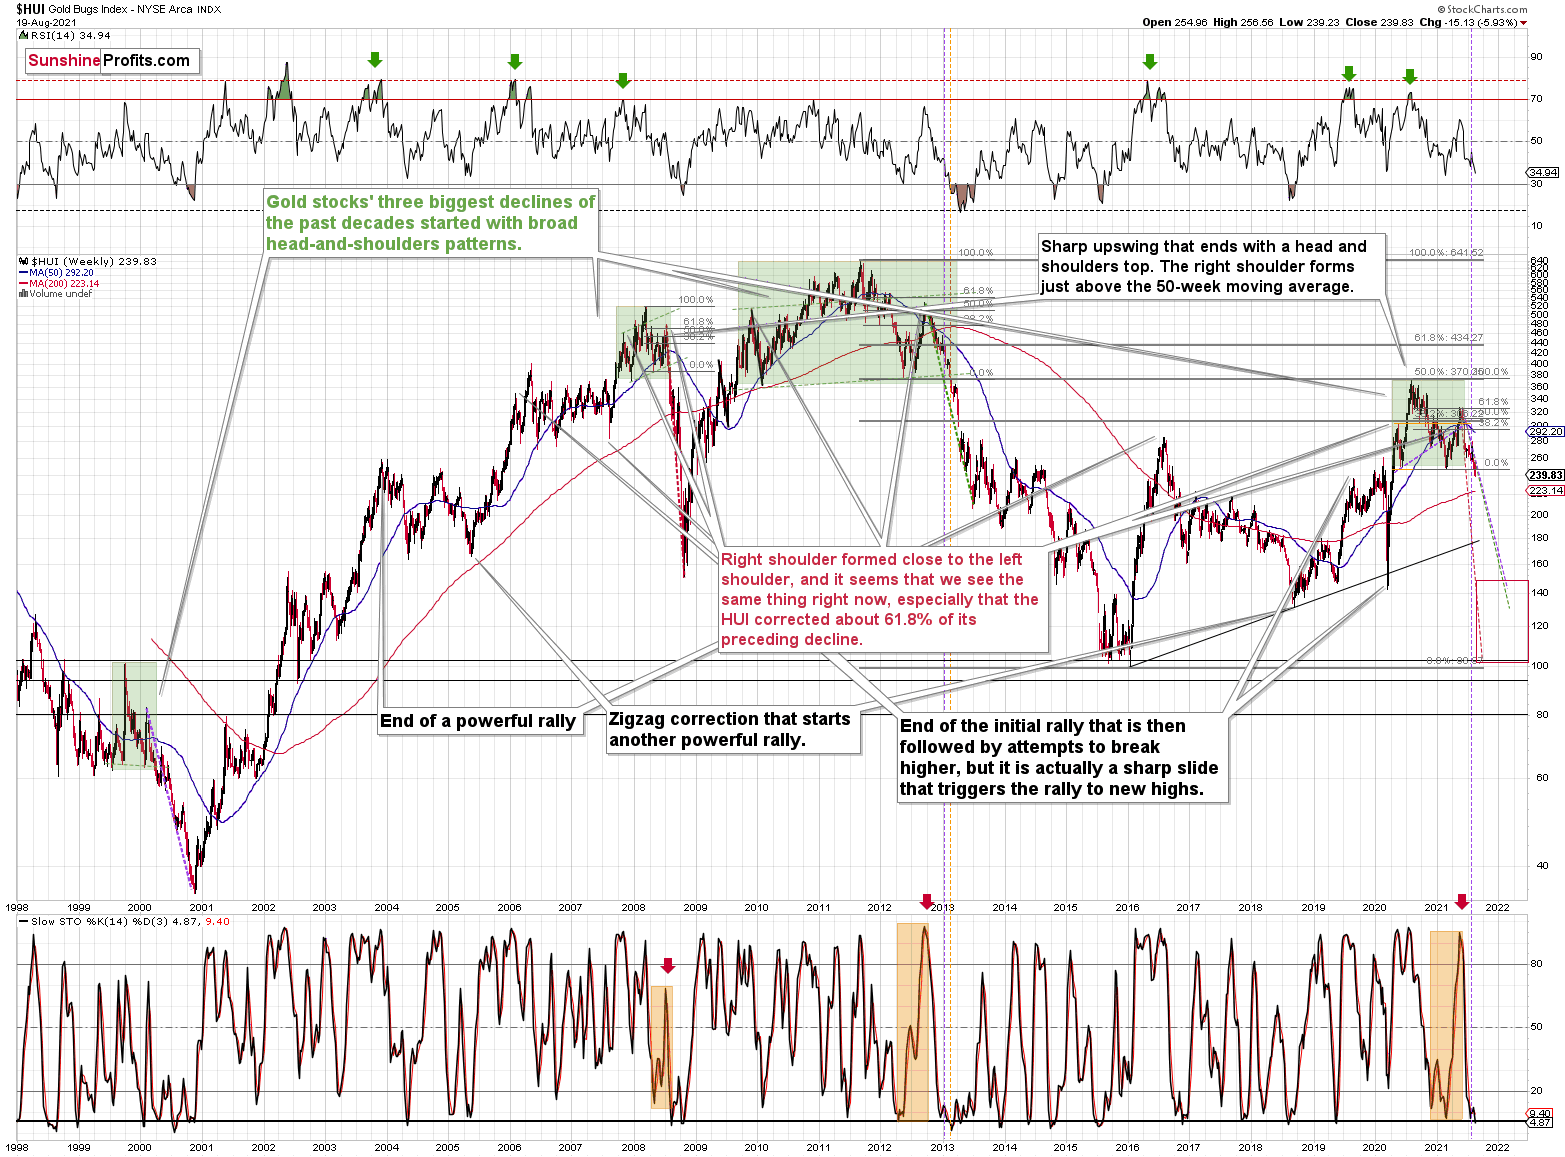
Remember when I told you that the tiny buy signal from the stochastic indicator was unlikely to trigger anything more than a brief pause? That was based on the analogy to what happened in late 2012 when miners paused, and then the decline simply continued. Well, gold stocks did exactly that and gold stocks declined once again. Right now, they are right after the breakdown to new yearly lows, and this has profound implications in light of the analogy to the 2012 – 2013 decline.
You see, when the HUI Index declined below the previous lows back in 2013, it meant that the biggest part of the slide was underway. The profit potential was still there, as it was still the first half of the biggest decline, but it meant that waiting for another big rebound in order to add to one’s short positions was not a good idea.
To clarify, there were two short-term consolidations soon after the breakdown in 2013. One of them took the HUI about 4% higher (in February 2013) and then we saw a decline. Afterwards, about 7%-8% correction (in March 2013) followed and then the biggest part of the decline took place.
Consequently, we might see a consolidation in gold stocks quite soon, but I wouldn’t expect it to be anything to write home about. At the current price levels, 4% – 8% means a rally of about 9 – 19 index. In the case of the GDXJ (if it moved in tune with the HUI), it would imply a move up by $1.5 - $3.
Of course, this is a hypothetical discussion of what might happen when gold stocks correct, but it doesn’t imply that they are likely to correct now. Actually, the opposite seems likely because of the HUI’s breakdown and the USD’s breakout. Again, forecasting gold stocks at higher levels in the near term might be a dangerous thing to do.
So, to clarify, the above-mentioned corrective upswing is likely to take place after another short-term move lower. If the GDXJ bottoms at about $35, then seeing it correct to about $36.5 - $38 will be quite normal.
As far as the short-term price moves in the mining stocks are concerned, my previous comments remain up-to-date. Yesterday, I wrote the following about the GDX ETF:
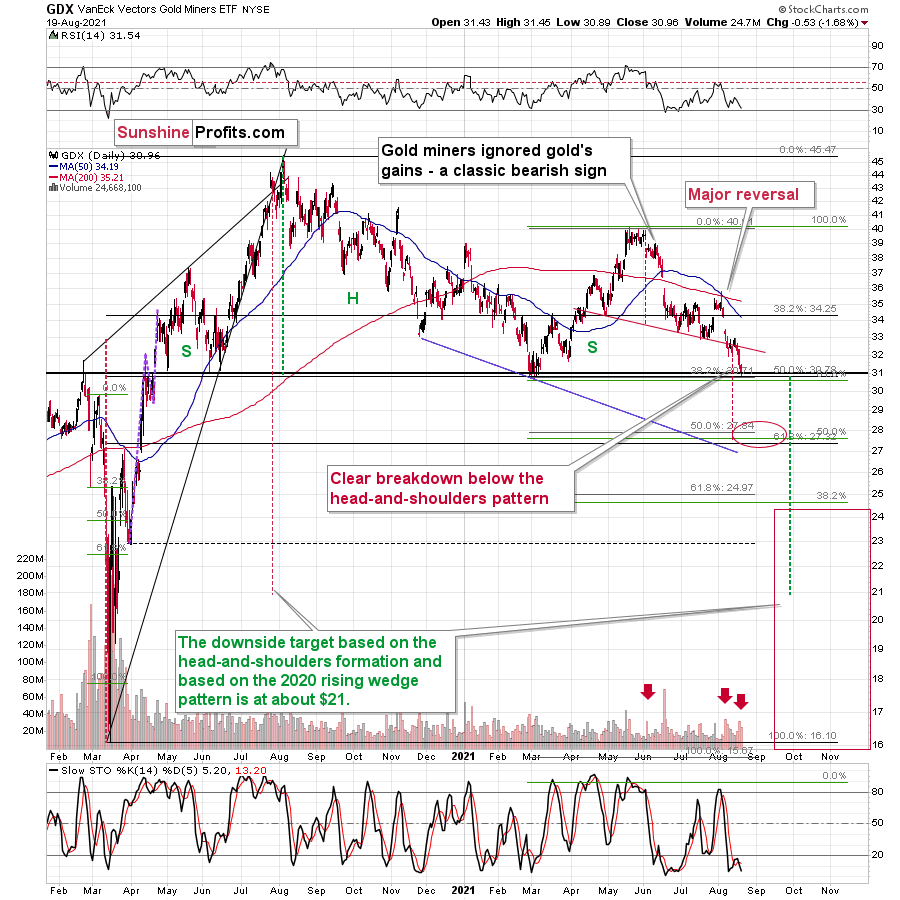
What happened? Senior gold miners finally broke decisively below the neck level of their head-and-shoulders formation, while juniors’ freefall continued.
Yesterday, senior miners closed below the neck level of the pattern for the second day, which means that the breakdown is almost confirmed.
The GDX has encountered strong support provided by the previous 2021 lows, but it doesn’t mean that we have to see a rebound here. Why? Because other proxies for mining stocks are already after the breakdown. This is the case with the GDXJ ETF, the HUI Index, and also the XAU Index. Even silver stocks – the SIL ETF –closed below the previous 2021 lows for the second day in a row.
So, did mining stocks encounter strong support here? Not really, only one of the proxies did – the GDX ETF. The remaining ones are already after a breakdown to new 2021 lows, and if we get a weekly close below them as well, the breakdown will be confirmed.
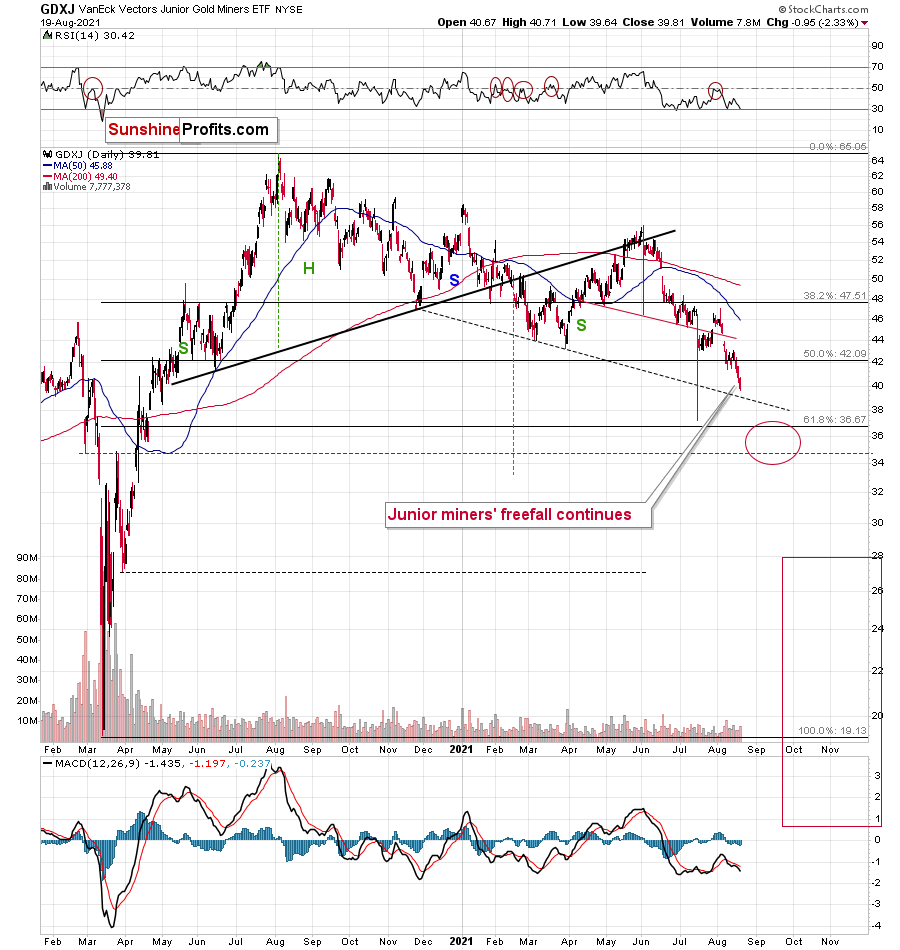
In yesterday’s analysis I wrote the following (and practically everything from it remains up-to-date):
The GDXJ proxy for junior miners moved lower once again – just as it was likely to do based on, i.a., the short-term flag (consolidation) pattern.
Now, based on the previously completed head-and-shoulders pattern, the downside target is at about $37. However, since this level is now relatively close (while the GDX has still some more to decline to reach its short-term downside target), it seems justified to expect the GDXJ to decline more than the head-and-shoulders pattern suggests. Besides, the H&S targets work on a “minimum” basis.
If you look at the ratio between both ETFs, you’ll see that unless something major changes, juniors are likely to continue to underperform seniors.
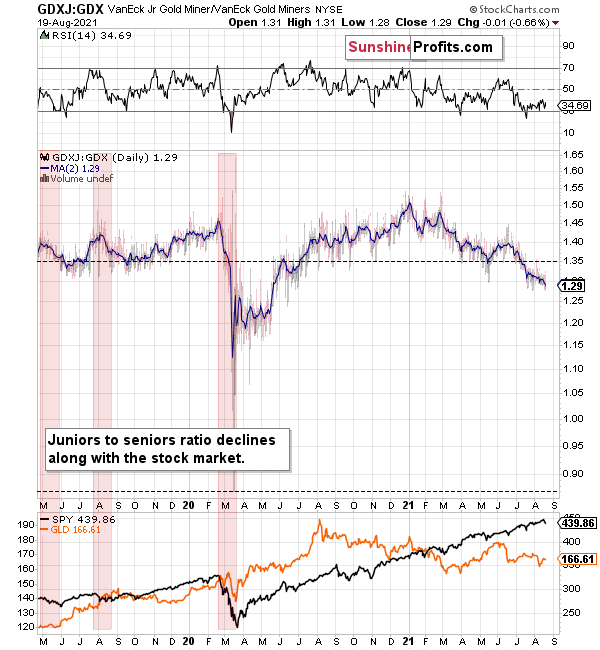
The trend in the ratio this year has been clearly down, and there’s no sign of a reversal, especially that the ratio broke below its 2019 support (which served as resistance in mid-2020). When the same thing happened in 2020, the ratio then spiked even below 1.
So, if the ratio is likely to continue its decline, then on a short-term basis we can expect it to decline to 1.27 or so. If the general stock market plunges, the ratio could move even lower, but let’s assume that stocks decline moderately (just as they did in the last couple of days) or that they do nothing or rally slightly. They’ve done all the above recently, so it’s natural to expect that this will be the case. Consequently, the trend in the GDXJ to GDX ratio would also be likely to continue, and thus expecting a move to about 1.26 - 1.27 seems rational.
If the GDX is about to decline to approximately $28 before correcting, then we might expect the GDXJ to decline to about $28 x 1.27 = $35.56 or $28 x 1.26 = $35.28. In other words, $28 in the GDX is likely to correspond to about $35 in the GDXJ.
Is there any technical support around $35 that would be likely to stop the decline? Yes. It’s provided by the late-Feb. 2020 low ($34.70) and the late-March high ($34.84). There’s also the late-April low at $35.63. Conservatively, I’m going to place the profit-take level just above the latter.
Consequently, it seems that expecting the GDXJ to decline to about $35 is justified from the technical point of view as well.
Let’s move to gold.
The Yellow Metal
Once again, gold didn’t do much yesterday – it declined by only $1.30, which makes the declines in the mining stocks even more bearish, as it was yet another day when they were exceptionally weak.
Why didn’t gold decline more? My yesterday’s explanation remains valid:
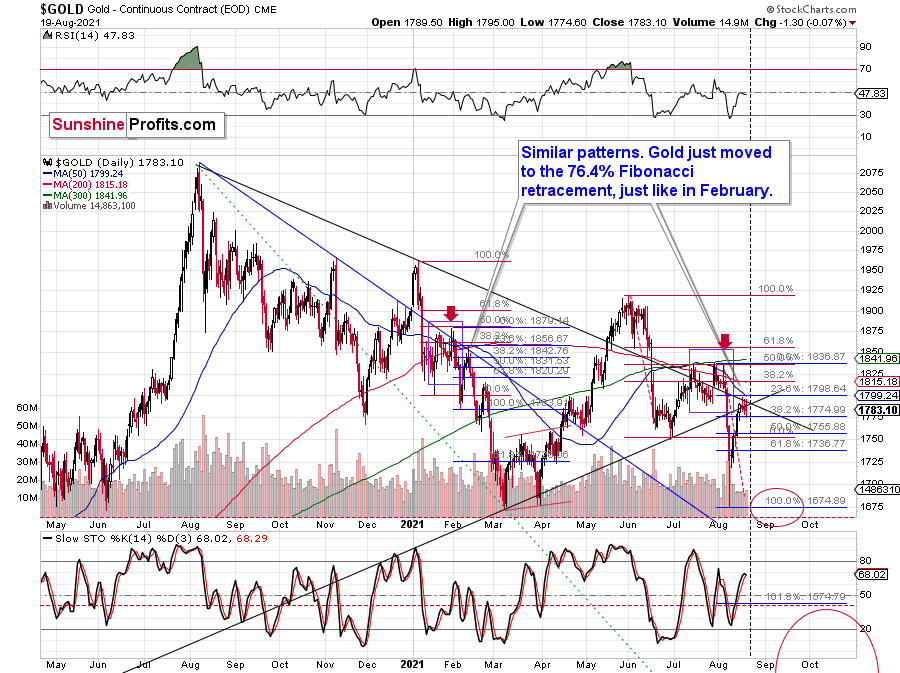
Probably because of technical reasons. It seems that gold is waiting for the triangle-vertex-based reversal that’s due on Monday. Gold doesn’t have to be 100% precise in this timing, but the existence of this reversal is enough for one to understand that gold’s reluctance to decline is not really a sign of strength, but something that can be easily explained otherwise.
This is an important observation, as one might also think that gold’s lack of substantial declines despite rallies in the USDX is bullish for the PMs. It isn’t.
And speaking of the USD Index, let’s take a look at what’s happening in it.
The USDX not only broke to new 2021 highs, but it managed to close above them as well! That’s clear and profound proof of the strength of the U.S. currency, which bottomed in early January.
When the USD Index was declining in late July, I wrote the following:
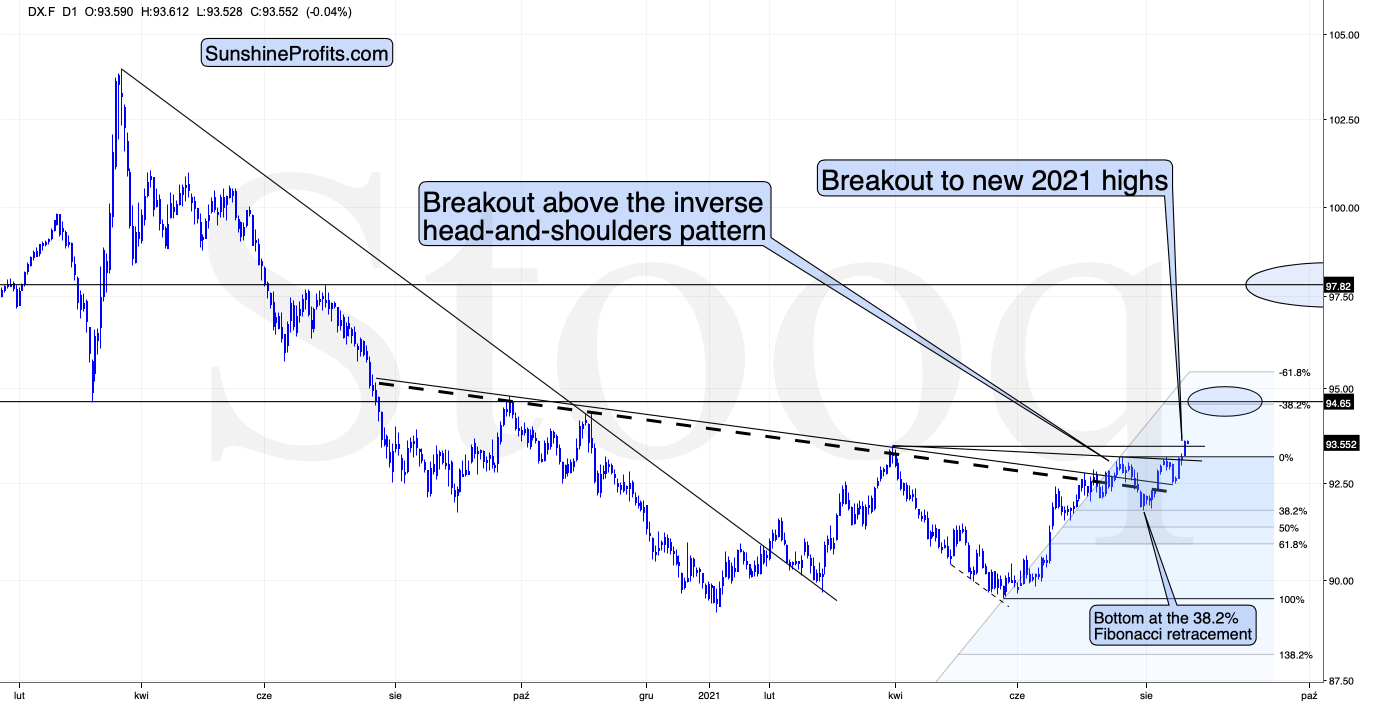
The USD Index invalidated the breakout above its inverse head-and-shoulders pattern, and if I had a long trading position in the USD Index, I would close it based on this development, as it suggests that the USDX might move a bit lower before rallying. I would plan to re-open this position just a little lower, though, as the next support provided by the 38.2% and 50% Fibonacci retracements is quite close. There’s quite a big chance that this move lower will be reversed too, based on the temporary nature of yesterday’s news.
That’s exactly what happened – the decline was reversed, and the next attempt to complete the inverse head-and-shoulders pattern was successful.
That was likely because of the overall tendency in the USD Index to reverse in the middle of the year and the analogy to what happened in 2014. I previously wrote the following in the last couple of flagship Gold & Silver Trading Alerts:
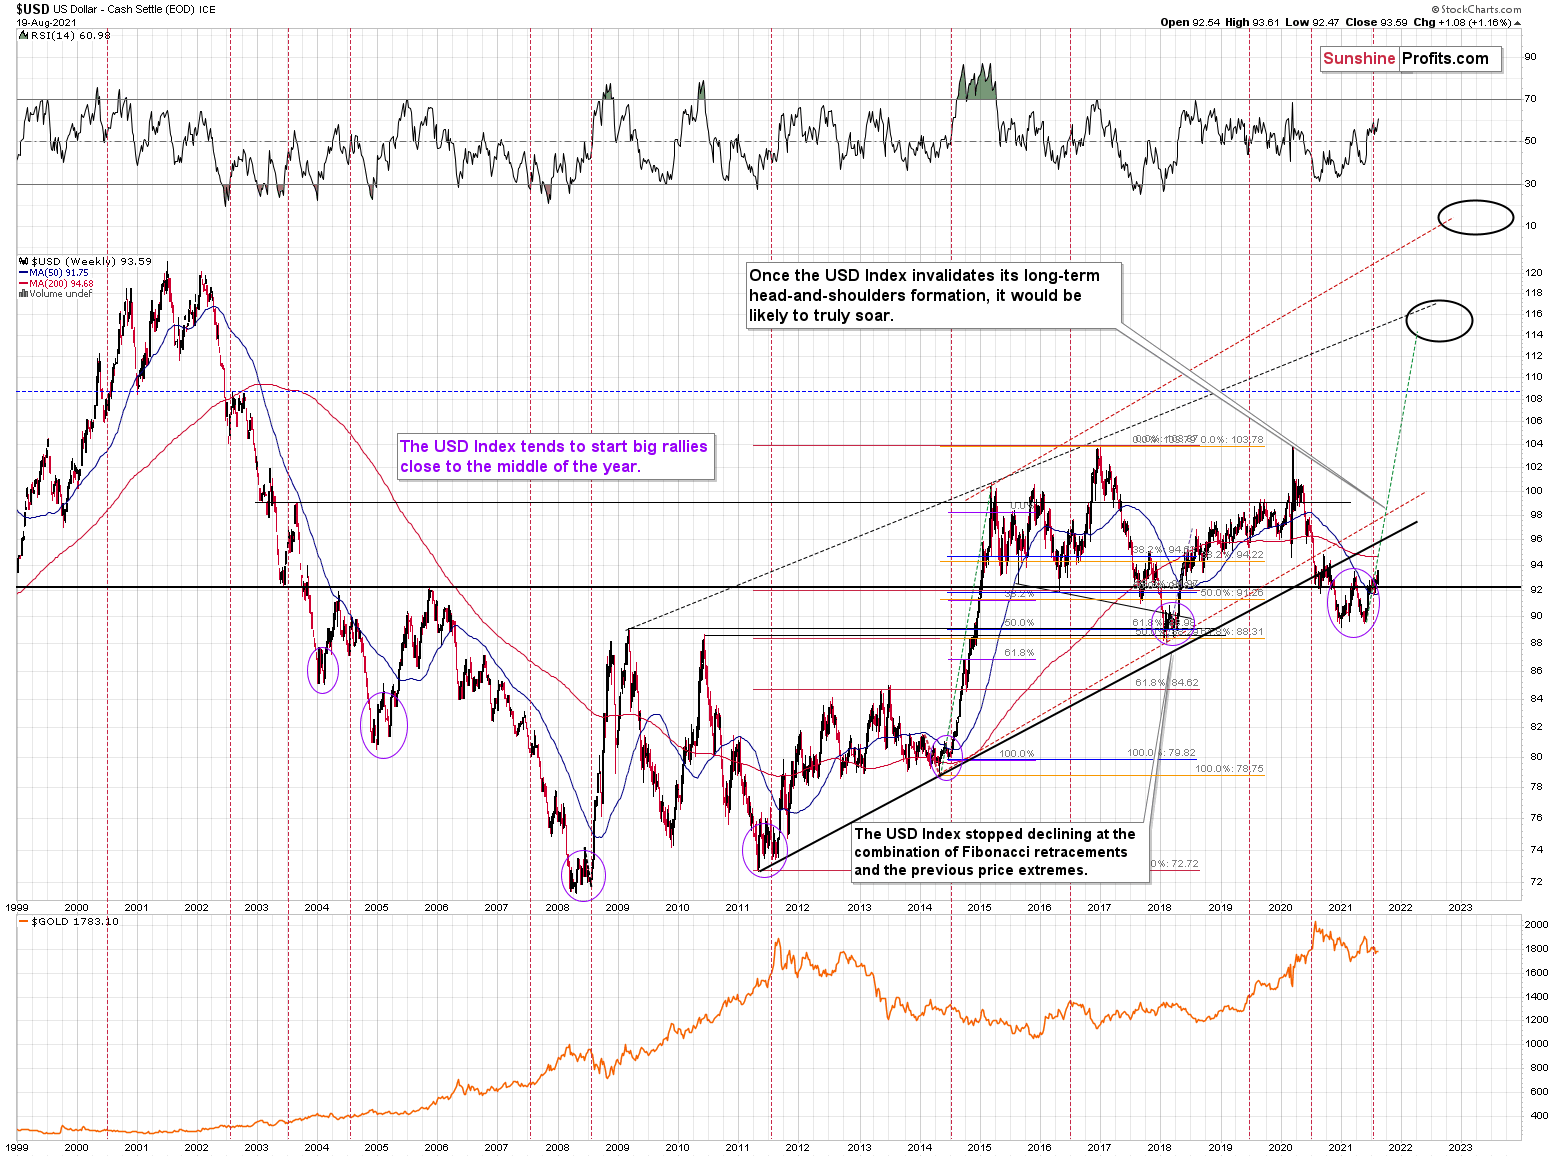
What’s more, profound rallies (marked by the red vertical dashed lines below) followed in 2008, 2011 and 2014. And with the current situation mirroring the latter, a small consolidation on the long-term chart is exactly what occurred before the USD Index surged in 2014. Likewise, the USD Index recently bottomed near its 50-week moving average; an identical development occurred in 2014. More importantly, though, with bottoms in the precious metals market often occurring when gold trades in unison with the USD Index (after ceasing to respond to the USD’s rallies with declines), we’re still far away from that milestone in terms of both price and duration.
Just as the USD Index took a breather before its massive rally in 2014, it seems that we saw the same recently. This means that predicting higher gold prices here is likely not a good idea.
Having said that, let’s take a look at the markets from a more fundamental angle.
Risky Business
With risk appetite souring across the financial markets in recent days, the EUR/USD hit a new 2021 low on Aug. 19. For context, the EUR/USD accounts for nearly 58% of the movement of the USD Index, and that’s why the currency pair’s performance is so important. And with the U.S. Federal Reserve (Fed) accelerating its taper timeline and the European Central Bank (ECB) lagging far behind, the EUR/USD still remains overvalued.
To explain, I wrote on Jul. 20:
Not only is the U.S. economy outperforming the Eurozone, but the Fed and the ECB are worlds apart. With FED officials’ hawkish rhetoric contrasting Chairman Jerome Powell’s perpetual patience, a game of ‘will they or won’t they’ is already underway. However, with the Fed likely to reveal its taper timeline in September, inflation differentials highlight the regional dichotomy.
Please see below:
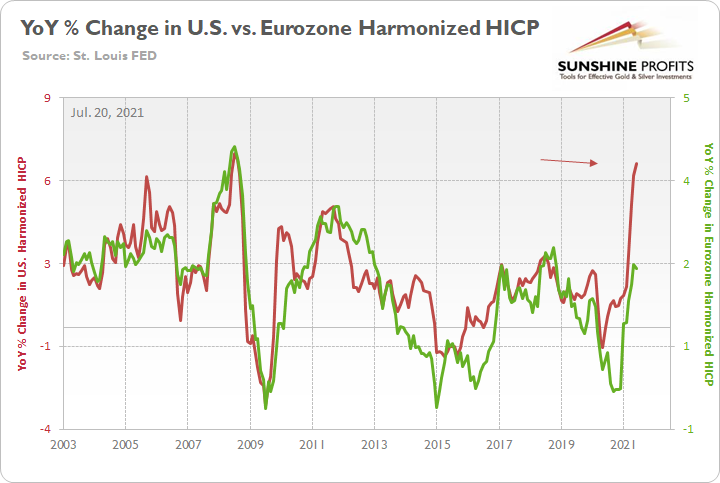
To explain, the green line above tracks the year-over-year (YoY) percentage change in the Eurozone Harmonized Index of Consumer Prices (HICP), while the red line above tracks the YoY percentage change in the U.S. HICP. If you analyze the right side of the chart, it’s not even close. And with the U.S. HICP rising by 6.41% YoY in June and the Eurozone HICP rising by 1.90%, the Fed is likely to taper well in advance of the ECB. For context, the divergence remains widespread, as the Eurozone HICP rose by 2.16% YoY in July (released on Aug. 18), while the U.S. HICP rose by 6.34%.
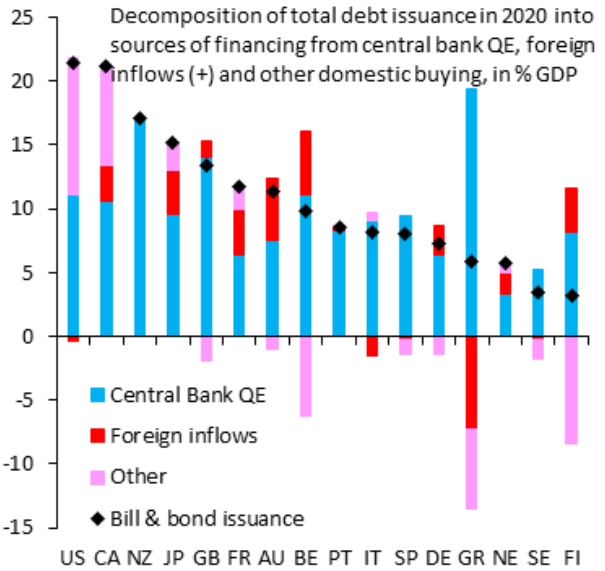
On top of that, while some argue that there is too much debt in the system for the Fed to actually taper, the Eurozone suffers from an even greater affliction. Case in point: with the ECB the only buyer in town, three of Europe’s four-largest economies rely (nearly) solely on the central bank to finance their debt.
Please see below:
 Source: IIF/Robin Brooks
To explain, the stacked bars above depict the buyers of various countries’ sovereign debt. If you analyze the column marked “US,” you can see that roughly half of the U.S. Treasury’s 2020 debt issuances have been purchased by the Fed (the light blue portion), while the other half has been purchased by domestic investors (the pink section). However, in stark contrast, if you analyze the columns labeled “IT” and “SP,” you can see that the ECB has purchased all, or nearly all, of Italy and Spain’s debt issuances since 2020. Likewise, if you analyze the column labeled “DE,” roughly 75% of German bonds have also been purchased by the ECB. As a result, with no buyers in sight, if the ECB tapers, interest rates in Italy and Spain could spike and derail Europe’s already tepid recovery. Thus, the Eurozone is much more dependent on the ECB than the U.S. is on the Fed, and the predicament implies looser-for-longer European monetary policy, which is bearish for the EUR/USD.
Double Means Trouble… Almost Like Crypto
Furthermore, while the USD Index marches higher, several tailwinds still remain. For example, the S&P 500’s recent trepidation has resulted in a safe-haven bid for the U.S. dollar. And with the Delta variant surging and a profound correction likely to occur over the medium term, heightened volatility could add further momentum to the USD Index’s recent breakout.
Please see below:
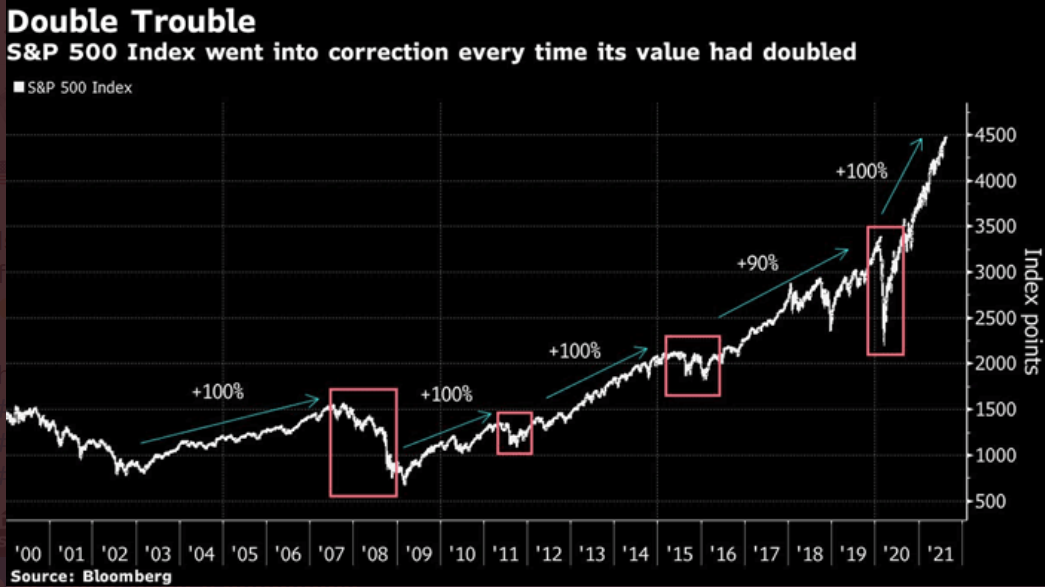
To explain, the S&P 500 has doubled the March 2020 lows. And since 2000, every time the U.S. equity benchmark reached this milestone, a correction of at least 10% followed. Moreover, with the recent ‘growth scare’ barely impacting the headline index, the risk of further downside looms large.
To that point, with energy, materials, industrials and some pockets of consumer discretionary suffering mightily in recent weeks, market breadth has been obliterated. And with that, overconcentration could eventually light fireworks on Wall Street.
Please see below:
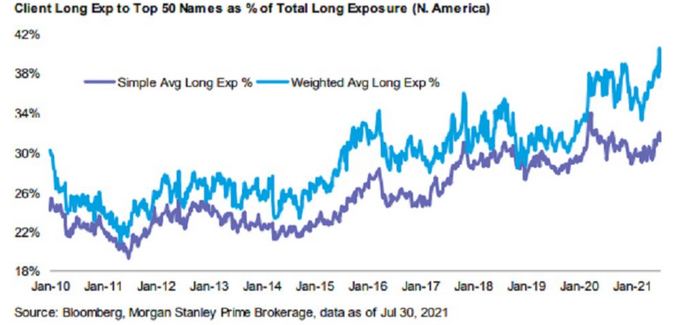
To explain, the light blue line above tracks Morgan Stanley’s clients’ long exposure to the 50 most popular U.S. stocks as a percentage of their overall long exposure. If you analyze the right side of the chart, you can see that investors’ appetite for the most crowded names has surged to a more than 10-year high.
As further evidence, the breadth implosion has caused index heavyweights to become the only game in town. For example, the five largest stocks in the S&P 500 – Microsoft, Apple, Amazon, Alphabet and Facebook – now account for 22% of the index’s market cap while only generating 16% of the index’s earnings.
Please see below:
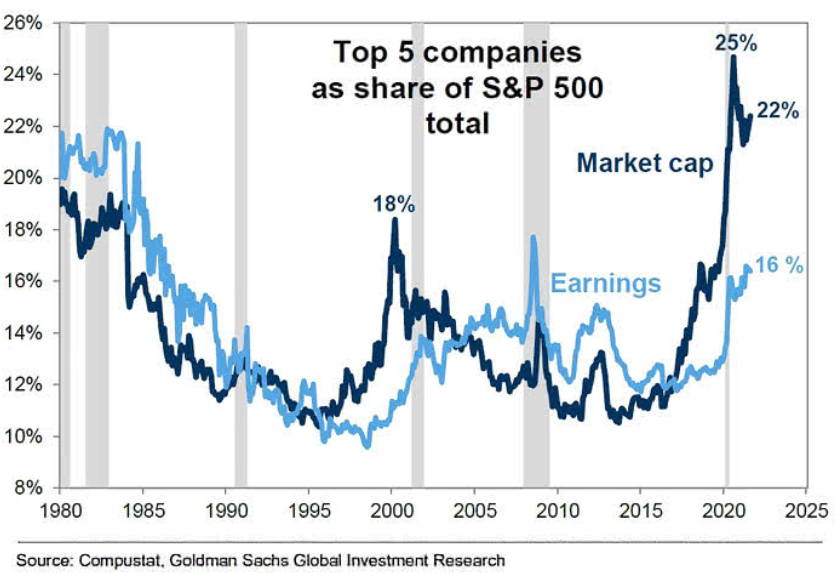
To explain, the five largest companies in the S&P 500 accounted for 18% of the S&P 500’s market cap at the height of the dot-com bubble. And while the figure has declined from its 2020 peak (25%), it’s been moving higher in recent weeks (follow the dark blue line). As a result, a handful of stocks have been doing the bulk of the S&P 500’s heavy lifting.
What’s more, not only do technicals and fundamentals signal a material correction, but sentiment has also soured. Case in point: Bank of America’s latest Global Fund Manager Survey revealed that institutions’ expectations for a stronger economy have sunk like a stone. And with the percentage of respondents that are “overweight equities” demonstrating a strong correlation, an unwinding of their long exposure still has room to catch up.
Please see below:
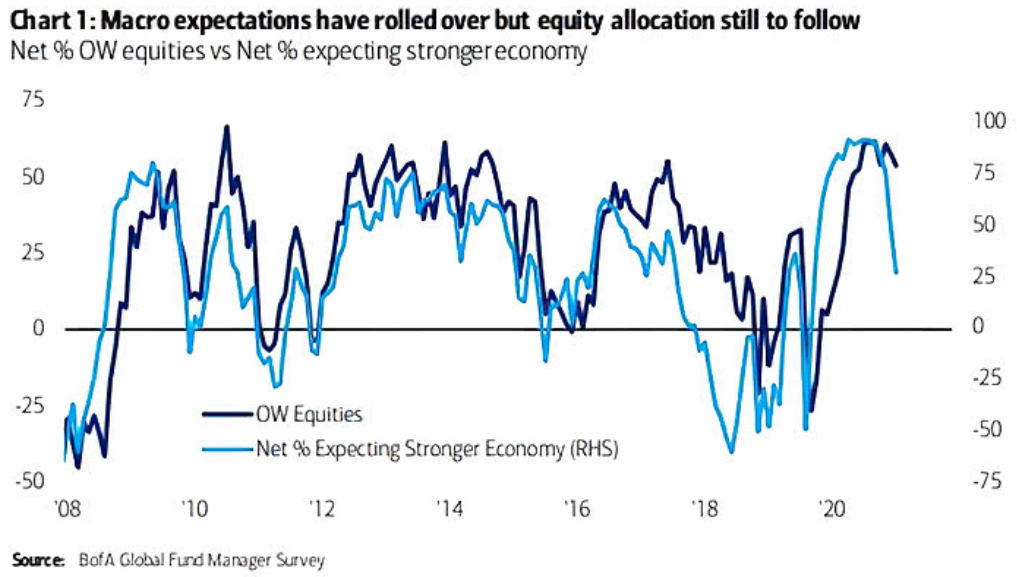
To explain, the light blue line above tracks the net percentage of institutions that expect a stronger economy, while the dark blue line above tracks the net percentage of institutions that are overweight equities. If you analyze the gap on the right side of the chart, the dark blue line is still materially elevated relative to its counterpart.
Aim… Shoot!
Likewise, while institutions still expect global inflation to subside, the Fed’s taper timeline is now firmly in their crosshairs.
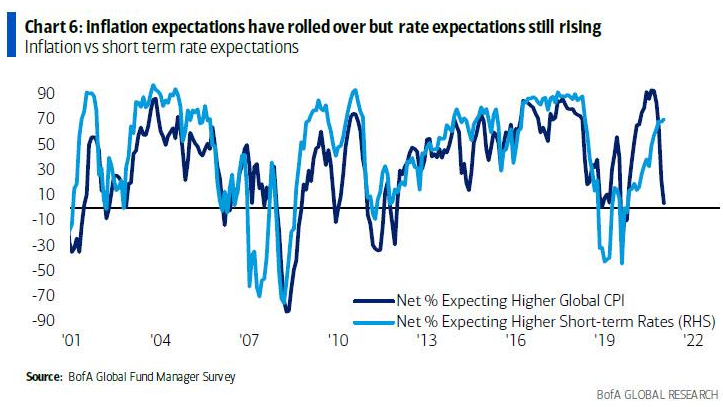
To explain, the dark blue line above tracks the net-percentage of institutions that expect a higher global Consumer Price Index (CPI), while the light blue line above tracks the net-percentage of institutions that expect higher short-term interest rates. If you analyze the right side of the chart, you can see that institutions fear that the taper is already a done deal.
Finally, while we await a potential climax, high yield credit spreads are quietly sounding the alarm. For context, high yield bonds are the riskiest segment of the credit market, and they have the highest default risk. As a result, they trade similar to equities and investors have virtually no claim during bankruptcies.
Please see below:
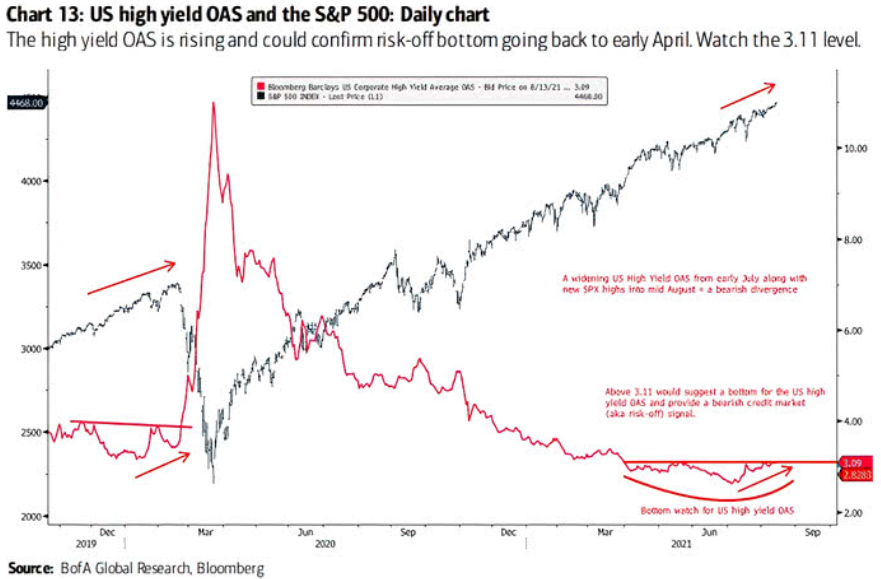
To explain, the black line above tracks the S&P 500, while the red line above tracks the high yield option-adjusted spread (OAS). If you analyze the right side of the chart, you can see that while the black line has been making new highs, the red line has been seeking higher ground as well. Moreover, if you turn your attention to the left side of the chart, you can see that when both metrics rose in January and February 2020, the convergence preceded the March 2020 crash. As a result, another moment of misery could soon confront overzealous investors.
In conclusion, the financial markets are showing signs of stress as the USD Index makes new highs, while the EUR/USD and gold miners make new lows. And with a real correction of the S&P 500 liable to accelerate the divergence, the PMs remain in no man’s land. As a result, while the precious metals are poised to shine bright over the long term, autumn headwinds will likely add to their underperformance before the group resumes its secular uptrend.
Overview of the Upcoming Part of the Decline
- The corrective upswing in gold is over, and the big decline seems to be already underway.
- After miners slide in a meaningful and volatile way, but silver doesn’t (and it just declines moderately), I plan to switch from short positions in miners to short positions in silver. At this time, it’s too early to say at what price levels this would take place – perhaps with gold close to $1,600. I plan to exit those short positions when gold shows substantial strength relative to the USD Index, while the latter is still rallying. This might take place with gold close to $1,350 - $1,500 and the entire decline (from above $1,900 to about $1,475) would be likely to take place within 6-20 weeks, and I would expect silver to fall the hardest in the final part of the move. This moment (when gold performs very strongly against the rallying USD and miners are strong relative to gold – after gold has already declined substantially) is likely to be the best entry point for long-term investments, in my view. This might also happen with gold close to $1,475, but it’s too early to say with certainty at this time.
- As a confirmation for the above, I will use the (upcoming or perhaps we have already seen it?) top in the general stock market as the starting point for the three-month countdown. The reason is that after the 1929 top, gold miners declined for about three months after the general stock market started to slide. We also saw some confirmations of this theory based on the analogy to 2008. All in all, the precious metals sector would be likely to bottom about three months after the general stock market tops.
- The above is based on the information available today, and it might change in the following days/weeks.
Please note that the above timing details are relatively broad and “for general overview only” – so that you know more or less what I think and how volatile I think the moves are likely to be – on an approximate basis. These time targets are not binding or clear enough for me to think that they should be used for purchasing options, warrants or similar instruments.
Letters to the Editor
Q: The only question I have is at what point are you planning to change to silver miners? And I understand that it’s hard to forecast, but based on the recent developments, do you think we might see your target of gold at $1500 this year?
Thanks for the great newsletters, I enjoy every single one of them.
A: Thanks for the kind words, I’m very happy that you enjoy our work!
I would like to clarify that my plan is not to switch from a short position in junior mining stocks to a short position in silver mining stocks, but it is to change from a short position in junior mining stocks to a short position in silver (the metal, not the mining companies).
Silver stocks are likely to act like both: silver and mining stocks, and it is the “silver” aspect that is particularly interesting in the final part of the decline.
Please take a look at what silver did on March 13 and March 16.
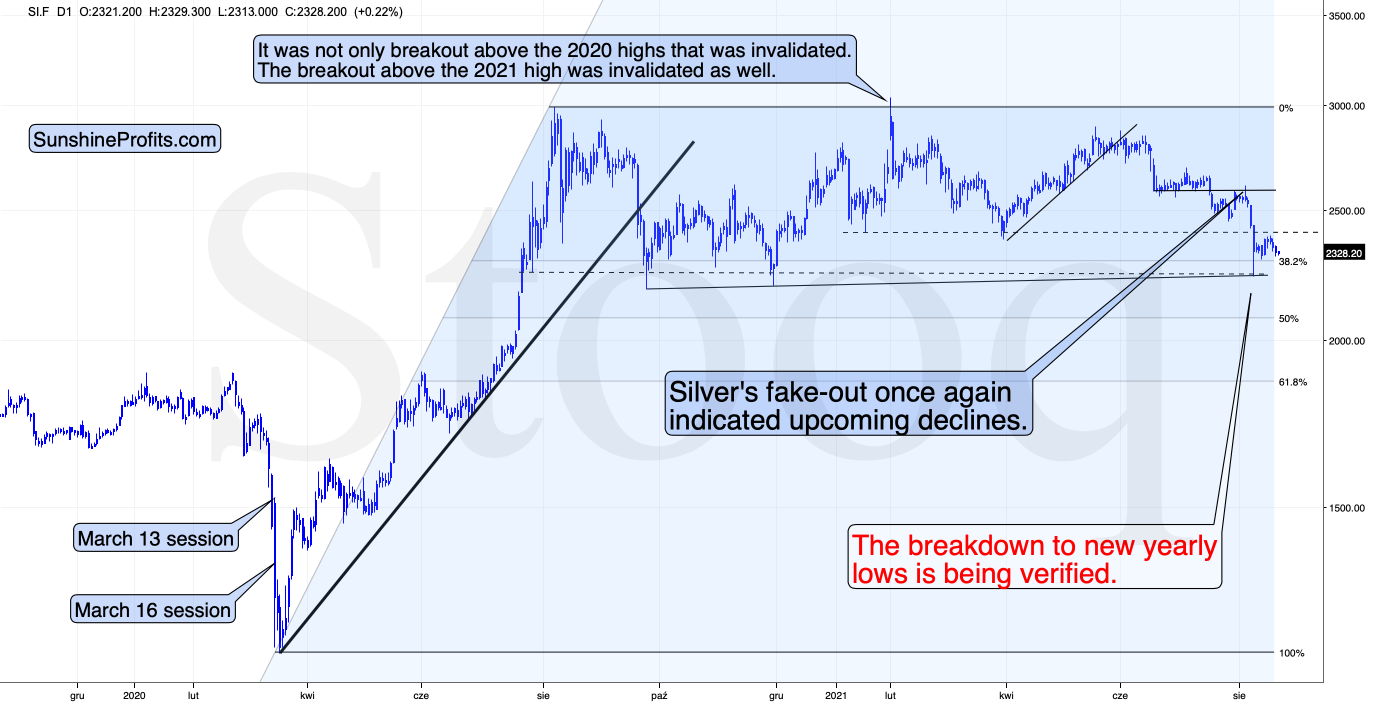
That was when it plunged the most.
And what did junior mining stocks do at that time?
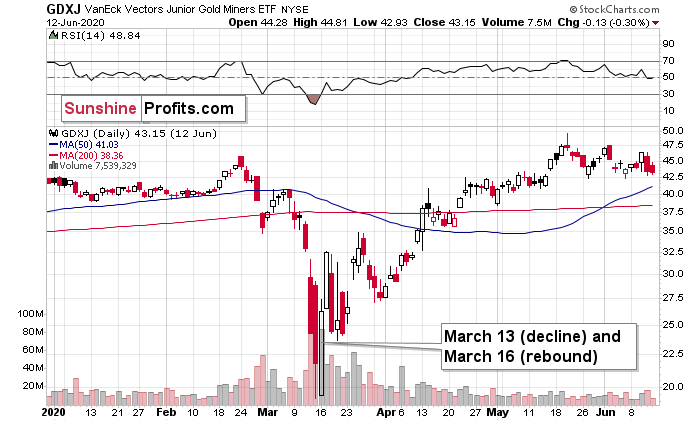
Juniors declined on March 13, but they rallied back up on March 16 and ultimately ended the two days higher.
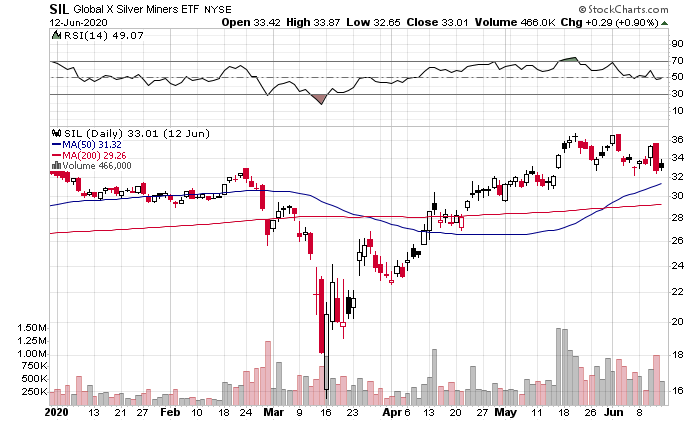
Silver stocks performed more like mining stocks than like silver – they ended the March 13 and March 16 sessions lower, but not that much lower as silver did.
To clarify: it is not written in stone that I will switch from a short position in junior miners to a short position in silver, and in particular that I’m going to do so before the next short-term bottom. The market might provide us with an opportunity similar to what we saw in early 2020 when miners declined profoundly and silver declined just a little – that was when it was great to exit the short position in the mining stocks and enter one in silver. But if silver keeps declining along with miners, we might not see this opportunity at all.
It seems very likely that we’ll see it before the final bottom, and it’s also quite likely that we’ll see it shortly.
In fact, the GDXJ ETF is already well below its early-August lows, and the SLV ETF is not. So, if we see another day (or a few days) of weakness in the junior miners – and it’s really significant – and we don’t see it in the case of silver, I might decide to switch from the short position in junior miners to one in silver very soon. I don’t have a specific price at which I would make this switch, though. If I did, I’d let you know in advance.
I’ll keep you posted via intraday Gold & Silver Trading Alerts whenever required.
And yes, I expect that we’ll see gold below $1,500 this year.
Summary
To summarize, the medium- and short-term outlooks for the precious metals sector remain down. The breakdown to new yearly lows in the HUI Index and to new yearly highs in the USD Index serve as profound confirmations that a huge downswing in the precious metals sector is underway and that its biggest part is likely just ahead.
It seems that our profits from the short positions are going to become truly epic in the following weeks.
After the sell-off (that takes gold to about $1,350 - $1,500), I expect the precious metals to rally significantly. The final part of the decline might take as little as 1-5 weeks, so it's important to stay alert to any changes.
Most importantly, please stay healthy and safe. We made a lot of money last March and this March, and it seems that we’re about to make much more on the upcoming decline, but you have to be healthy to enjoy the results.
As always, we'll keep you - our subscribers - informed.
By the way, we’re currently providing you with the possibility to extend your subscription by a year, two years or even three years with a special 20% discount. This discount can be applied right away, without the need to wait for your next renewal – if you choose to secure your premium access and complete the payment upfront. The boring time in the PMs is definitely over, and the time to pay close attention to the market is here. Naturally, it’s your capital, and the choice is up to you, but it seems that it might be a good idea to secure more premium access now while saving 20% at the same time. Our support team will be happy to assist you in the above-described upgrade at preferential terms – if you’d like to proceed, please contact us.
To summarize:
Trading capital (supplementary part of the portfolio; our opinion): Full speculative short positions (300% of the full position) in mining stocks are justified from the risk to reward point of view with the following binding exit profit-take price levels:
Mining stocks (price levels for the GDXJ ETF): binding profit-take exit price: $35.73; stop-loss: none (the volatility is too big to justify a stop-loss order in case of this particular trade)
Alternatively, if one seeks leverage, we’re providing the binding profit-take levels for the JDST (2x leveraged) and GDXD (3x leveraged – which is not suggested for most traders/investors due to the significant leverage). The binding profit-take level for the JDST: $16.96; stop-loss for the JDST: none (the volatility is too big to justify a SL order in case of this particular trade); binding profit-take level for the GDXD: $35.46; stop-loss for the GDXD: none (the volatility is too big to justify a SL order in case of this particular trade).
For-your-information targets (our opinion; we continue to think that mining stocks are the preferred way of taking advantage of the upcoming price move, but if for whatever reason one wants / has to use silver or gold for this trade, we are providing the details anyway.):
Silver futures upside profit-take exit price: unclear at this time - initially, it might be a good idea to exit, when gold moves to $1,683
Gold futures upside profit-take exit price: $1,683
HGD.TO – alternative (Canadian) inverse 2x leveraged gold stocks ETF – the upside profit-take exit price: $11.38
Long-term capital (core part of the portfolio; our opinion): No positions (in other words: cash
Insurance capital (core part of the portfolio; our opinion): Full position
Whether you already subscribed or not, we encourage you to find out how to make the most of our alerts and read our replies to the most common alert-and-gold-trading-related-questions.
Please note that we describe the situation for the day that the alert is posted in the trading section. In other words, if we are writing about a speculative position, it means that it is up-to-date on the day it was posted. We are also featuring the initial target prices to decide whether keeping a position on a given day is in tune with your approach (some moves are too small for medium-term traders, and some might appear too big for day-traders).
Additionally, you might want to read why our stop-loss orders are usually relatively far from the current price.
Please note that a full position doesn't mean using all of the capital for a given trade. You will find details on our thoughts on gold portfolio structuring in the Key Insights section on our website.
As a reminder - "initial target price" means exactly that - an "initial" one. It's not a price level at which we suggest closing positions. If this becomes the case (like it did in the previous trade), we will refer to these levels as levels of exit orders (exactly as we've done previously). Stop-loss levels, however, are naturally not "initial", but something that, in our opinion, might be entered as an order.
Since it is impossible to synchronize target prices and stop-loss levels for all the ETFs and ETNs with the main markets that we provide these levels for (gold, silver and mining stocks - the GDX ETF), the stop-loss levels and target prices for other ETNs and ETF (among other: UGL, GLL, AGQ, ZSL, NUGT, DUST, JNUG, JDST) are provided as supplementary, and not as "final". This means that if a stop-loss or a target level is reached for any of the "additional instruments" (GLL for instance), but not for the "main instrument" (gold in this case), we will view positions in both gold and GLL as still open and the stop-loss for GLL would have to be moved lower. On the other hand, if gold moves to a stop-loss level but GLL doesn't, then we will view both positions (in gold and GLL) as closed. In other words, since it's not possible to be 100% certain that each related instrument moves to a given level when the underlying instrument does, we can't provide levels that would be binding. The levels that we do provide are our best estimate of the levels that will correspond to the levels in the underlying assets, but it will be the underlying assets that one will need to focus on regarding the signs pointing to closing a given position or keeping it open. We might adjust the levels in the "additional instruments" without adjusting the levels in the "main instruments", which will simply mean that we have improved our estimation of these levels, not that we changed our outlook on the markets. We are already working on a tool that would update these levels daily for the most popular ETFs, ETNs and individual mining stocks.
Our preferred ways to invest in and to trade gold along with the reasoning can be found in the how to buy gold section. Furthermore, our preferred ETFs and ETNs can be found in our Gold & Silver ETF Ranking.
As a reminder, Gold & Silver Trading Alerts are posted before or on each trading day (we usually post them before the opening bell, but we don't promise doing that each day). If there's anything urgent, we will send you an additional small alert before posting the main one.
Thank you.
Przemyslaw Radomski, CFAFounder, Editor-in-chief

