
tools spotlight

-
Gold Consolidation: Silver Takes Center Stage
September 28, 2021, 9:01 AMGold didn’t do much yesterday, but there was more than one thing happening that served as an additional bearish confirmation. The most important sign came from silver’s short-term outperformance.
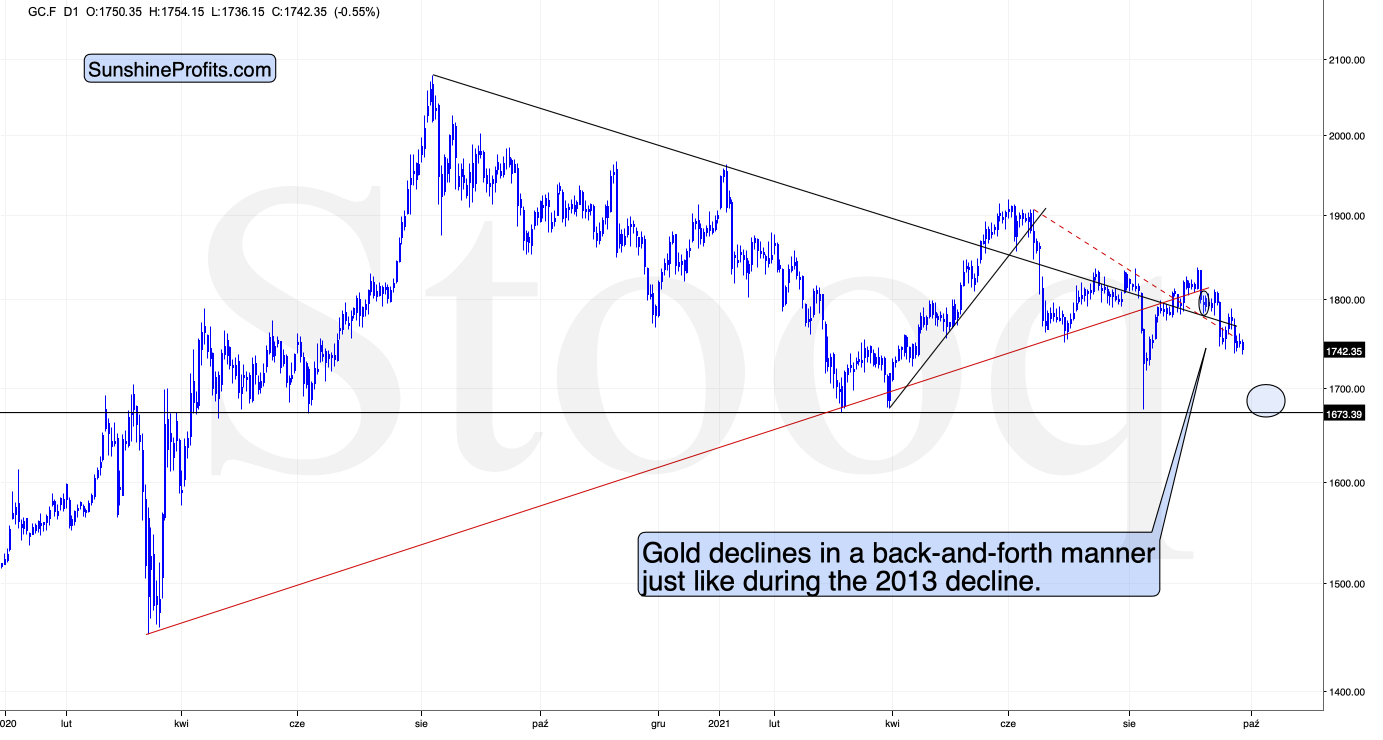
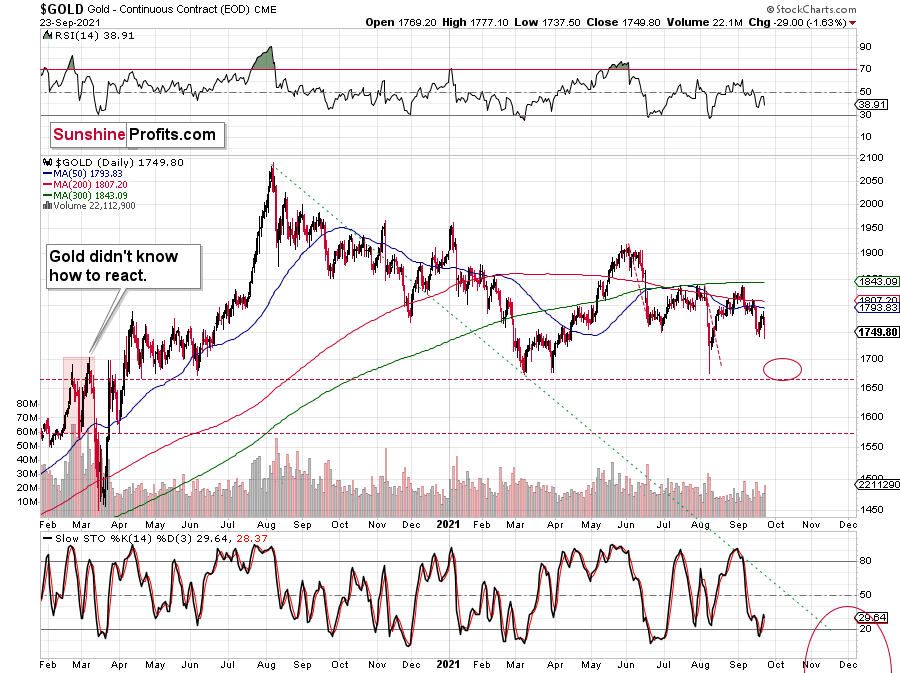
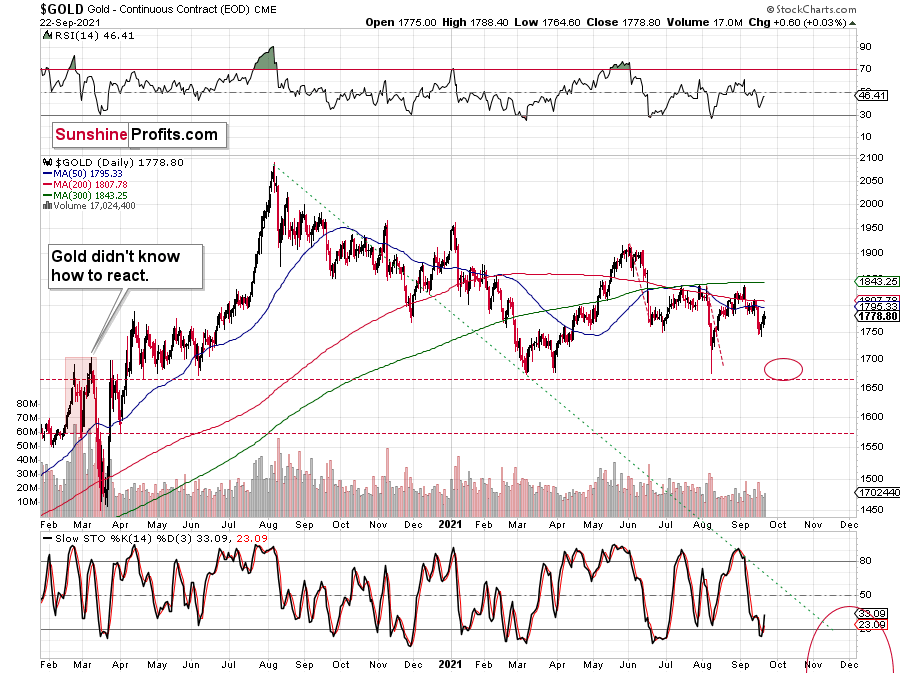
As you can see on the above chart, gold formed a bearish reversal candlestick yesterday, and it moved lower in today’s pre-market trading. Since it has just moved to a new monthly low, it could be the case that yet another small corrective upswing is already over.
“Yet another,” as gold has been declining in a back-and-forth manner for a few weeks now. As I explained yesterday and in the previous weeks, this makes the current situation similar to what we saw previously – in 2013.
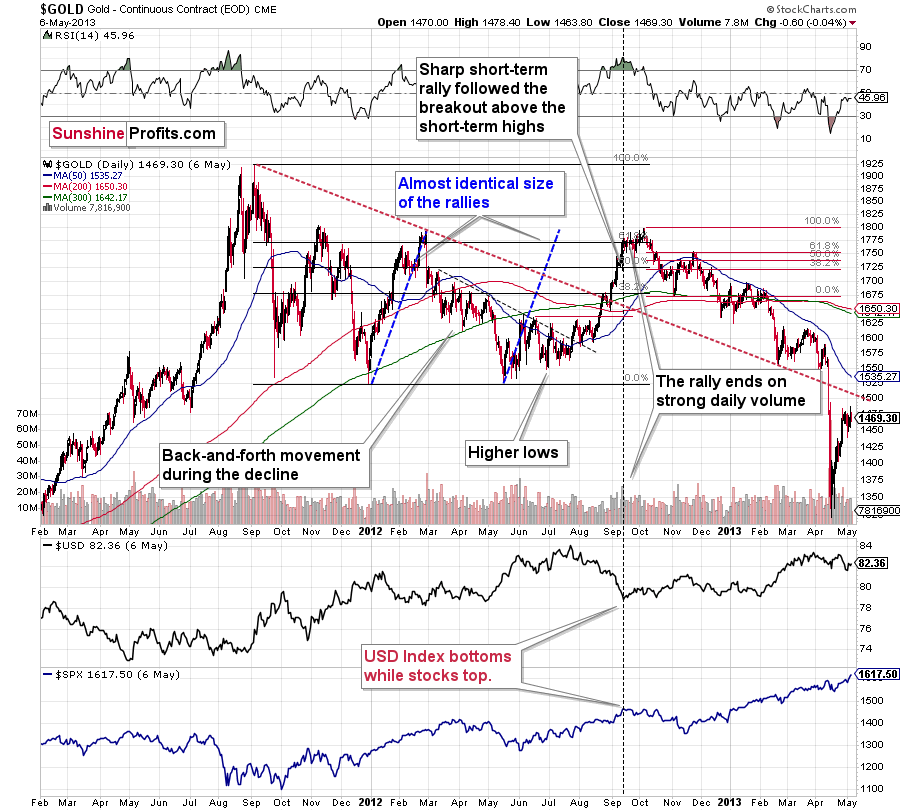
Between September 2012 and February 2013, gold declined in a back-and-forth manner as well, and the current situation seems to be analogous to what we saw in February 2013. At the time, the final short-term upswing took gold to its 50-day moving average (marked with blue), and we saw something very similar recently. The recent high ($1788.40) was very close to gold’s 50-day moving average too – less than $10 from it.
Silver in the Spotlight
However, as I wrote at the beginning of today’s analysis, the key bearish sign of yesterday’s session came from silver.
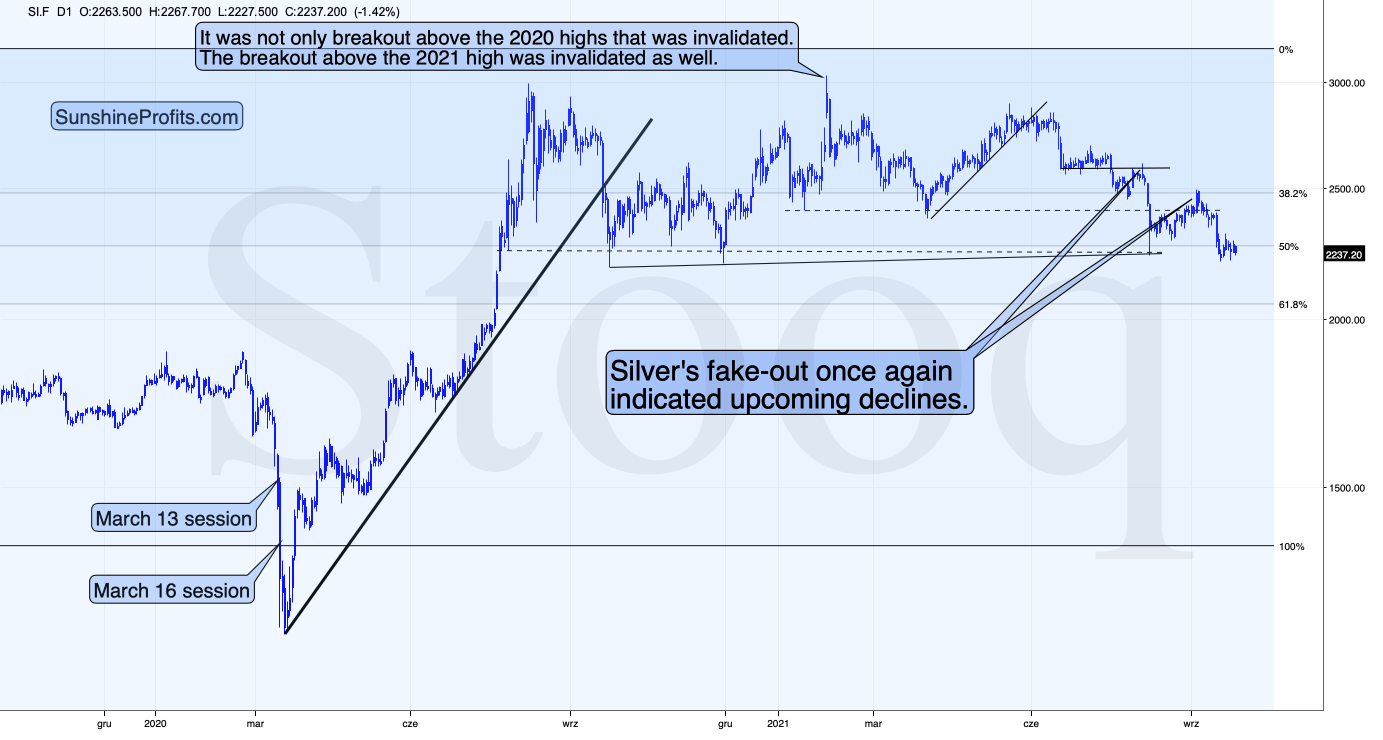
While gold ended yesterday’s session only 0.02% higher, silver ended it 1.20% higher. This means that silver outperformed gold yesterday. Silver’s short-term outperformance of gold is bearish, especially when it’s accompanied by mining stocks’ weakness relative to gold.
While miners didn’t underperform gold yesterday, they did so on Friday. Thus, it’s fair to say that we saw a mix of those two important signs, and they together paint a bearish picture for the short run.
Despite the intraday rally, the GDX ETF ended yesterday’s session completely unchanged.
And while gold and silver moved slightly higher, GDX did nothing, and the GDXJ ETF underperformed, just as it was likely to.
The GDXJ declined by 0.1%. This may not be a lot, but the GDXJ was once again one of the weakest parts of the precious metals sector, which bodes well for our profitable short positions in the junior miners. The fact that this was the lowest close that we saw so far (!) this year adds to the bearish implications.
The USD Index
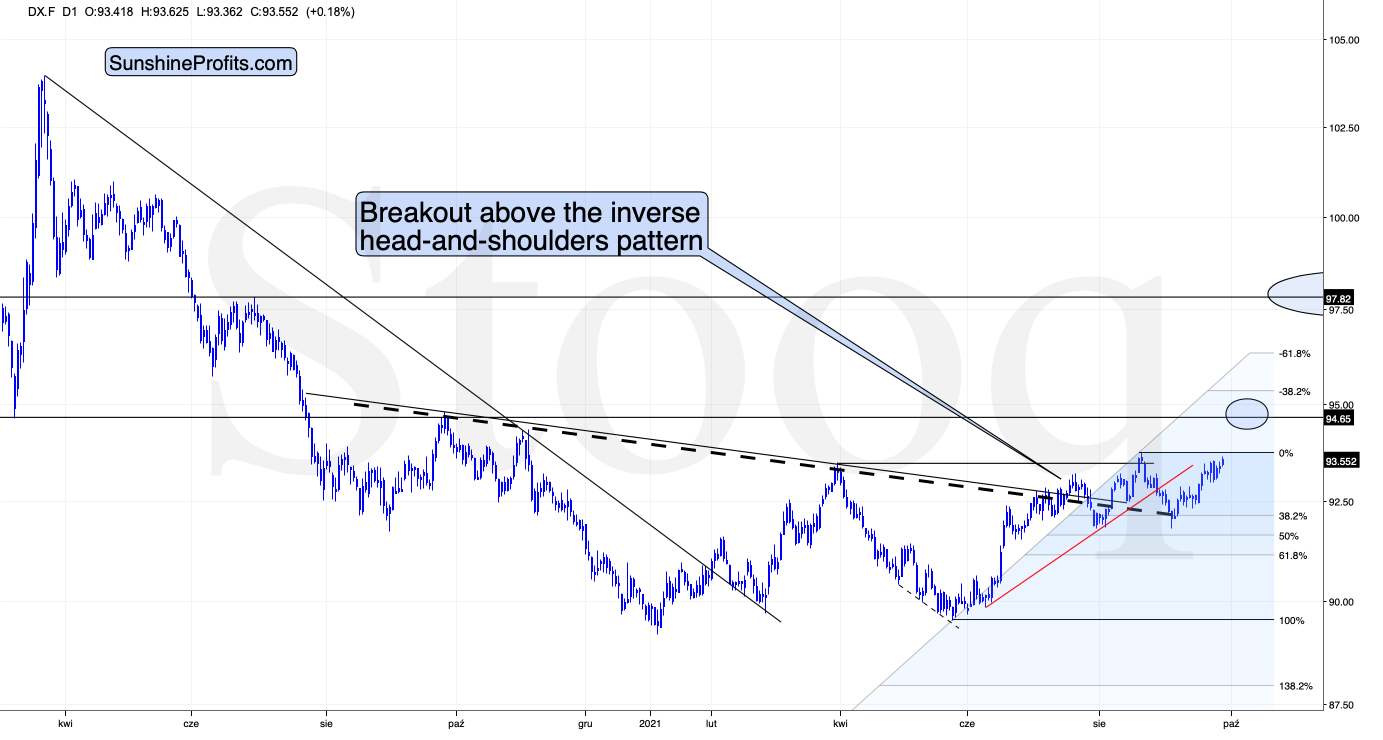
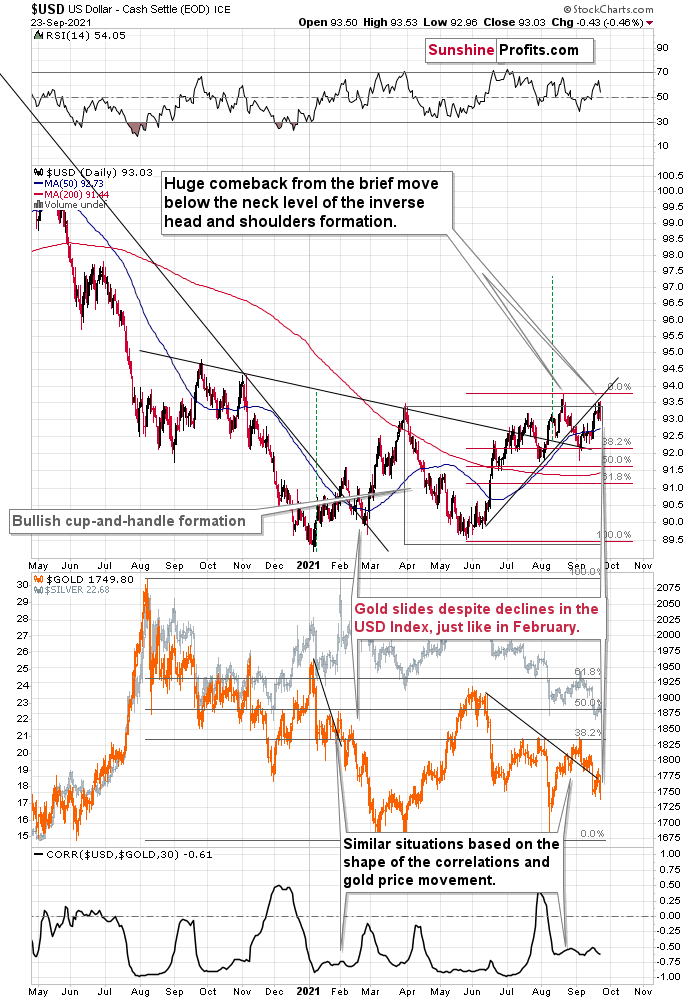
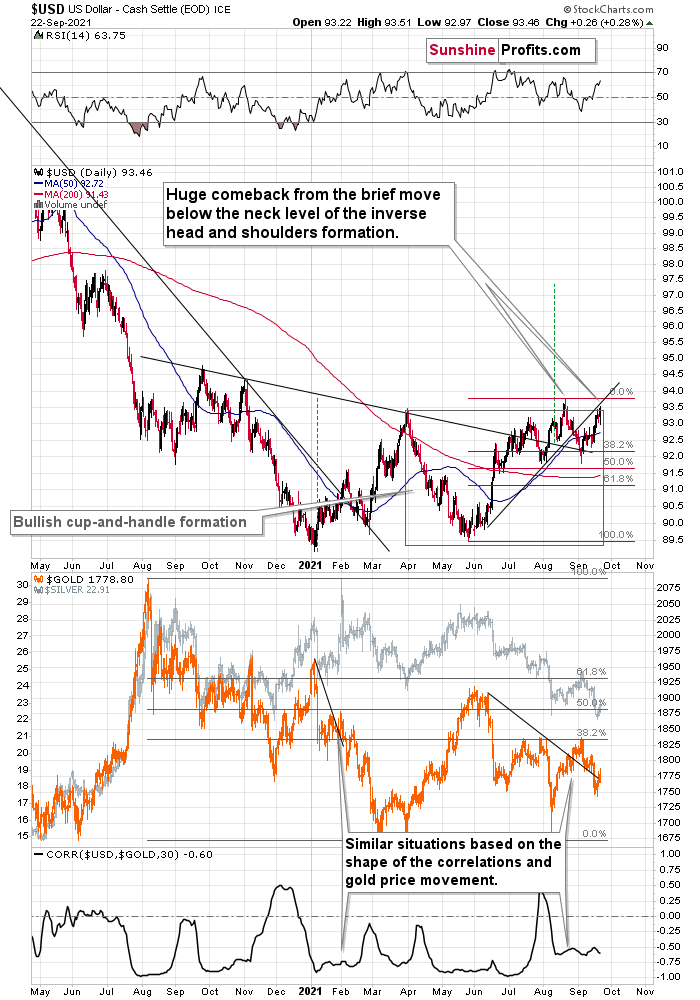
So far, the USD Index is just a bit higher in today’s pre-market trading, but it seems that the next big run-up is at hand.
Why? Because the USDX has been consolidating above the inverse head and shoulders pattern breakout for a long time, and it’s relatively uncommon for the consolidations to take this long — let alone even longer.
And as the USD Index rallies, gold, silver, and mining stocks are likely to decline. Since they are weak even without USD’s help, the upcoming decline in the PMs and miners is likely to be profound.
Thank you for reading our free analysis today. Please note that the above is just a small fraction of the full analyses that our subscribers enjoy on a regular basis. They include multiple premium details such as the interim targets for gold and silver that could be reached in the next few weeks. We invite you to subscribe now and read today’s issue right away.
Sincerely,
Przemyslaw Radomski, CFA
Founder, Editor-in-chief -
Medium-Term Downtrend: Gold Miners in the Lead
September 27, 2021, 9:29 AMGold, silver, and mining stocks don’t need any help from the USDX or the stock market; they can decline all on their own – the miners in particular.
Last week, mining stocks declined quite visibly, and it happened without significant help from the USD Index and from the general stock market. Silver and gold were practically flat week-over-week, so was the USD Index, and the general stock market (S&P 500) was up by 0.51%. This means that gold stocks and silver stocks should have closed the week relatively unchanged (as gold and silver did), or move somewhat higher (similarly to other stocks, as sometimes miners take their lead).
Instead, all important proxies for the mining stocks moved lower and closed the week at new daily and weekly 2021 lows. The HUI Index and the GDX ETF were down by about 3%, the silver stocks (SIL ETF) were down by 3.6%, and the GDXJ ETF (proxy for junior miners) was down by 3.83%, which means that our short position in the latter just became even more profitable.
Most importantly, it means that mining stocks continue to show weakness relative to gold, which tells us that the medium-term downtrend remains well intact. It also tells us that what I wrote previously about the medium-term link between the general stock market and mining stocks was most likely correct. Namely, that miners can decline without a decline in other stocks. A decline in the latter, will (as I still expect to see it sooner or later) simply exacerbate the decline’s volatility.
Let’s take a look at the charts, starting with the long-term HUI Index chart – the flagship proxy for gold stocks.
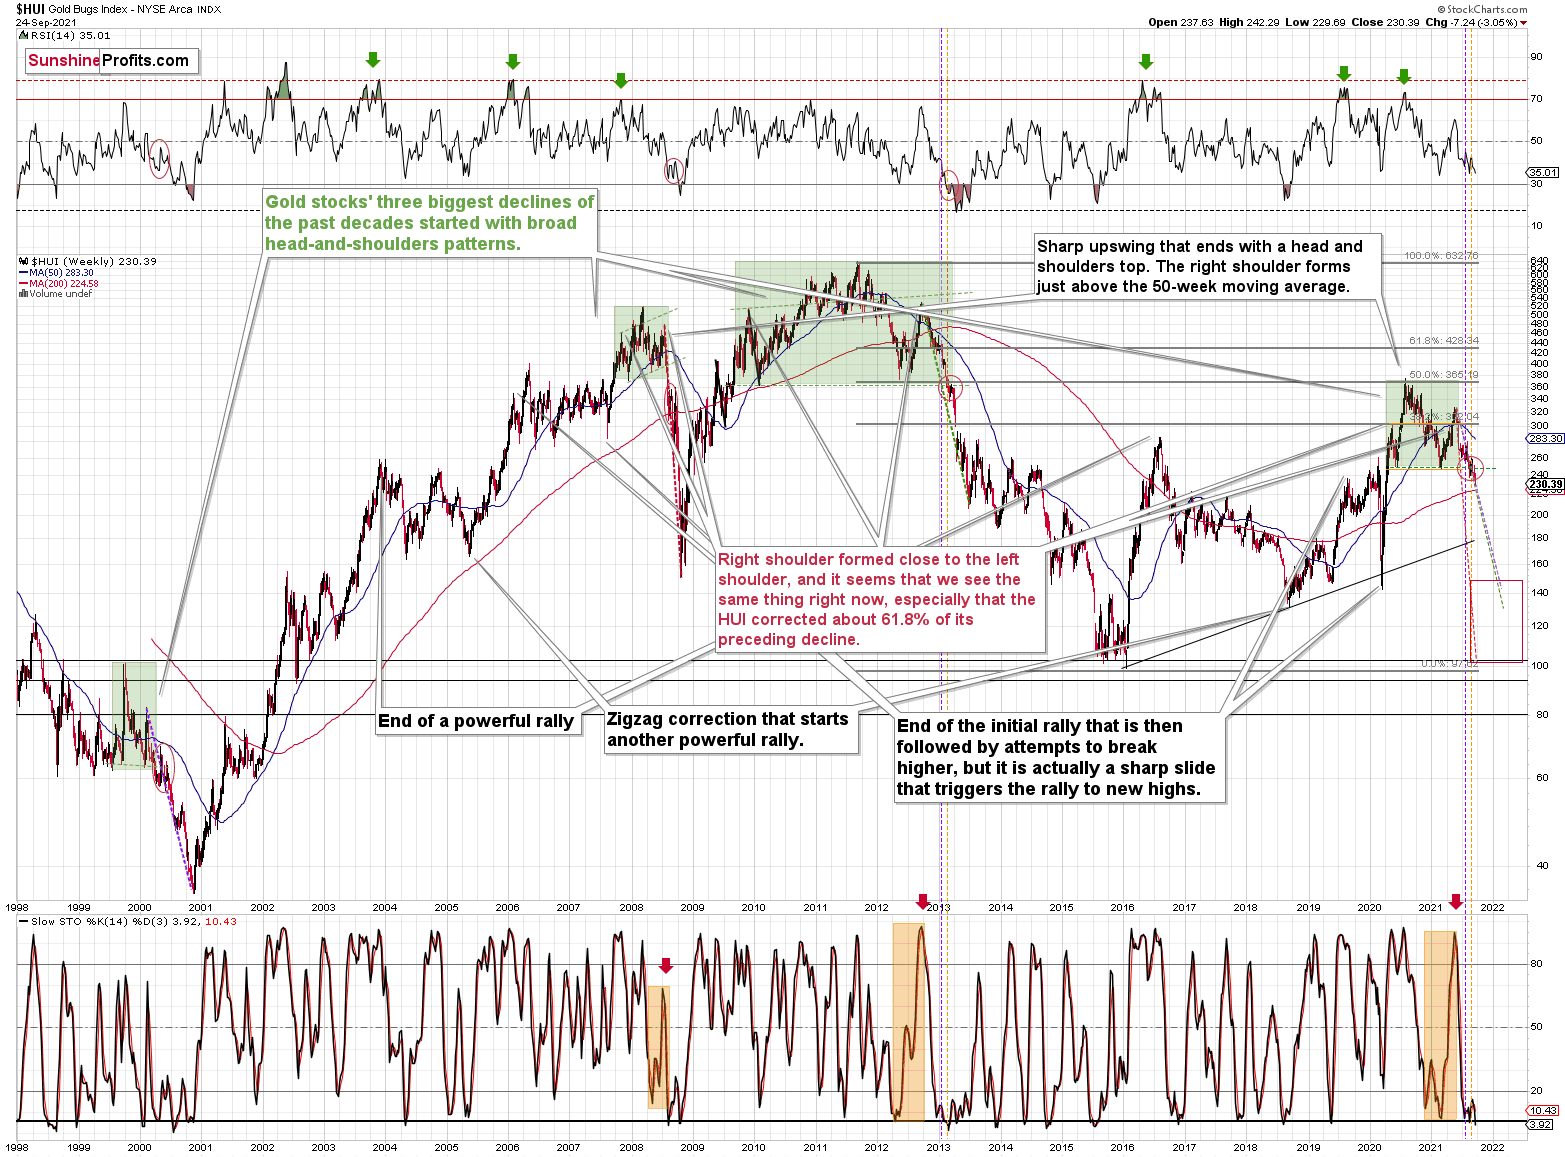
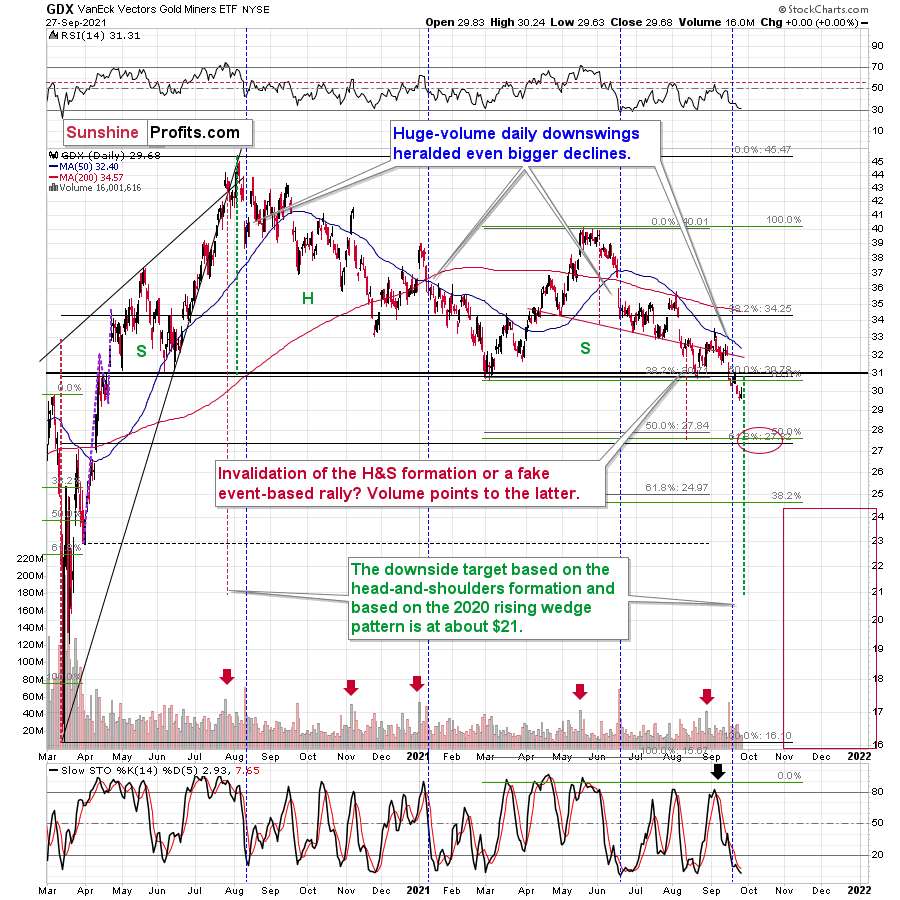
The clearest and most important thing that you can see on this chart is that gold miners continued their decline after completing – and verifying – the breakdown below the broad head and shoulders pattern (marked in green). Just like in the case of the previous similar patterns (also marked in green), mining stocks are likely to now decline profoundly. The 3% decline that we saw last week is likely just a small beginning of the entire slide.
Yes, the Stochastic indicator is very oversold, but please note that it was the same in 2013 during the powerful post-head-and-shoulders-breakdown slide. And it didn’t cause the decline to end or reverse.
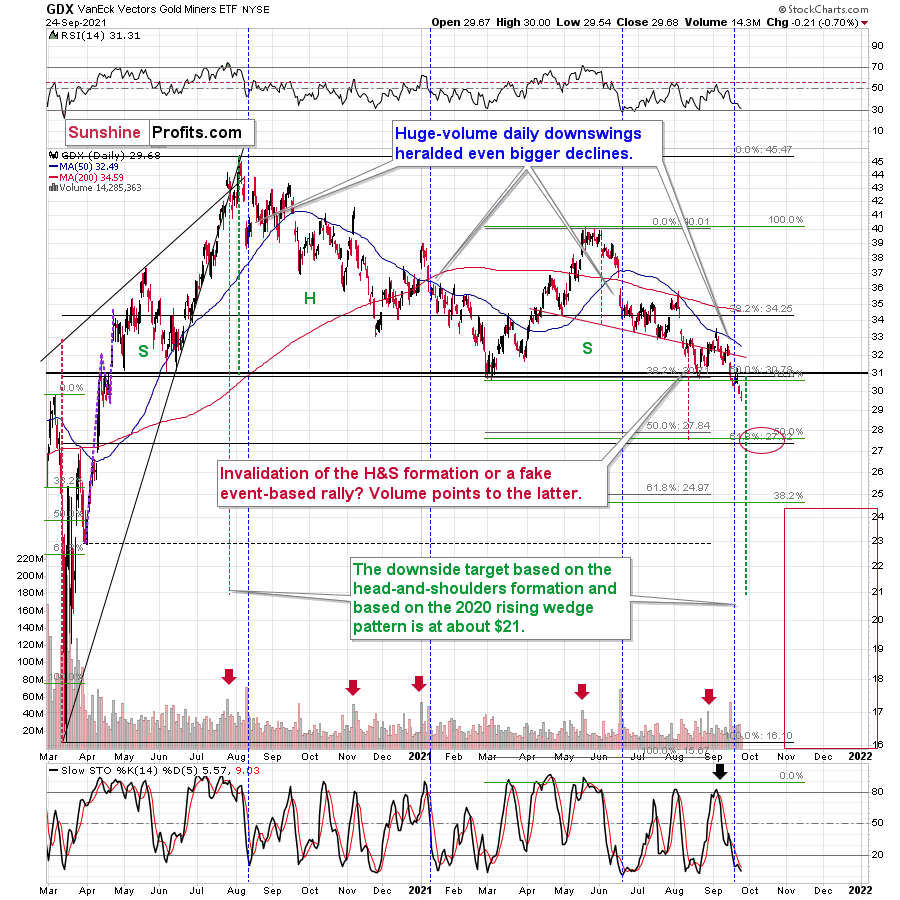
The breakdown to yearly lows is also crystal-clear in case of the GDX ETF. The weekly close below the previous 2021 lows is critical, but it’s worth noting that it was also a close below the psychologically important (as its round) $30 level.
The next target for the GDX ETF is based mainly on the 61.8% Fibonacci retracement level based on the entire 2020 rally. The previous retracements worked quite well, so it seems that this technique shouldn’t be ignored.
The 38.2% retracement served as support in November 2020. The decline below this level triggered a short-term rebound.
The 50% retracement served as support in March and August 2021. This level was particularly strong as it corresponded to the previous – May and June 2020 – lows. Reaching this level triggered rebounds. The first one was quite significant, and the second one was of only short-term importance.
When the GDX ETF moves to its 61.8% it’s likely to rebound in the short term (and probably in the short term only), not only because of the retracement itself, but also because two additional techniques confirm this level as a short-term target. One is the support provided by the late-March 2020 high, and the other is the previous head and shoulders pattern that formed between April and early August 2021. Based on the size of the head (red, dashed lines), GDX is likely to decline to about $28.
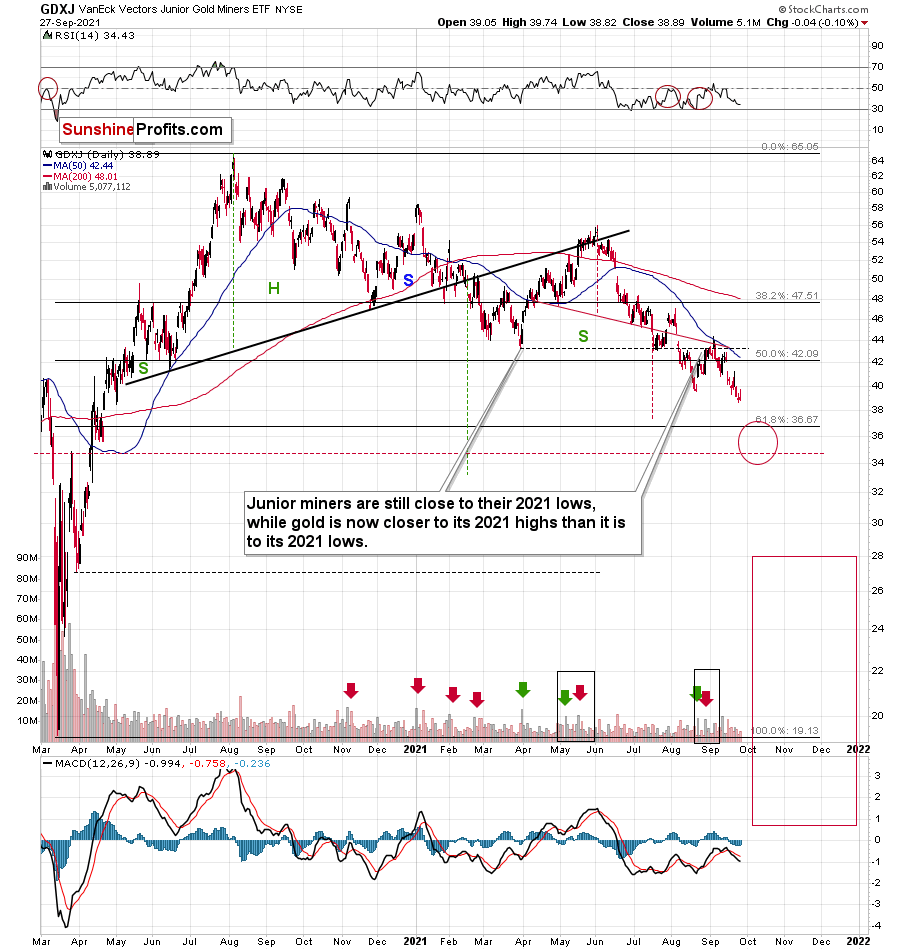
And while the GDX is likely to decline, so is its counterpart focused on junior mining stocks – the GDXJ ETF.

In the case of the GDXJ, the downside target is broader, as the 61.8% Fibonacci retracement, the late-March 2020 high, and the head-and-shoulders-based target are not so aligned.
A decline to the 61.8% Fibonacci retracement here would more or less correspond to the analogous move in the GDX in percentage terms. However, if the junior miners underperform (as they’ve been underperforming seniors for months), they could move even lower before rebounding.
On a different note, let’s take a look at what’s happening in a less popular part of the precious metals sector – palladium.
On Sep. 7, I wrote the following:
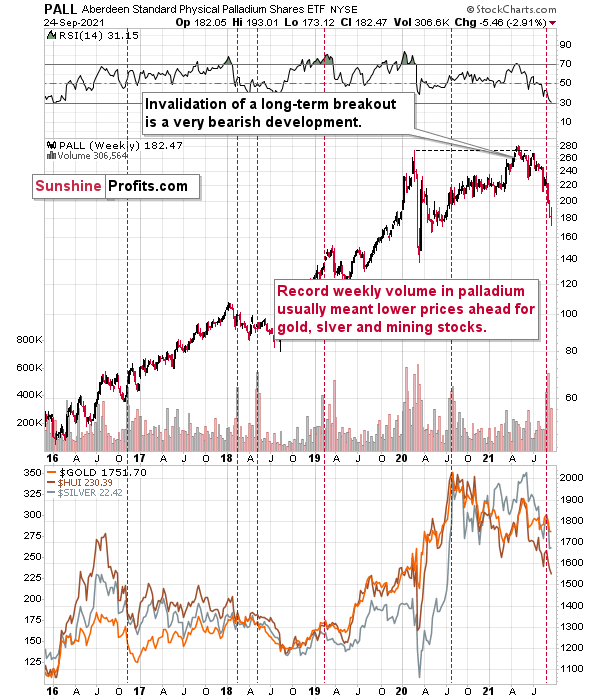
Also adding credibility to the conclusions drawn from the volume spikes in the GDX ETF and the GDXJ ETF, last week, the Aberdeen Standard Physical Palladium Shares (PALL) ETF recorded a new 2021 high for weekly volume. And with abnormal volume offering a window into investor sentiment, historical euphoria preceded minor-to-massive declines in gold and silver (the red vertical dashed lines below). As a result, several areas of the precious metals market are sounding the alarm.
Last week’s volume spike was an anomaly, and whenever we see one on a given market, it’s useful to check what happened when we saw it previously. At times, you can notice some regularities – a pattern. And such a pattern could have important trading implications. That’s the case with palladium volume spikes, which – while rather inconsequential for palladium itself – were practically always followed by lower gold, silver, and mining stock prices. The implications for the said markets for the following weeks are thus bearish.
And indeed, the precious metals sector declined right after that volume spike. So far, the decline was only modest from the long-term point of view. Since some of the declines that followed the previous huge-volume signals from palladium were much bigger (especially the one following the 2020 top), we might see even lower prices of PMs and miners in the next weeks and months as well.
Thank you for reading our free analysis today. Please note that the above is just a small fraction of the full analyses that our subscribers enjoy on a regular basis. They include multiple premium details such as the interim targets for gold and silver that could be reached in the next few weeks. We invite you to subscribe now and read today’s issue right away.
Sincerely,
Przemyslaw Radomski, CFA
Founder, Editor-in-chief -
Gold Bearish Outlook: Everything Falls Into Place
September 24, 2021, 8:15 AMGold plunged, silver declined, and mining stocks closed at new yearly lows. In other words, the bearish trend continues in tune with my warnings.
Let’s start today’s analysis with what I wrote about the USD Index yesterday:
The USD Index moved higher yesterday, and the precious metals sector didn’t decline, which might be viewed as a sign of strength of the latter, but I don’t see it in this way. Why? Because yesterday’s session was an exception from the rule due to the importance of the news that accompanied it – the Fed’s decisions and comments. These days tend to be rich in sudden price swings in all directions, as investors and traders try to guess what the news is going to be, and then they are unsure how to react to the news when it finally hits the market. Consequently, yesterday’s lack of declines in the PMs is not a sign of their strength – it was likely a more-or-less random kind of reaction. If we see more of that, the implications might change, but that’s not the case right now.
However, instead of a bullish confirmation, we saw a gargantuan bearish confirmation.
The USD Index declined by 0.43 and gold – instead of rallying, which would have been normal – declined by almost $30. Moreover, by declining that much, it once again moved below the declining support/resistance line, telling us that the previous breakdown was not accidental.
Gold closed the day at new monthly lows, but still relatively far from its previous 2021 lows. Don’t worry – it’s very likely to get there, and the back-and-forth type of decline is nothing bullish. In fact, it makes the current situation even more similar to what we saw in 2013.
What Did We See?
Between September 2012 and February 2013, gold declined in a back-and-forth manner as well, and the current situation seems to be analogous to what we saw in February 2013. At the time, the final short-term upswing took gold to its 50-day moving average (marked with blue), and we saw something very similar recently. The recent high ($1788.40) was very close to gold’s 50-day moving average too – less than $10 from it.
You can see the comparison even more clearly in the video that I posted on Wednesday (Sep. 22) – on a side note, I was recording this when gold was moving higher, right to its Sep. 22 top. So, it turns out that I said that gold might top close to its 50-day moving average instead of rallying higher, right before exactly that happened.
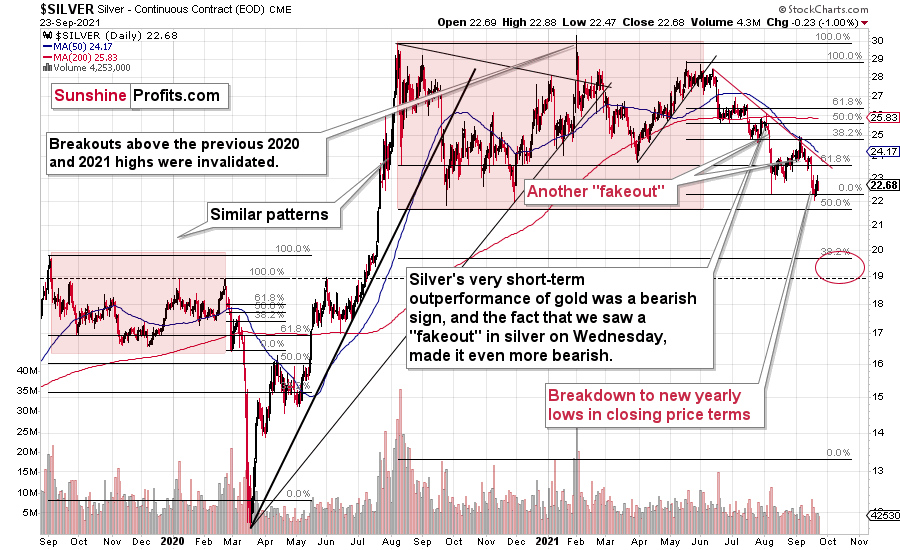
Silver didn’t decline to new yearly lows, but that’s not as important as the fact that it was unable to get back above the previous yearly lows. Consequently, the outlook for silver remains bearish even without considering all the other (non-silver-price-based) factors.
Gold Stocks
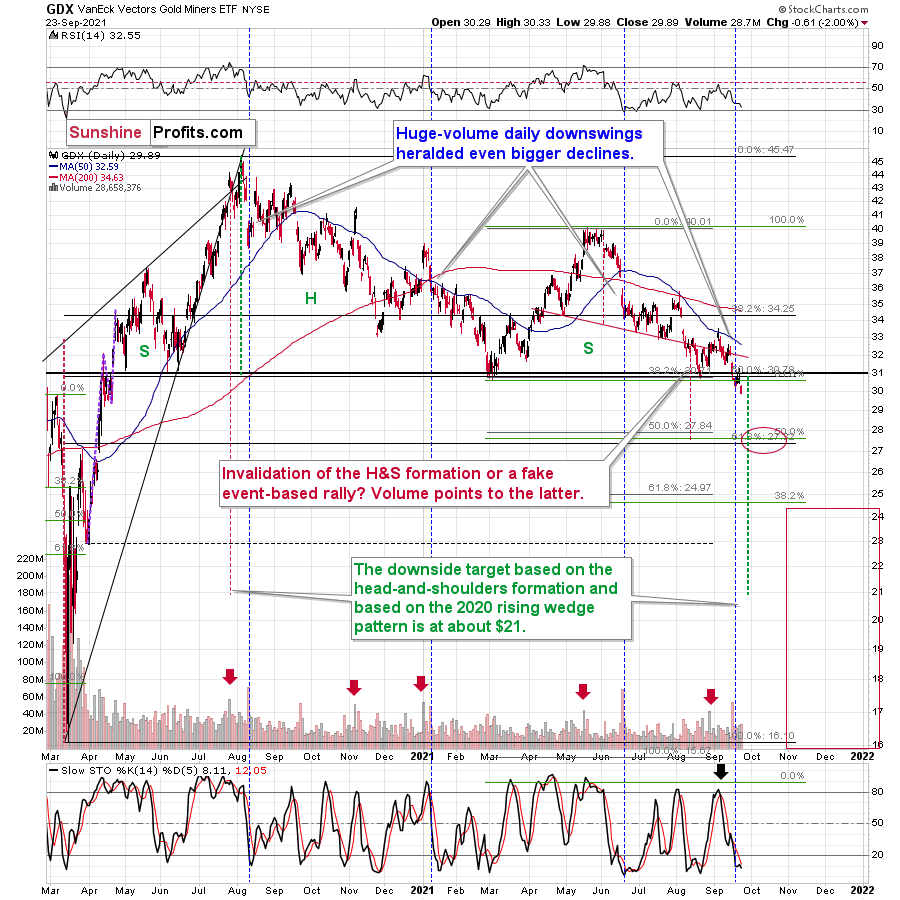
Gold stocks – the GDX ETF – closed at new 2021 lows, and it happened shortly after the ETF confirmed the breakdown below its March and August 2021 lows. That’s exactly what was likely to happen, and that’s exactly what one would expect as the first step of a bigger decline.
My previous downside target of ~$28 for the GDX ETF remains up-to-date (in fact, GDX might bottom a bit below that). Naturally, that’s just a temporary downside target after which we might see a breather and then another, even bigger slide.
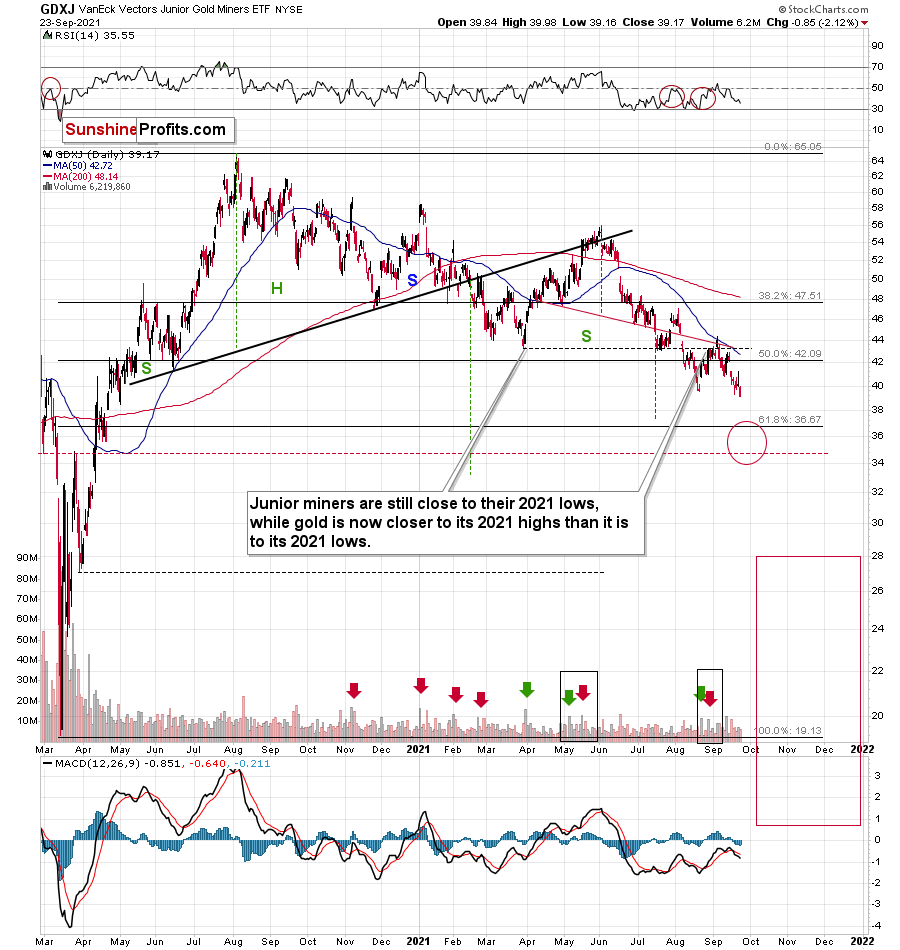
Junior mining stocks broke and closed at new 2021 lows too. The outlook for both (senior and junior miners) is clearly bearish.
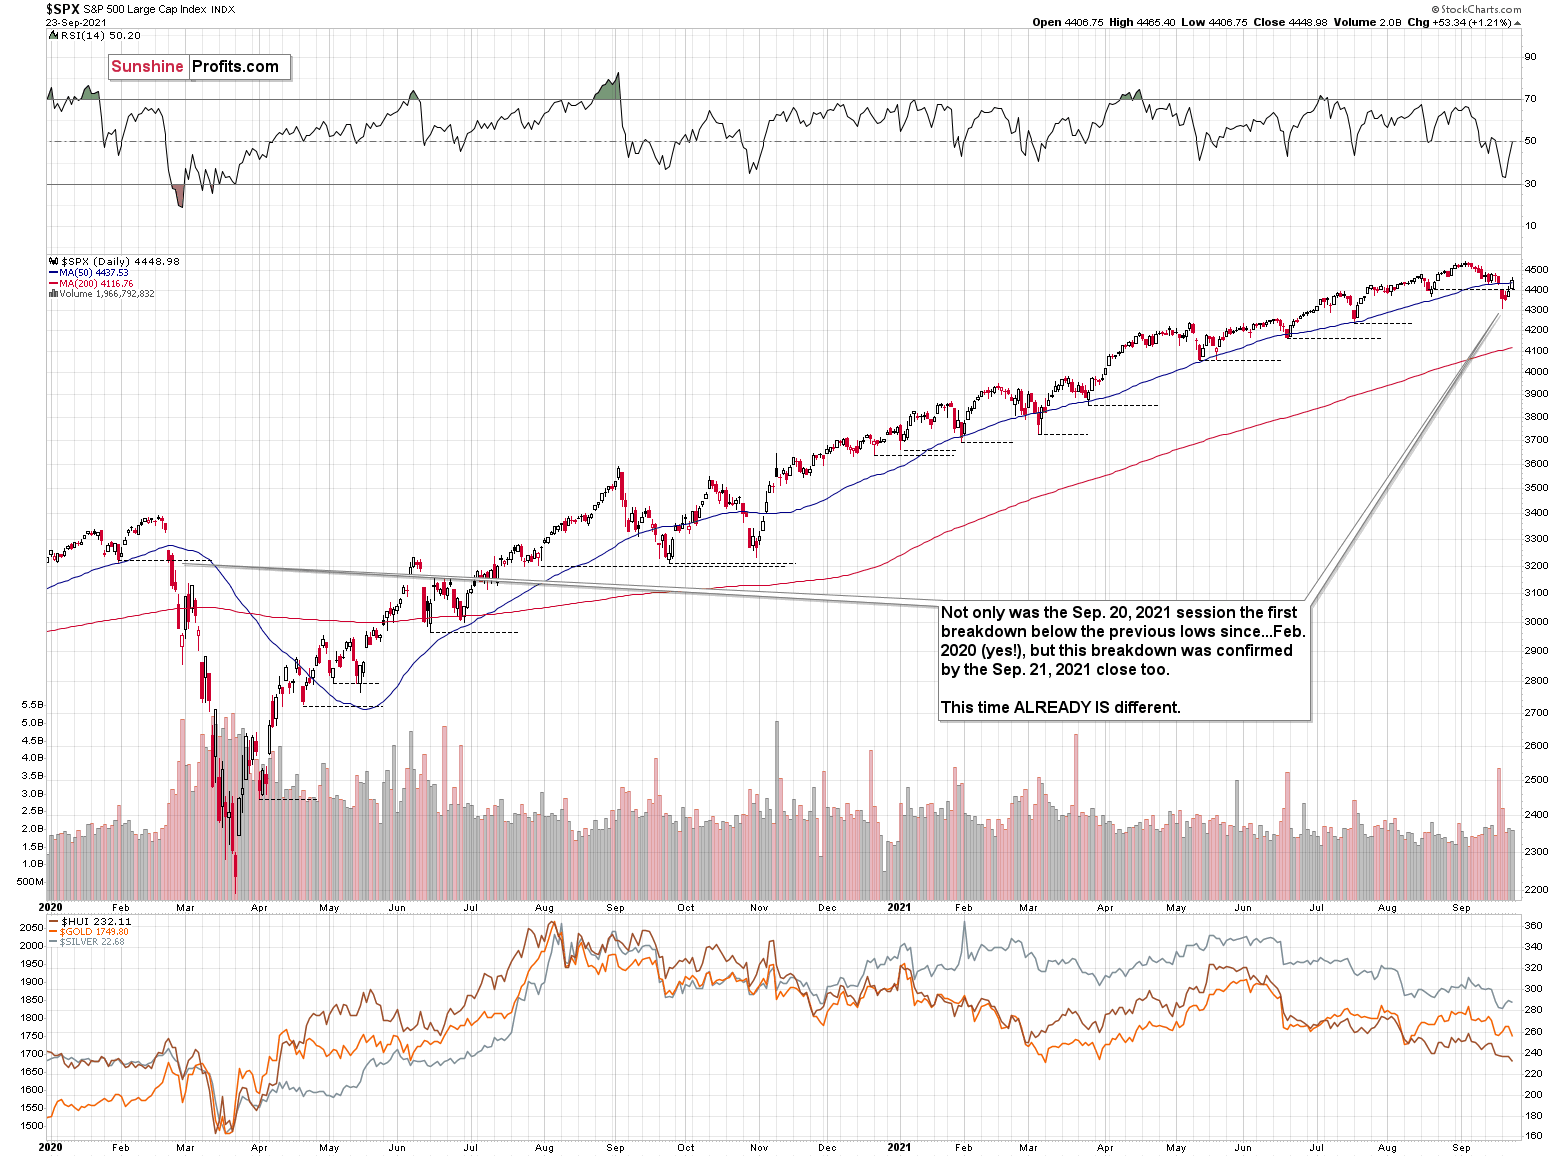
The stock market invalidated the breakdown below the previous lows, so the technical situation here improved. Nonetheless, due to two closes below the previous lows, the situation is already different than it was before. Perhaps stocks are forming a head and shoulders pattern here, but it’s too early to say so with certainty.
What is certain, however, is that a decline in stocks is not necessary for the precious metals sector (including miners) to decline – they did exactly that yesterday.
Summing up, the outlook for the next few months for the precious metals sector remains very bearish, and it seems that the profits on our short position in the junior mining stocks (already substantial) will become even bigger in the future.
Thank you for reading our free analysis today. Please note that the above is just a small fraction of the full analyses that our subscribers enjoy on a regular basis. They include multiple premium details such as the interim targets for gold and mining stocks that could be reached in the next few weeks. We invite you to subscribe now and read today’s issue right away.
Sincerely,
Przemyslaw Radomski, CFA
Founder, Editor-in-chief -
Yup, Everything Is Still Bearish
September 23, 2021, 9:44 AMThe Fed has decided, and the Fed has spoken. And the markets reacted in tune with their previous trends. In other words, the bearish outlook for the PMs remains very much intact.
Here’s the key chart for us, in light of the profitable short position in the miners that we have. While our short position is in the junior miners, it is the GDX ETF that is more important, as its actions are observed by more market participants.
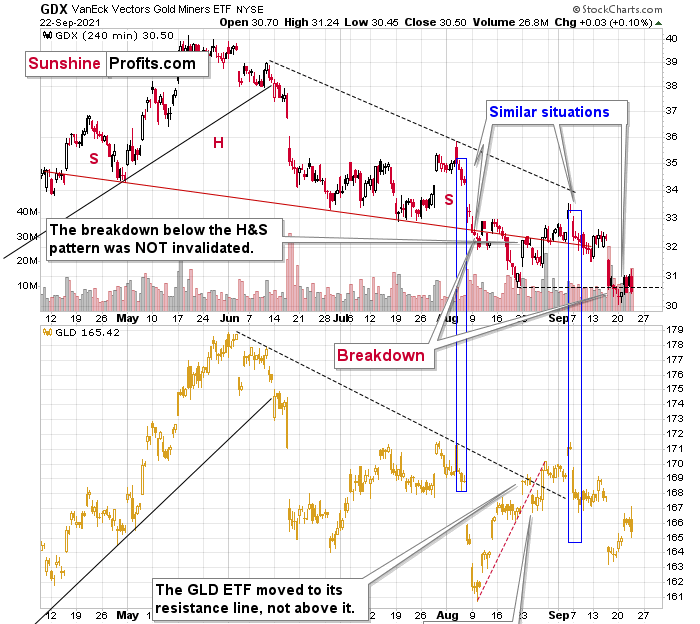
The GDX ETF confirmed the breakdown to new 2021 lows, and it did so after trying to rally. This makes the most recent price action even more similar to what we saw in mid-August after the previous breakdown.
The situation was already extremely bearish previously, but it’s getting ridiculously bearish now.
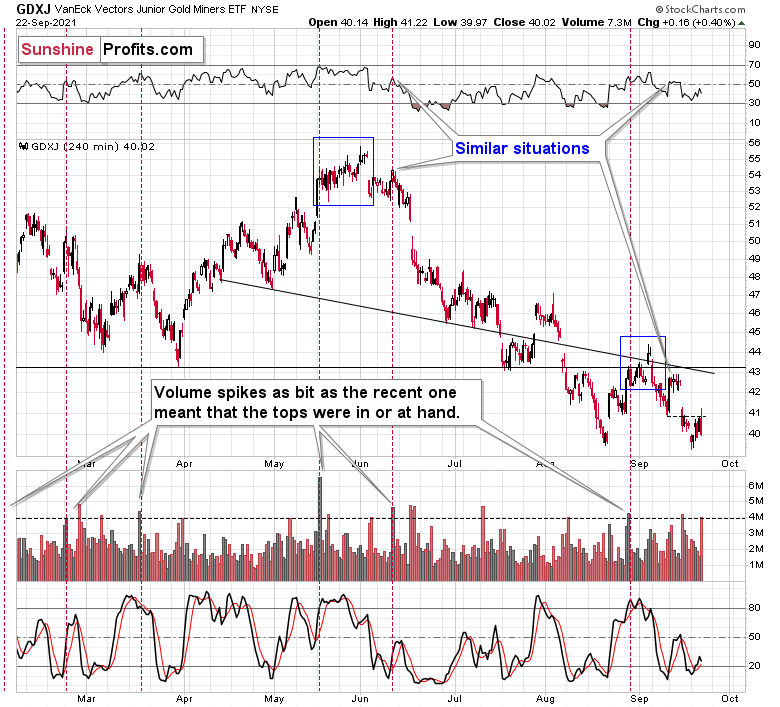
The GDXJ ETF also continued to move back and for the below the previous September lows. Despite the intraday attempt to move higher, it ended the session mere $0.16 higher.
So, nothing really changed – the outlook for the miners remains clearly bearish.
Gold ended yesterday’s session relatively unchanged, so practically everything that I described in yesterday’s video commentary remains up-to-date. If you haven’t had the chance to watch it so far, I encourage you to do so today, tomorrow, or over the weekend.
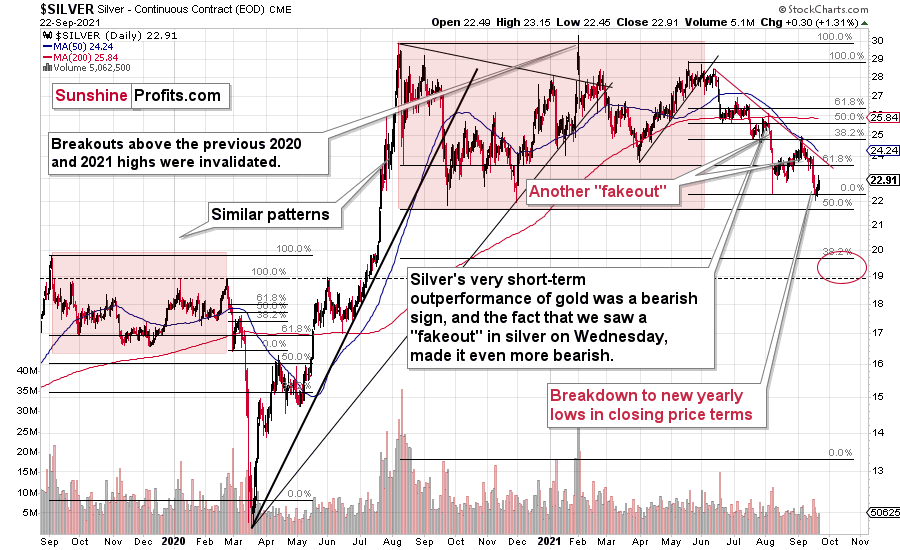
Despite yesterday’s $0.30 rally, silver didn’t invalidate its previous breakdown to new yearly lows, so the outlook remains clearly bearish also from this point of view.
The USD Index moved higher yesterday, and the precious metals sector didn’t decline, which might be viewed as a sign of strength of the latter, but I don’t see it in this way. Why? Because yesterday’s session was an exception from the rule due to the importance of the news that accompanied it – Fed’s decisions and comments. These days tend to be rich in sudden price swings in all directions as investors and traders try to guess what the news is going to be and then they are unsure how to react to the news when it finally hits the market. Consequently, yesterday’s lack of declines in the PMs is not a sign of their strength – it was likely a more-or-less random kind of reaction. If we see more of that, the implications might change, but that’s not the case right now.
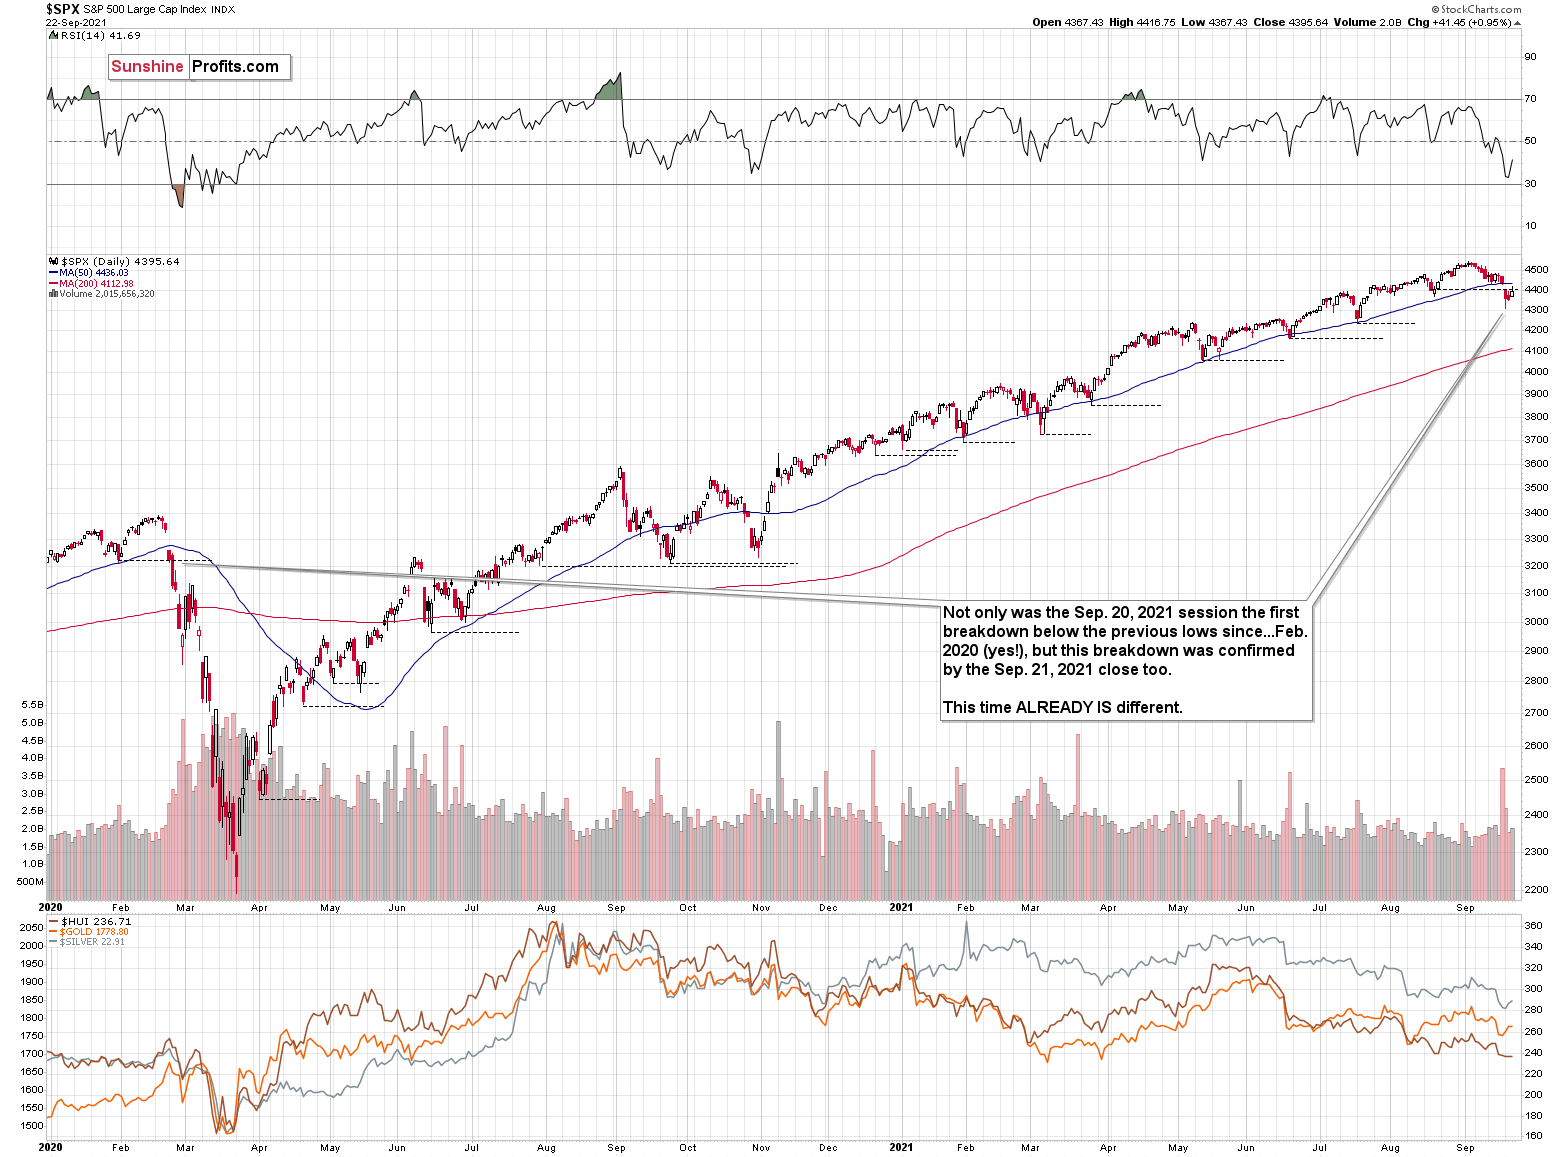
Finally, while the S&P 500 moved above the mid-August lows in intraday terms, please note that yesterday was the third consecutive close below the mid-August bottom in closing price terms. This means that from this point of view, the breakdown was confirmed. The S&P 500 futures are higher in today’s pre-market trading, but they are just a few index points above the mid-August lows (closing prices), so it’s too early to say that the breakdown was invalidated – we would need to see a close above those lows (4,400.27) to say that
Summing up, the outlook for the next few months for the precious metals sector remains very bearish.
Thank you for reading our free analysis today. Please note that the above is just a small fraction of the full analyses that our subscribers enjoy on a regular basis. They include multiple premium details such as the interim targets for gold and mining stocks that could be reached in the next few weeks. We invite you to subscribe now and read today’s issue right away.
Sincerely,
Przemyslaw Radomski, CFA
Founder, Editor-in-chief -
How Do You Get Inflation Under Control?
September 22, 2021, 9:33 AMRaise the dollar, drop the metals. Under most possible scenarios, things don’t look good for gold, silver, and mining stocks – for the medium-term.
With the USD Index and U.S. Treasury yields the main fundamental drivers of the PMs’ performance, some confusion has arisen due to their parallel and divergent moves. For example, sometimes the USD Index rises while U.S. Treasury yields fall, or vice-versa, and sometimes the pair move higher/lower in unison. However, it’s important to remember that different economic environments have different impacts on the USD Index and U.S. Treasury yields.
To explain, the USD Index benefits from both the safe-haven bid (stock market volatility) and economic outperformance relative to its FX peers. Conversely, U.S. Treasury yields only benefit from the latter. Thus, when economic risks intensify (like what we witnessed with Evergrande on Sep. 20), the USD Index often rallies while U.S. Treasury yields often fall. Thus, the economic climate is often the fundamental determinant of the pairs’ future paths.
For context, I wrote on Apr.16:
The PMs suffer during three of four possible scenarios:
- When the bond market and the stock market price in risk, it’s bearish for the PMs
- When the bond market and the stock market don’t price in risk, it’s bearish for the PMs
- When the bond market doesn’t price in risk, but the stock market does, it’s bearish for the PMs
- When the bond market prices in risk and the stock market doesn’t, it’s bullish for the PMs
Regarding scenario #1, when the bond market and the stock market price in risk (economic stress), the USD Index often rallies and its strong negative correlation with the PMs upends their performance. Regarding scenario #2, when the bond market and the stock market don’t price in risk, U.S. economic strength supports a stronger U.S. dollar and rising U.S, Treasury yields reduce the fundamental attractiveness of gold. For context, the PMs are non-yielding assets, and when interest rates rise, bonds become more attractive relative to gold (for some investors). Regarding scenario #3, when the stock market suffers and U.S. Treasury yields are indifferent, the usual uptick in the USD Index is a bearish development for the PMs (for the same reasons outlined in scenario #1). Regarding scenario #4, when the bond market prices in risk (lower yields) and the stock market doesn’t, inflation-adjusted (real) interest rates often decline, and risk-on sentiment can hurt the USD Index. As a result, the cocktail often uplifts the PMs due to lower real interest rates and a weaker U.S. dollar.
The bottom line? The USD Index and U.S. Treasury yields can move in the same direction or forge different paths. However, while a stock market crash is likely the most bearish fundamental outcome that could confront the PMs, scenario #2 is next in line. While it may (or may not) seem counterintuitive, a strong U.S. economy is bearish for the PMs. When U.S. economic strength provides a fundamental thesis for both the USD Index and U.S. Treasury yields to rise (along with real interest rates), the double-edged sword often leaves gold and silver with deep lacerations.
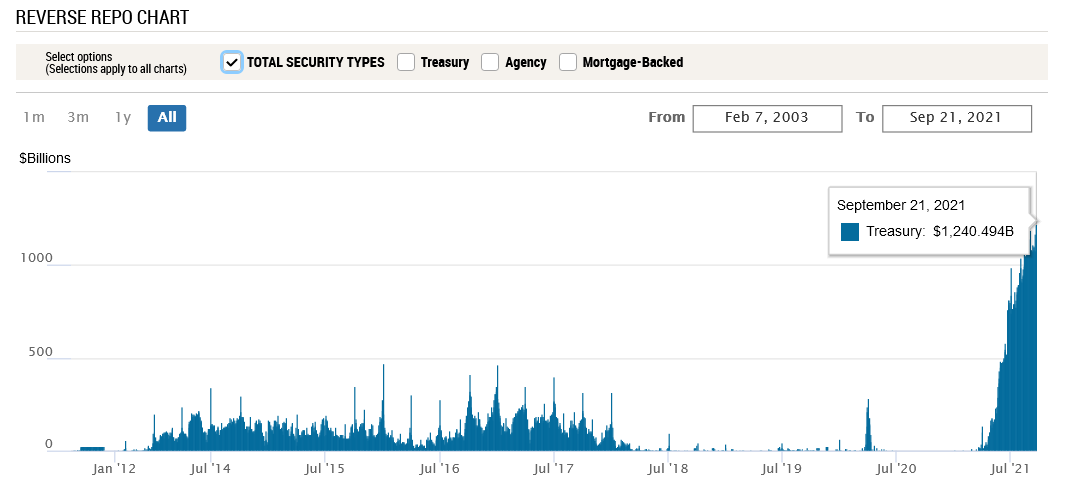
In the meantime, though, with investors eagerly awaiting the Fed’s monetary policy decision today, QE is already dying a slow death. Case in point: not only has the USD Index recaptured 93 and surged above the neckline of its inverse (bullish) head & shoulders pattern, but the greenback’s fundamentals remain robust. With 78 counterparties draining more than $1.240 trillion out of the U.S. financial system on Sep. 21, the Fed’s daily reverse repurchase agreements hit another all-time high.
Please see below:
 Source: New York Fed
To explain, a reverse repurchase agreement (repo) occurs when an institution offloads cash to the Fed in exchange for a Treasury security (on an overnight or short-term basis). And with U.S. financial institutions currently flooded with excess liquidity, they’re shipping cash to the Fed at an alarming rate. And while I’ve been warning for months that the activity is the fundamental equivalent of a taper – due to the lower supply of U.S. dollars (which is bullish for the USD Index) – the psychological effect is not the same. However, as we await a formal taper announcement from the Fed, the U.S. dollar’s fundamental foundation remains quite strong.
Furthermore, with the Wall Street Journal (WSJ) publishing a rather cryptic article on Sep. 10 titled “Fed Officials Prepare for November Reduction in Bond Buying,” messaging from the central bank’s unofficial mouthpiece implies that something is brewing. And while the Delta variant and Evergrande provide the Fed with an excuse to elongate its taper timeline, surging inflation has the Fed increasingly handcuffed.
As a result, Goldman Sachs Chief U.S. Economist David Mericle expects the Fed to provide “advance notice” today and set the stage for an official taper announcement in November. He wrote:
“While the start date now appears set, the pace of tapering is an open question. Our standing forecast is that the FOMC will taper at a pace of $15bn per meeting, split between $10bn in UST and $5bn in MBS, ending in September 2022. But a number of FOMC participants have called instead for a faster pace that would end by mid-2022, and we now see $15bn per meeting vs. $15bn per month as a close call.”
On top of that, with stagflation bubbling beneath the surface, another hawkish shift could materialize.
To explain, I wrote on Jun. 17:
On Apr. 30, I warned that Jerome Powell, Chairman of the U.S. Federal Reserve (Fed), was materially behind the inflation curve.
I wrote:
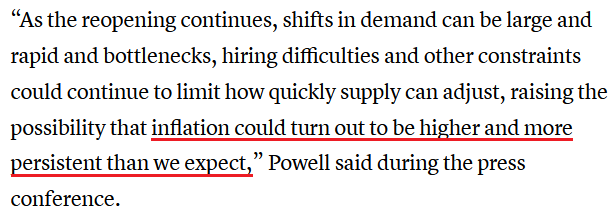
With Powell changing his tune from not seeing any “unwelcome” inflation on Jan. 14 to “we are likely to see upward pressure on prices, but [it] will be temporary” on Apr. 28, can you guess where this story is headed next?
And with the Fed Chair revealing on Jun. 16 what many of us already knew, he conceded:
 Source: CNBC
Moreover, while Powell added that “our expectation is these high inflation readings now will abate,” he also conceded that “you can think of this meeting that we had as the ‘talking about talking about’ [tapering] meeting, if you’d like.”
However, because actions speak louder than words, notice the monumental shift below?
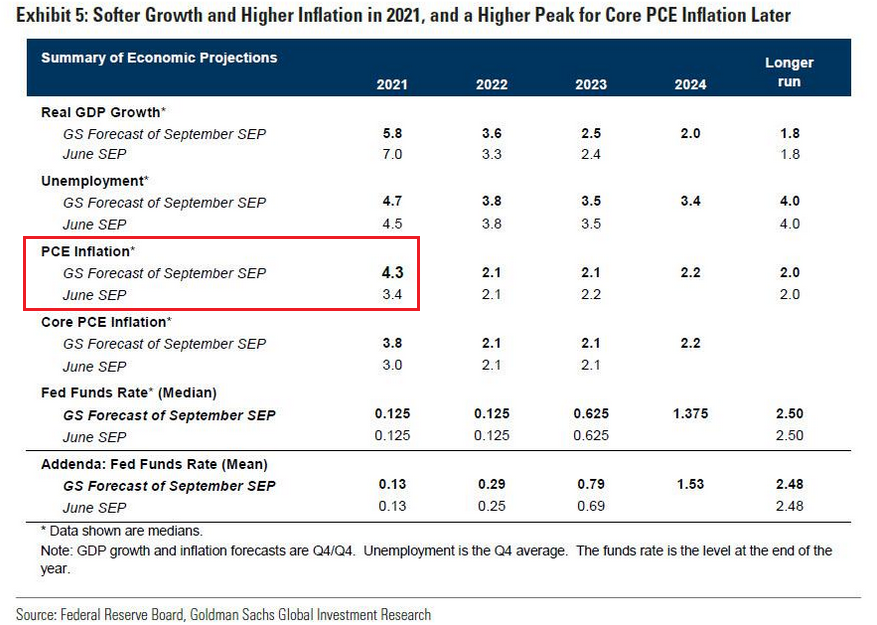
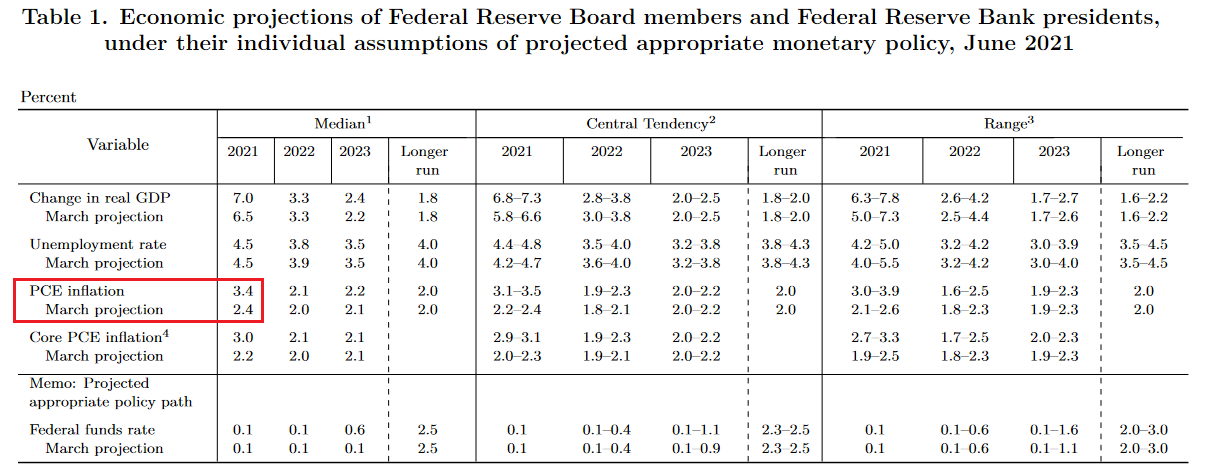 Source: U.S. Fed
To explain, if you analyze the red box, you can see that the Fed increased its 2021 Personal Consumption Expenditures (PCE) Index projection from a 2.4% year-over-year (YoY) rise to a 3.4% YoY rise. But even more revealing, the original projection was made only three months ago. Thus, the about face screams of inflationary anxiety.
What’s more, I highlighted on Aug. 5 that the hawkish upward revision increased investors’ fears of a faster rate-hike cycle and contributed to the rise in the USD Index and the fall in the GDXJ ETF (our short position).
Please see below:
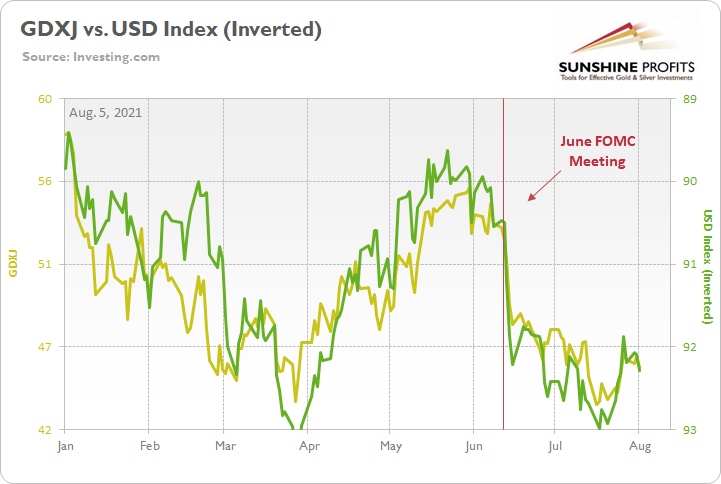
And why is all of this so important? Well, with Mericle expecting the Fed to increase its 2021 PCE Index projection from 3.4% to 4.3% today (the red box below), if the Fed’s message shifts from we’re adamant that inflation is “transitory” to “suddenly, we’re not so sure,” a re-enactment of the June FOMC meeting could uplift the USD Index and upend the PMs once again. For context, the FOMC’s July meeting did not include a summary of its economic projections and today’s ‘dot plot’ will provide the most important clues.
Please see below:
Finally, with CNBC proclaiming on Sep. 21 that the Fed is “widely expected to indicate it is getting ready to announce it will start paring back its $120 billion in monthly purchases of Treasuries and mortgage-backed securities,” even the financial media expects some form of “advance notice.”
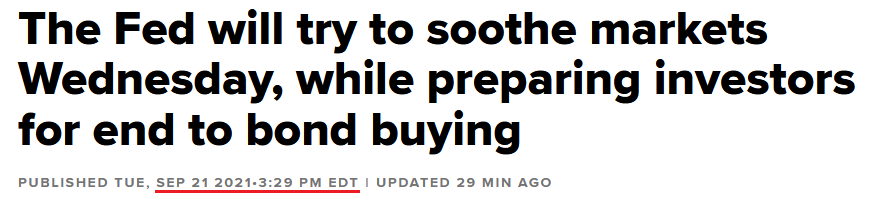 Source: CNBC
The bottom line? While the Delta variant and Evergrande have provided the Fed with dovish cover, neither addresses the underlying problem. With inflation surging and the Fed’s 2% annual target looking more and more like wishful thinking, reducing its bond-buying program, increasing the value of the U.S. dollar, and decreasing commodity prices is the only way to get inflation under control. In absence, the Producer Price Index (PPI) will likely continue its upward momentum and the cost-push inflationary spiral will likely continue as well.
In conclusion, the gold miners underperformed gold once again on Sep. 21 and the relative weakness is profoundly bearish. Moreover, while the USD Index was roughly flat, Treasury yields rallied across the curve. And while Powell will do his best to thread the dovish needle today, he’s stuck between a rock and a hard place: if he talks down the U.S. dollar (like he normally does), commodity prices will likely rise, and inflation will likely remain elevated. If he acknowledges reality and prioritizes controlling inflation, the U.S. dollar will likely surge, and the general stock market should suffer. As a result, with the conundrum poised to come to a head over the next few months (maybe even today), the PMs are caught in the crossfire and lower lows will likely materialize over the medium term.
Thank you for reading our free analysis today. Please note that the above is just a small fraction of the full analyses that our subscribers enjoy on a regular basis. They include multiple premium details such as the interim targets for gold and mining stocks that could be reached in the next few weeks. We invite you to subscribe now and read today’s issue right away.
Sincerely,
Przemyslaw Radomski, CFA
Founder, Editor-in-chief


Gold Investment News
Delivered To Your Inbox
Free Of Charge
Bonus: A week of free access to Gold & Silver StockPickers.
Gold Alerts
More-
Status
New 2024 Lows in Miners, New Highs in The USD Index
January 17, 2024, 12:19 PM -
Status
Soaring USD is SO Unsurprising – And SO Full of Implications
January 16, 2024, 8:40 AM -
Status
Rare Opportunity in Rare Earth Minerals?
January 15, 2024, 2:06 PM

