
tools spotlight

-
What I Have Learned after a Decade in the Gold Market
November 30, 2022, 5:39 PMThe gold market is very complicated, but I can offer you some tips on how to navigate through it.
The fall is the season of dying. Thus, it’s probably the best time to give up certain activities, prepare for winter (it’s coming!) and later re-birth. Hence, this is the last Gold Market Overview that I’m writing. Perhaps I’m not leaving the gold market completely, but I won’t be writing about it in this format. I am sharing here with you what I’ve learned in nearly a decade of writing about the yellow metal.
- The gold market is complicated. Gold can’t be valued like stocks or bonds because it doesn’t pay dividends or interest. It’s also neither a standard currency nor a normal commodity. Thus, simple models that focus on annual mining production or jewelry demand don’t work. Macroeconomic factors play an important role, but emotions and narratives are also important. The well-established correlations can suddenly break down, at least for a while. Hence, if someone claims that the gold market is simple and that he or she has created an elegant model for determining the price of gold, don’t trust such a person.
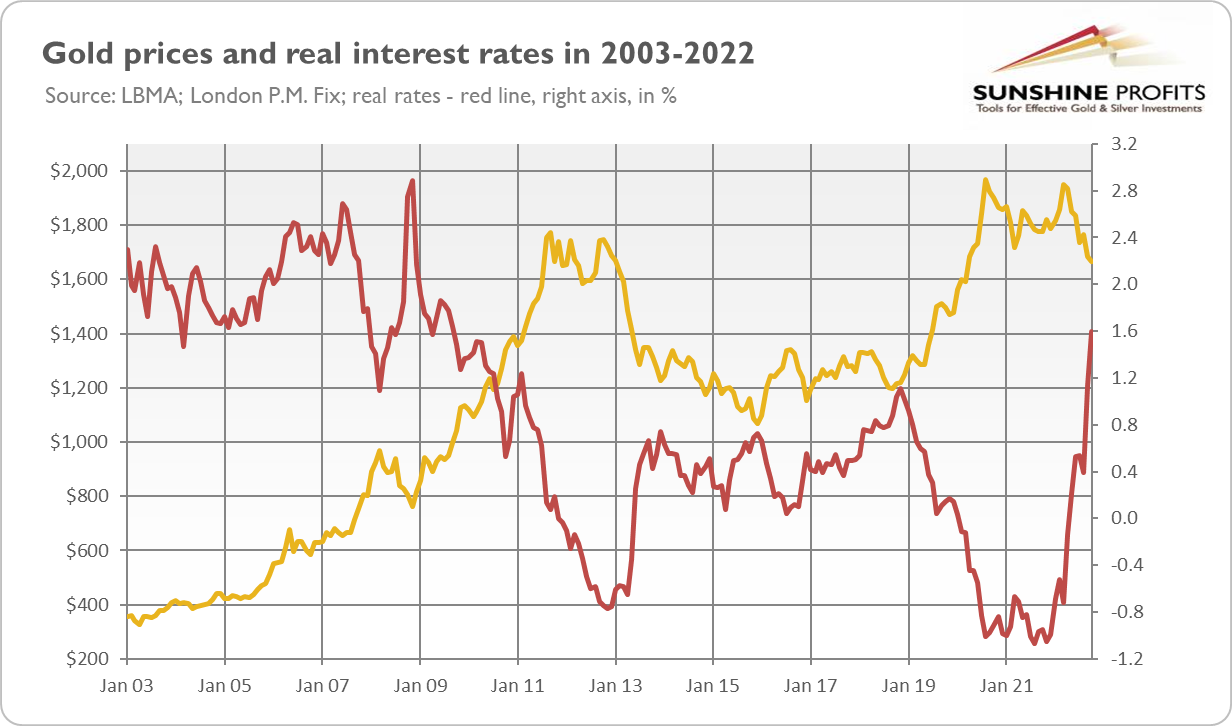
- The key fundamental factors in the gold market are real interest rates. As one can see below, these two variables appear on the chart as their mirror images. When real rates go down, gold rallies, and vice versa. However, this negative correlation changes its strength (for example, gold should plunge much more right now, given the surge in real rates), and sometimes causes even breakdowns (as it the case in 2005-2006).
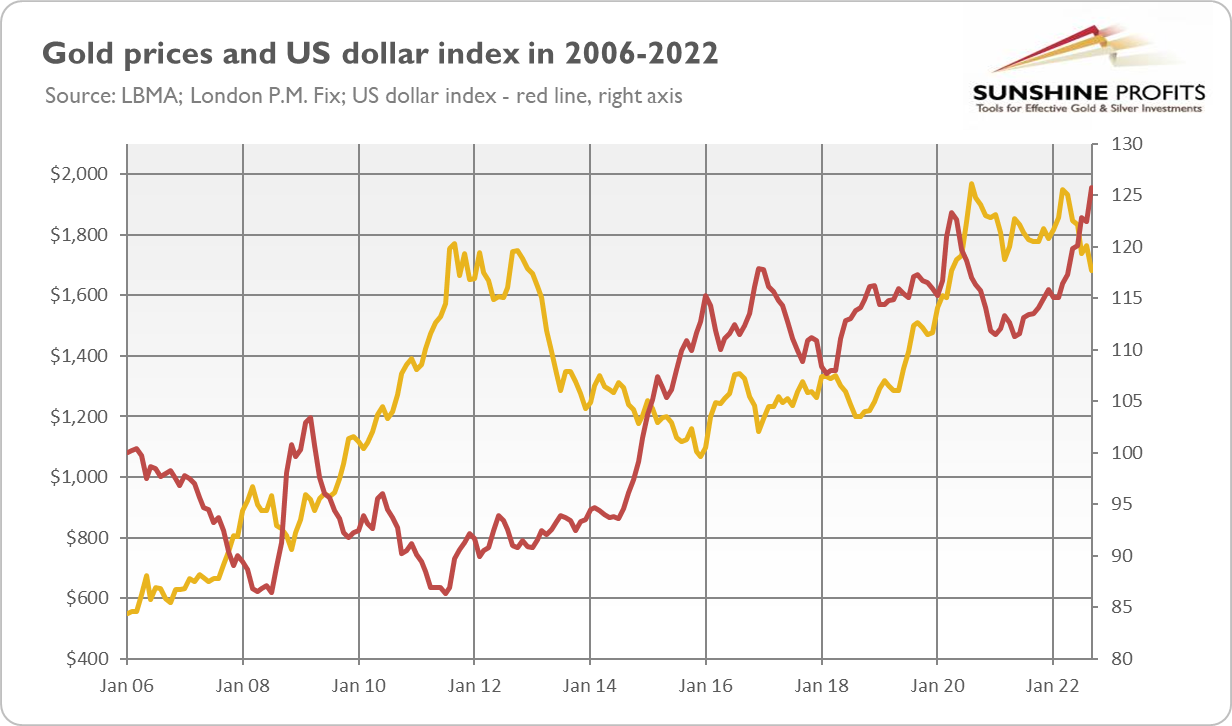
- Another significant driver of gold prices is the US dollar, whose strength is also negatively correlated with the price of the yellow metal, as the chart below shows. However, this relationship has a more fickle nature, as sometimes these two assets move in tandem.
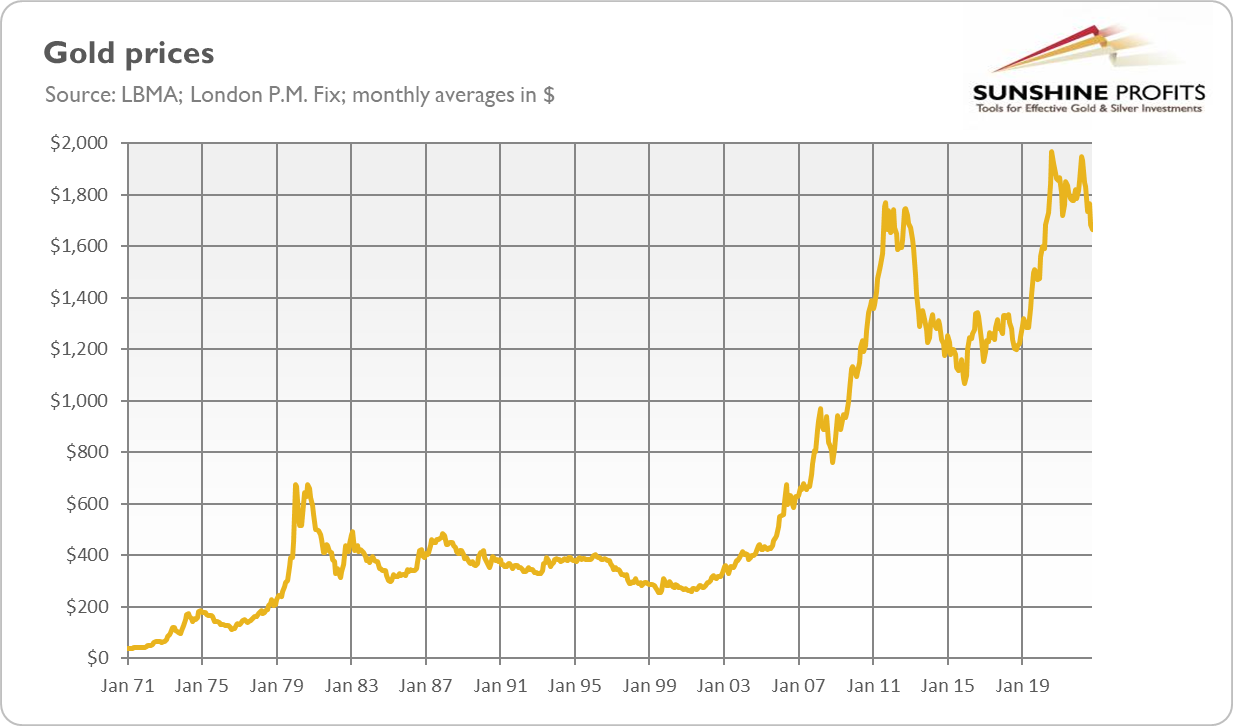
- In the long run, gold prices tend to go up. Since 1971, the price of the yellow metal has surged by about 4300%, or 17.5% annually (geometric rate or return). In real terms, gold gained “only” slightly above 490% in the past half century, or 13% annually (geometric rate of return). Given the constant loss of the dollar’s purchasing power and the inherent instability of the monetary system based on fiat money, gold should be worth more in the next several dozen years.
- However, please note that gold is not a perfect inflation hedge. Not only did gold enter a long-term bear market in the 1980s and 1990s, when inflation rates were still positive (although declining), but it has also struggled in 2021-2022, when inflation has accelerated to about 9%.
- More generally speaking, don’t play other people’s games. What I mean here is that you should distinguish between long-term investing and short-term speculation. If you trade gold on a short-term basis, the fact that it tends to go up over longer horizons is of no help to you. As Lord Keynes famously said, “the market can remain irrational longer than you can remain solvent.” Similarly, if your strategy is to buy and hold, don’t worry about the daily hustle and bustle in the marketplace.
- Don’t be attached to your opinions. The greatest mistakes occur when investors believe that they are right and markets are wrong, or when they believe that gold should be rising or declining, even though the opposite has been happening for a long time. Gold is not obliged to do what you think it should do, it does what it does, it moves the way it moves. You can either accept it or take offense at the markets. The idea that markets are wrong can help you keep your self-esteem high and not admit your mistake, but it won’t help you make money.
- Remember that gold evokes strong emotions and that many analysts and market participants have strong opinions about it (sometimes ideologically biased), which are not always correct. Gold is neither a barbarous relic nor an asset whose price should always go up (and if it’s not happening, it must prove a manipulation). Pessimistic opinions are more widespread in the financial markets, as we’re evolutionary adapted to absorb bad news, but they’re especially loud in the gold market because fear mongers can sell more gold that way.
- Most of the gold market analyses are simply bullshit, especially the press coverage. The journalists are tempted to “explain” all moves in the gold market by some cause, even if they remain within the normal range of market fluctuations. For example, they can write that the price of gold declined one day meaningfully from $1,865 to $1,850 because of the hawkish Fed’s decision. But this is nonsense, as such a drop is just a 0.8% slide, while gold’s daily standard deviation is more than 1.1%. It means that the decrease was perfectly normal, given gold’s volatility, and could occur even without any meaningful market events.
- Investing in gold is more of a pricing game than a value game. This is because gold has no ‘intrinsic value’. It implies that market sentiment is crucial in the gold market. I’m not saying that gold just moves erratically, driven by animal spirits, or that fundamental factors don’t matter, but rather that they affect the gold price via investor perceptions and moods.
- That’s not all the important points about the gold market, but I’ve run out of space here. I hope that I’ll be able to share more insights on another occasion, somewhere in this beautiful universe.

Thank you for reading today’s free analysis. If you enjoyed it, and would you like to know more about the links between the economic outlook, and the gold market, we invite you to read the November Gold Market Overview report. Please note that in addition to the above-mentioned free fundamental gold reports, and we provide premium daily Gold & Silver Trading Alerts with clear buy and sell signals. We provide these premium analyses also on a weekly basis in the form of Gold Investment Updates. In order to enjoy our gold analyses in their full scope, we invite you to subscribe today. If you’re not ready to subscribe yet though and are not on our gold mailing list yet, we urge you to sign up. It’s free and if you don’t like it, you can easily unsubscribe. Sign up today!
Arkadiusz Sieron, PhD
Sunshine Profits: Effective Investment through Diligence & Care.-----
Disclaimer: Please note that the aim of the above analysis is to discuss the likely long-term impact of the featured phenomenon on the price of gold and this analysis does not indicate (nor does it aim to do so) whether gold is likely to move higher or lower in the short- or medium term. In order to determine the latter, many additional factors need to be considered (i.e. sentiment, chart patterns, cycles, indicators, ratios, self-similar patterns and more) and we are taking them into account (and discussing the short- and medium-term outlook) in our Gold & Silver Trading Alerts.
-
Stagflation: the Worse for Us, the Better for Gold
November 23, 2022, 1:14 PMStagflation is coming – and it could make the 1970s look like a walk in the park.
As you’ve probably noticed, I expect a recession next year, and I’m not alone, as this has become the baseline scenario for many financial institutions and analysts. Even the DSGE model used by the New York Fed shows an 80% probability of a hard landing (defined as four-quarter GDP growth dipping below -1%) over the next ten quarters. Reasons? Inflation and the Fed’s tightening cycle. The history is clear: whenever inflation has been above 5%, the Fed’s hikes in interest rates have always resulted in an economic downturn. The key yield curve has recently inverted, which means that the most reliable recessionary indicator has started to flash red light.
Although the coming recession could decrease the rate of inflation more than I assume, given the slowdown in money supply growth, I believe that high inflation (although lower compared to the current level) will continue through 2023 and perhaps also in 2024 due to the excess increase in money supply during the pandemic. It means that recession is likely to be accompanied by high inflation, forming a powerful yet negative combo, namely, stagflation.
If the calls for stagflation are correct, it suggests that the coming recession won’t be mild or short-lived, as it’s not easy to combat it. In the early 1980s, Paul Volcker had to raise the federal funds rate to above 17%, and later even 19% (see the chart below), to defeat inflation, which triggered a painful double-dip recession. During stagflation, there is a lot of uncertainty in the economy, and monetary policy becomes much more complicated, as the central bank doesn’t know whether to focus on fighting inflation, which could become entrenched, or rising unemployment. In a response to the Great Recession or the Great Lockdown, the Fed could ease its monetary policy aggressively to address declining aggregate demand and neutralize deflationary pressure. But if inflation remains high, Powell’s hands are tied.
Some analysts argue that today’s financial imbalances are not as severe as those in the run-up to the 2007-2009 global financial crisis. Partially, they’re right. Commercial banks seem to be in much better shape. What’s more, inflation has reduced the real value of debts, and it remains much higher than many interest rates, implying that governments and companies can still issue very cheap debt.
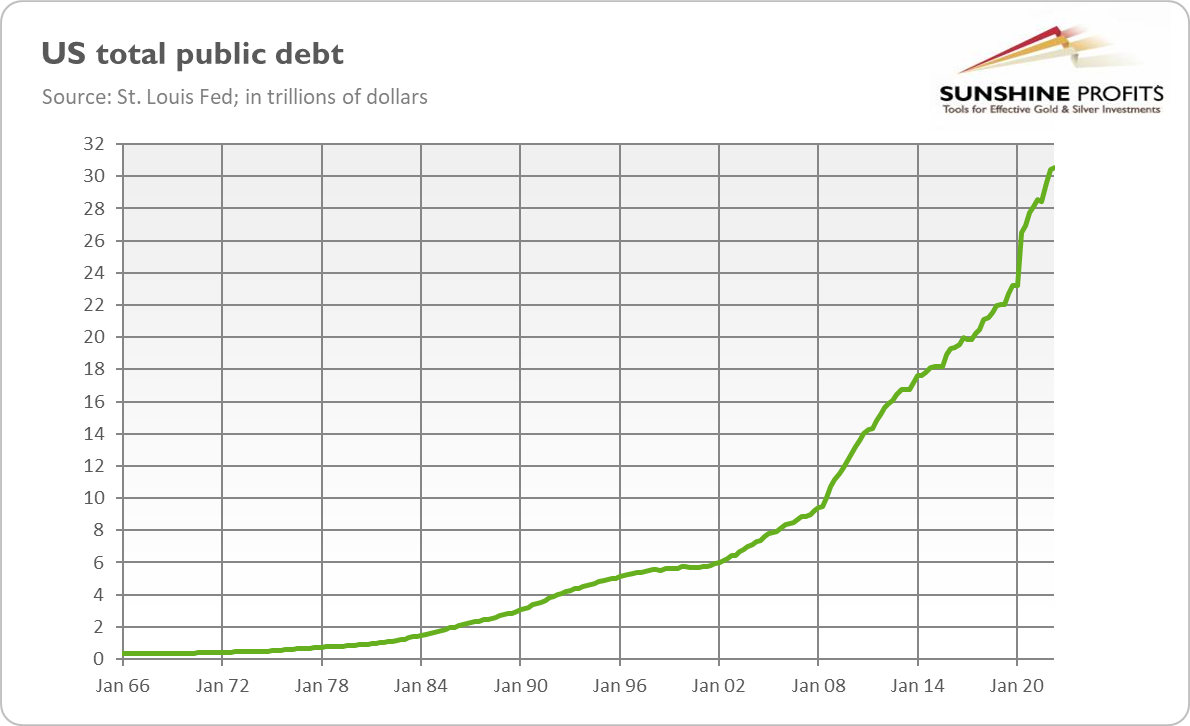
However, financial markets remain very fragile. A recent example might be the turmoil in the UK after the government proposed unfunded tax cuts that altered the price of Treasury bonds and negatively affected the financial situation of pension funds. The level of both private and public debt as a share of global GDP is much higher today than in the past, having risen from about 200% in 1999 to about 350% today. It means that the space for fiscal expansion will be more limited this time, and that the current tightening of monetary policy all over the world could have huge repercussions for the global economy. We’re already observing the first symptoms: the financial bubbles are bursting and asset prices are declining, reducing financial wealth and the value of many collaterals.
This is why economist Nouriel Roubini believes that “the next crisis will not be like its predecessors.” You see, in the 1970s, we had stagflation but no debt crisis. The Great Recession was essentially the result of the debt crisis, followed by the credit crunch and deleveraging. But it caused a negative demand shock and low inflation as a result. Now, we could have the worst of both worlds – that is, a stagflationary debt crisis.

What does it all mean for the gold market? Well, to be very accurate, nobody knows! We have never experienced stagflation combined with the debt crisis. However, gold shone both during the 1970s stagflation and the global financial crisis of 2007-2009, so my bet is that it will rally this time as well. It could, of course, decline during the period of asset sell-offs, as investors could sell it in a desperate attempt to raise cash, but it should later outperform other assets.
To be clear, it’s possible that inflation will decline and we’ll avoid stagflation or that the Fed will blink and prevent the debt crisis instead of fighting with inflation at all costs, but one or another economic crisis is going to happen. When gold smells it, it should rebound! 2023 should, therefore, be much better for gold than this year, as the economy will be approaching recession and the Fed will be less hawkish.
Thank you for reading today’s free analysis. If you enjoyed it, and would you like to know more about the links between the economic outlook, and the gold market, we invite you to read the November Gold Market Overview report. Please note that in addition to the above-mentioned free fundamental gold reports, and we provide premium daily Gold & Silver Trading Alerts with clear buy and sell signals. We provide these premium analyses also on a weekly basis in the form of Gold Investment Updates. In order to enjoy our gold analyses in their full scope, we invite you to subscribe today. If you’re not ready to subscribe yet though and are not on our gold mailing list yet, we urge you to sign up. It’s free and if you don’t like it, you can easily unsubscribe. Sign up today!
Arkadiusz Sieron, PhD
Sunshine Profits: Effective Investment through Diligence & Care.-----
Disclaimer: Please note that the aim of the above analysis is to discuss the likely long-term impact of the featured phenomenon on the price of gold and this analysis does not indicate (nor does it aim to do so) whether gold is likely to move higher or lower in the short- or medium term. In order to determine the latter, many additional factors need to be considered (i.e. sentiment, chart patterns, cycles, indicators, ratios, self-similar patterns and more) and we are taking them into account (and discussing the short- and medium-term outlook) in our Gold & Silver Trading Alerts.
-
Stagflation Is Coming, and Gold’s Gonna Love It
November 11, 2022, 8:52 AMAs the Fed tightens monetary policy, fears of overdoing it are rising. However, the US central bank is far from overtightening. It increases the odds of stagflation and a bullish time for gold.
As central banks all over the world are tightening their monetary policies, more and more analysts, including Paul Krugman, are afraid that Powell and his colleagues are hiking interest rates too aggressively, risking going too far. They believe that inflation will soon decline, so the Fed is braking too hard.
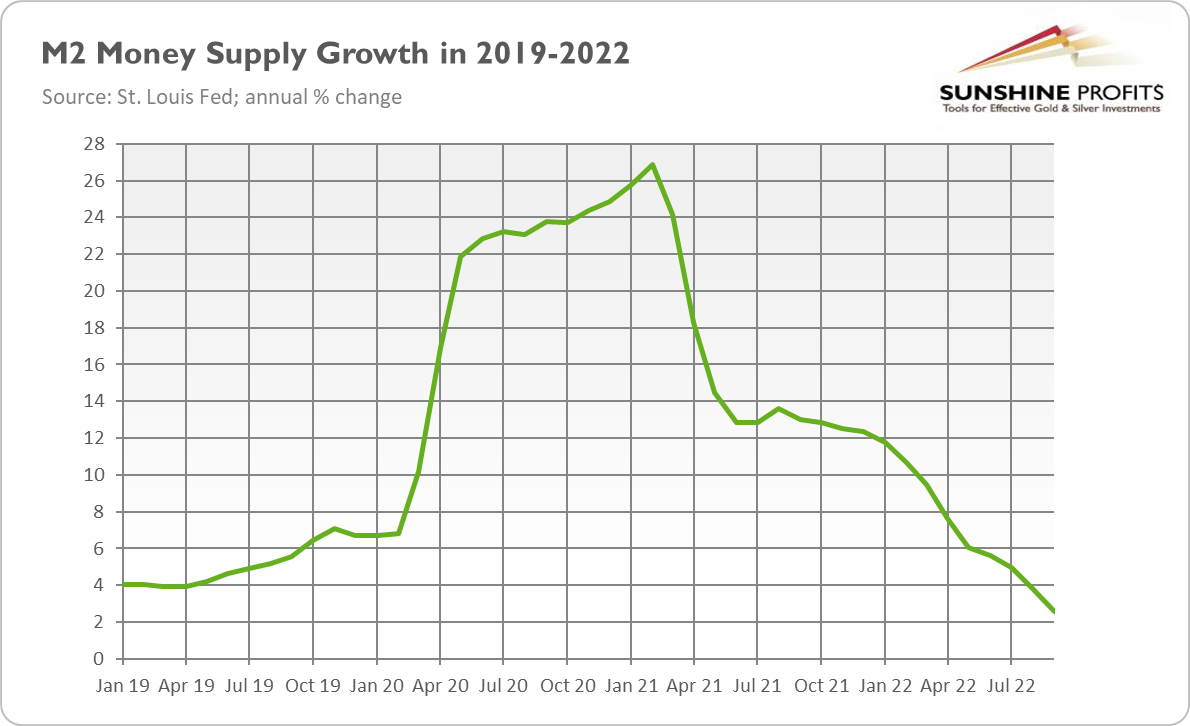
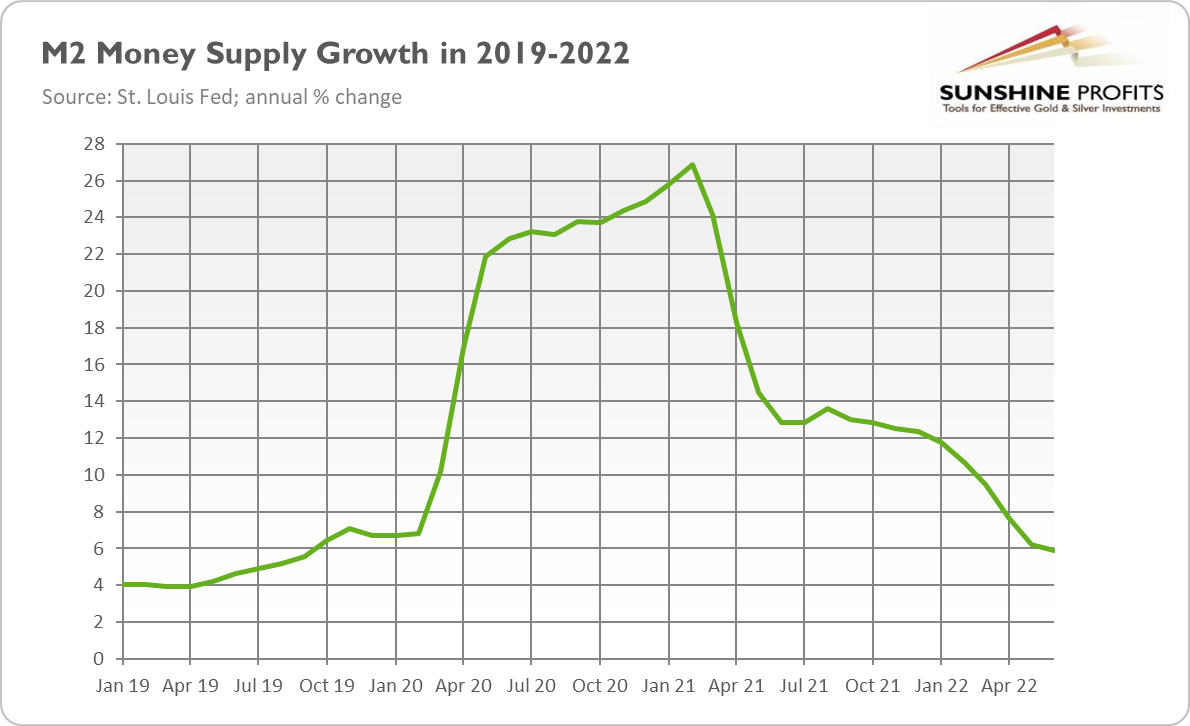
Well, as always, there is some truth in these opinions. The inflation rate is likely to decrease as the growth in the money supply decelerates and even declines below the pre-pandemic rates (see the chart below). And monetary policy operates with a long lag, which means that the effects of the hawkish Fed’s actions haven’t been fully felt by the economy. Hence, the central bankers could easily overdo. After all, they are so incompetent that overreacting to inflation after a long period of underreactin wouldn’t be surprising at all.
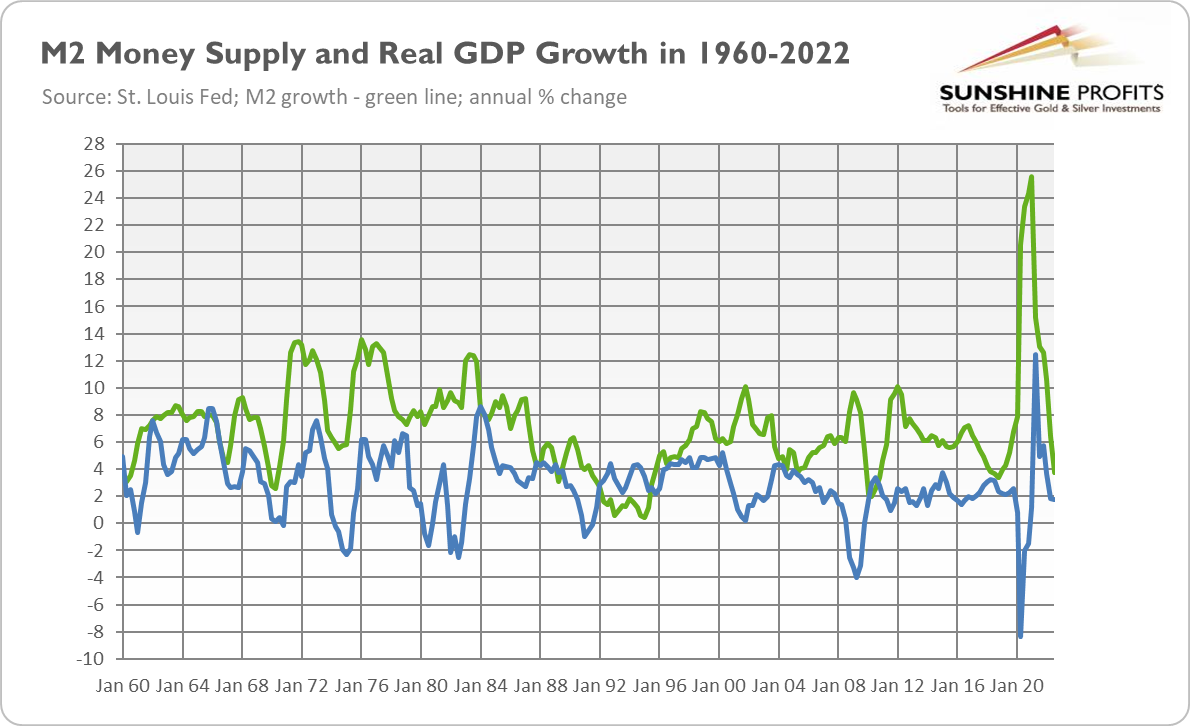
However, even my students are aware of lags in monetary policy, so there is a chance that someone from the army of PhDs working for the Fed has heard about them and taken them into account. But more seriously, although the pace of money supply growth has normalized, there is still an excess of money supply relative to output. As the chart below shows, since the global financial crisis, the increase in M2 money supply has been outpacing real GDP growth, reaching a peak during the pandemic. This growth differential hasn’t disappeared or turned negative yet, so with too many people chasing too few goods, inflation won’t go away very soon.
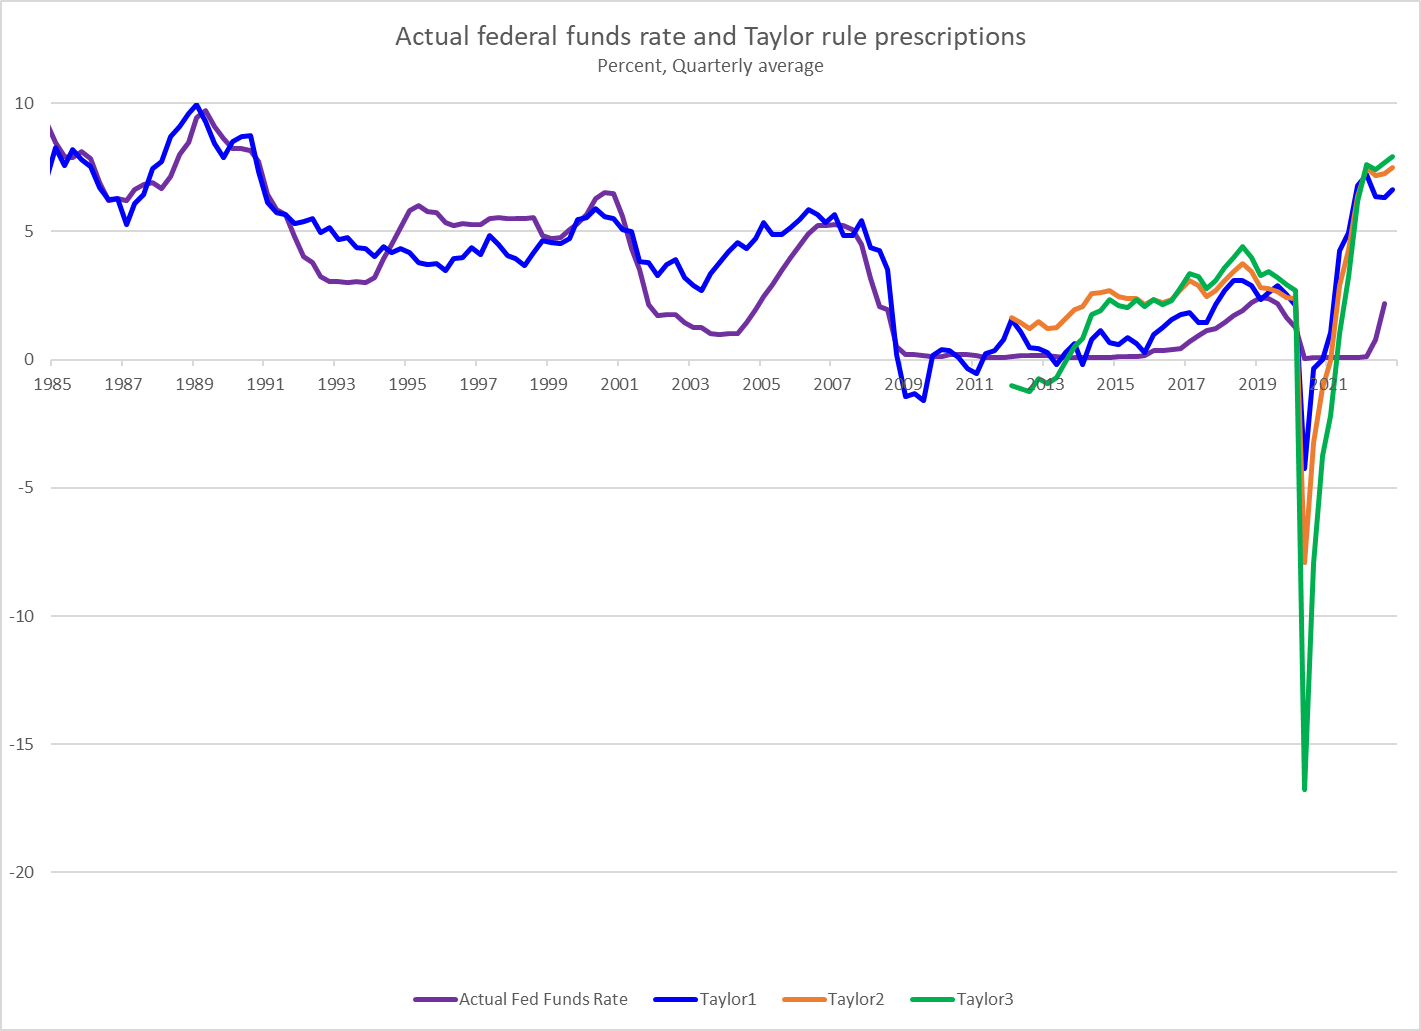
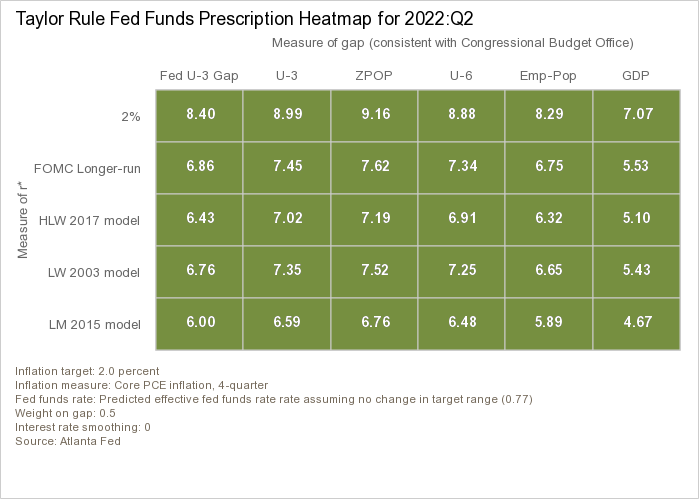
You see, the current monetary policy is hardly a tight one. According to the Taylor rule, the key tool used by the central banks, the Fed should set the federal funds rate at least at 6.7% (see the chart below) – just to have a neutral stance!
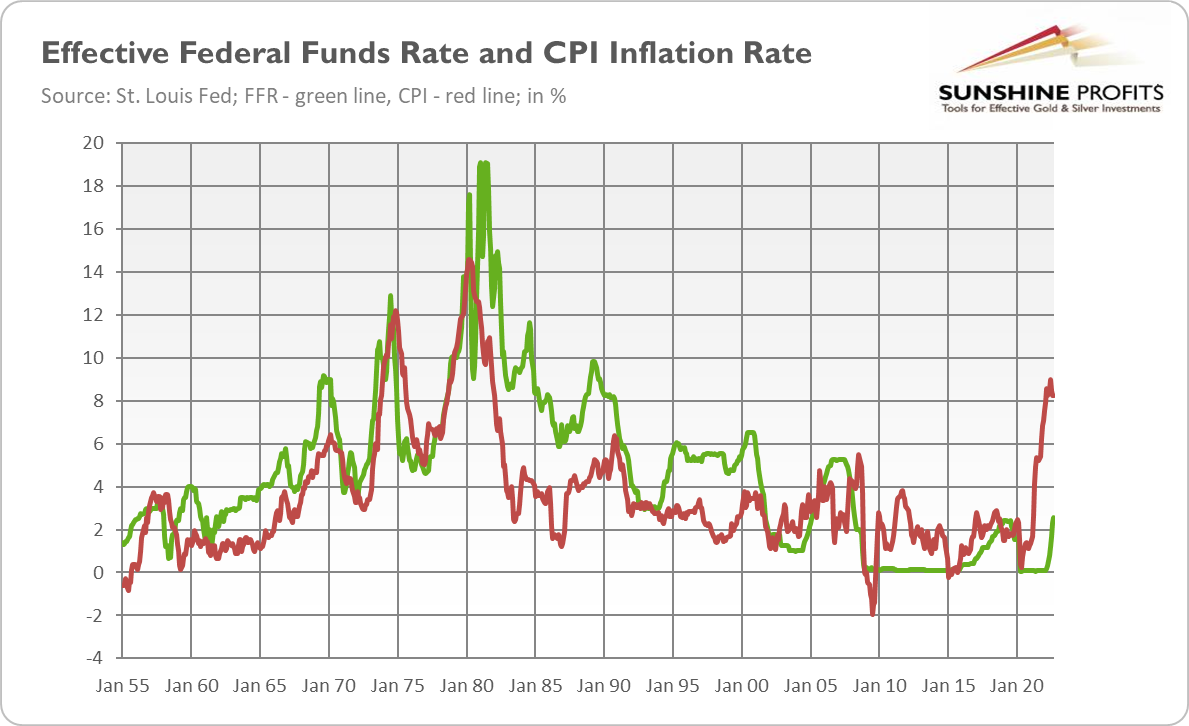
As the next chart shows, the real federal funds rate – understood as the federal funds effective rate minus the CPI annual rate – is still deeply negative. I’m not saying that inflation won’t disappear without the real federal funds rate being positive. After all, what’s fundamental for inflation is what’s happening with the money supply.
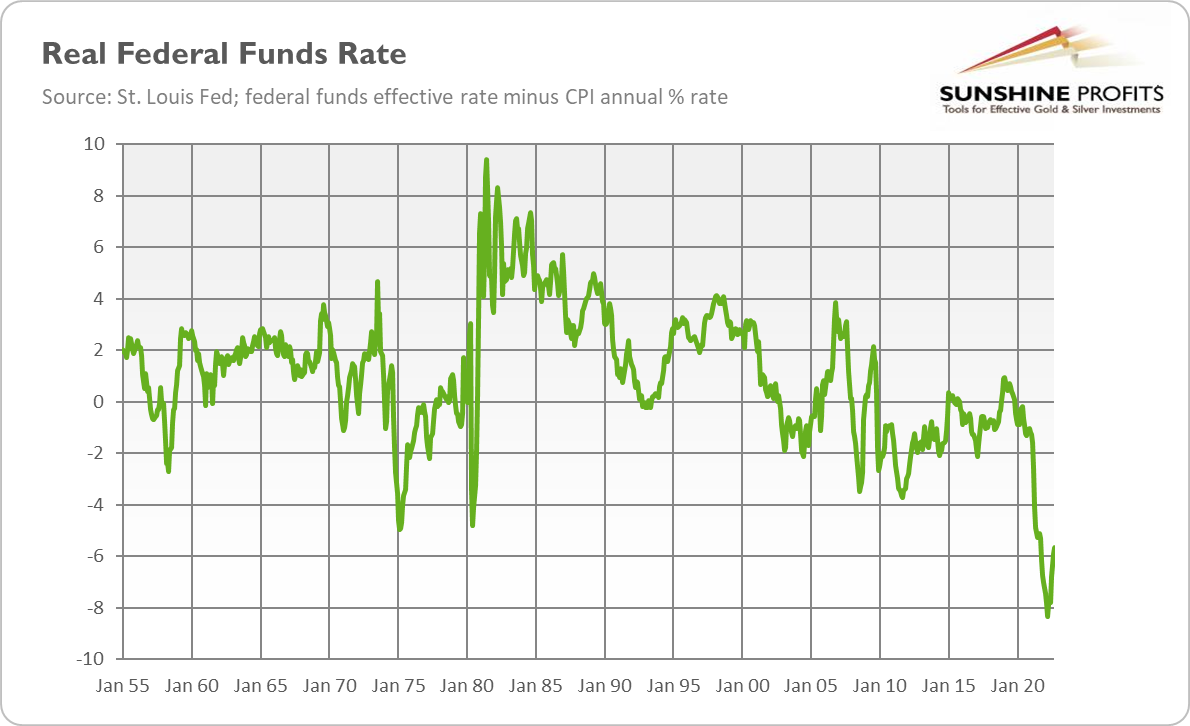
However, positive real funds rates are high enough to slow nominal growth and reduce demand in excess of supply. The point is that it could be difficult to re-anchor inflation expectations without positive interest rates. Inflation expectations seem to have already peaked, but they remain historically high (see the chart below). As a reminder, what Paul Volcker did was take a huge hike in the federal funds rate to bring rates into positive territory and restore confidence in the Fed, pushing inflation expectations down. He raised the federal funds rate to 19% at the end of 1980. The real rate surged from -4.8% to 7.3% and then to the record 9.4%. Compare it with the current -5.7 (as of the end of October). We are not even close.

What does it all mean for the gold market? Well, the truth is that the Fed is still conducting too easy, not too tight, monetary policy. The lending conditions have tightened, but this is because the financial sector has been cautious and forward-looking, not because the US central bank has become restrictive. We’re moving into this territory, but very slowly.
It implies that a recession is coming just when the real federal funds rate is still deeply negative and the chorus of voices calling for a softening of the Fed’s stance gets louder and louder. For me, this is a recipe for stagflation rather than a successful disinflation. So far, the Fed has kept a stony, hawkish face, but when the economic situation deteriorates, I bet it will blink and won’t try to fight with inflation at all costs. Have you seen how quickly the Bank of England intervened during the recent market turmoil? Actually, stagflation is certain, in the sense that the next recession will be accompanied by higher inflation than the last few ones. The question is how serious it will be!
That’s excellent news for the gold bulls, as stagflation is what gold likes best. This is because during stagflation, we have both economic stagnation and high inflation. When attacked by two enemies at the same time, most assets become vulnerable, and gold tends to outperform them. This is not surprising, as during stagflation there is a huge amount of economic uncertainty, confidence in the central bank is low, and real interest rates are on the decline, with some of them falling into negative territory. In other words, stagflation makes gold’s fundamental factors bullish.
Thank you for reading today’s free analysis. If you enjoyed it, and would you like to know more about the links between the economic outlook, and the gold market, we invite you to read the November Gold Market Overview report. Please note that in addition to the above-mentioned free fundamental gold reports, and we provide premium daily Gold & Silver Trading Alerts with clear buy and sell signals. We provide these premium analyses also on a weekly basis in the form of Gold Investment Updates. In order to enjoy our gold analyses in their full scope, we invite you to subscribe today. If you’re not ready to subscribe yet though and are not on our gold mailing list yet, we urge you to sign up. It’s free and if you don’t like it, you can easily unsubscribe. Sign up today!
Arkadiusz Sieron, PhD
Sunshine Profits: Effective Investment through Diligence & Care.-----
Disclaimer: Please note that the aim of the above analysis is to discuss the likely long-term impact of the featured phenomenon on the price of gold and this analysis does not indicate (nor does it aim to do so) whether gold is likely to move higher or lower in the short- or medium term. In order to determine the latter, many additional factors need to be considered (i.e. sentiment, chart patterns, cycles, indicators, ratios, self-similar patterns and more) and we are taking them into account (and discussing the short- and medium-term outlook) in our Gold & Silver Trading Alerts.
-
Yield Curve Flashes Recession Alert! Better Times for Gold?
November 4, 2022, 11:50 AMThe key yield curve has inverted, shouting loudly that a recession is coming - and with it, better times for gold.
I activated the high-degree recession alert! I’ve been writing about the downturn for some time, but in October, another important indicator flashed a red light. As you can see on the chart below, the key yield curve has inverted.
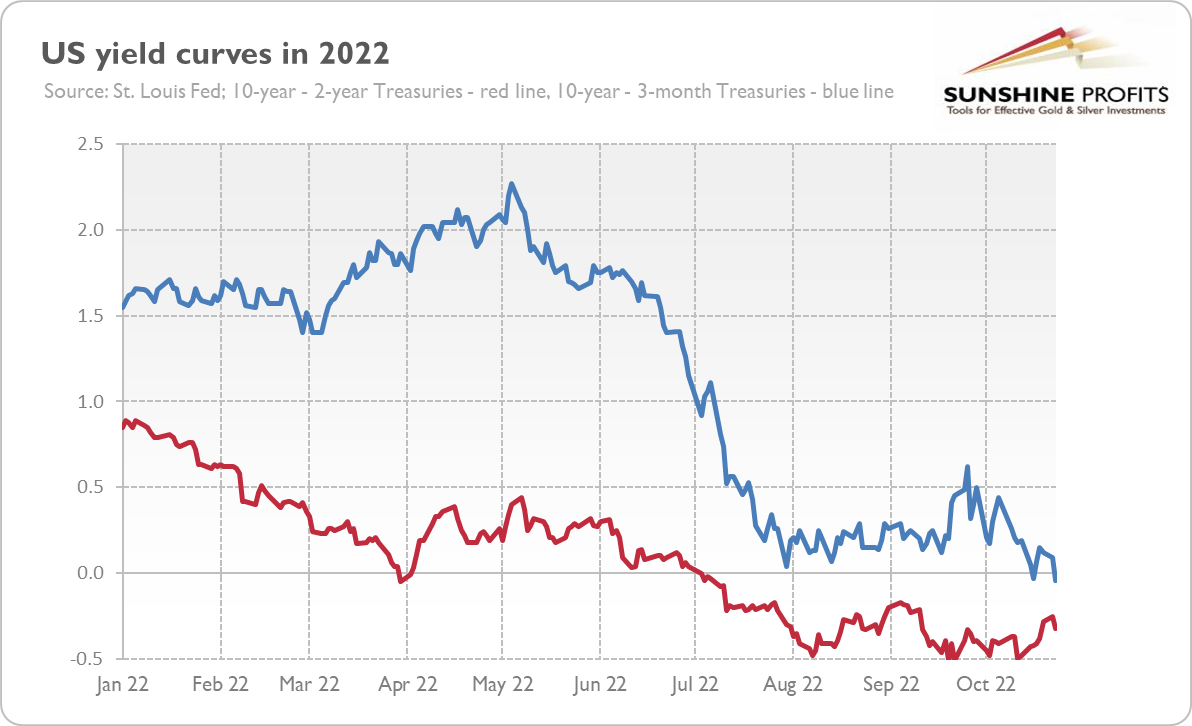
Earlier this year, the spread between 10-year and 2-year US Treasury bonds (the red line) turned negative. In April, it timidly fell below zero for a while, but in July it did it again and with greater boldness, remaining since then in negative territory. Commenting on this event, I wrote:
This is a very important development, as it strengthens the recessionary signal sent by the April curve. The previous reversal was very brief and shallow – and thus not very reliable. But the second inversion within just four months implies that dark clouds are indeed gathering over the US economy.
I also added one important caveat about drawing too far-reaching conclusions about the recessionary prospects:
The more important spread between 10-year and 3-month US Treasuries hasn’t yet turned negative. However, it has flattened significantly since May, plunging to a level close to zero, and – after the next hikes in the federal funds rate – it could invert as well.
Well, this is what happened last month. As the chart above shows, the spread between 10-year and 3-month US Treasuries (blue line) fell below zero on October 18 (to -0.03%) and later on October 25 (to -0.4%), joining the club of negative spreads.
The inversion of this yield curve is a huge development, as it strengthens the recessionary signals sent by the 10-year and 2-year curves in April and June. Please remember that the 10-year and 3-month spread is believed to offer the highest accuracy and predictive power among all possible bond yields. As the chart below shows, this spread has turned negative before each recession in the 1982-2020 period (the research conducted by the New York Fed confirms this feature also for the earlier years, until 1968).
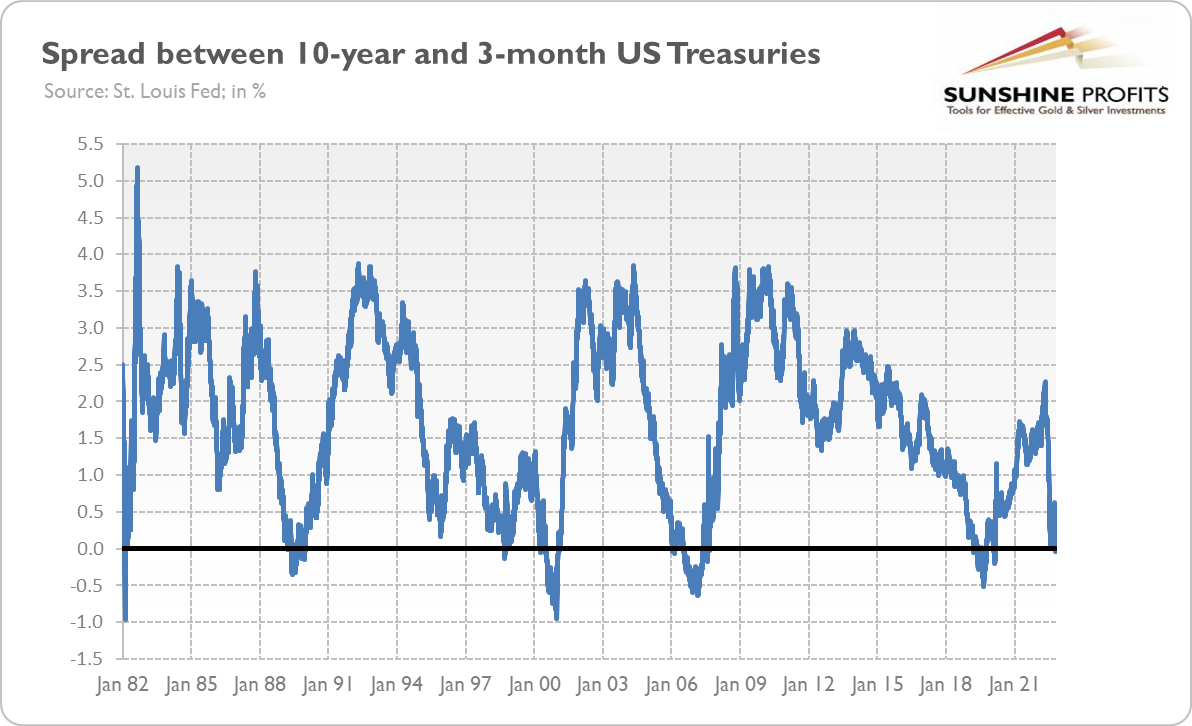
It means that each US economic downturn in the last five decades has been preceded by the inversion of this yield curve, and each fall below zero has been followed by the recession. In other words, as the inversion in this particular yield curve correctly predicted each of the last eight recessions without giving any false alarms, it makes it the most reliable recessionary indicator in modern economic history. It’s true that investors don’t have a crystal ball, but the yield curve is the next best thing they can use.

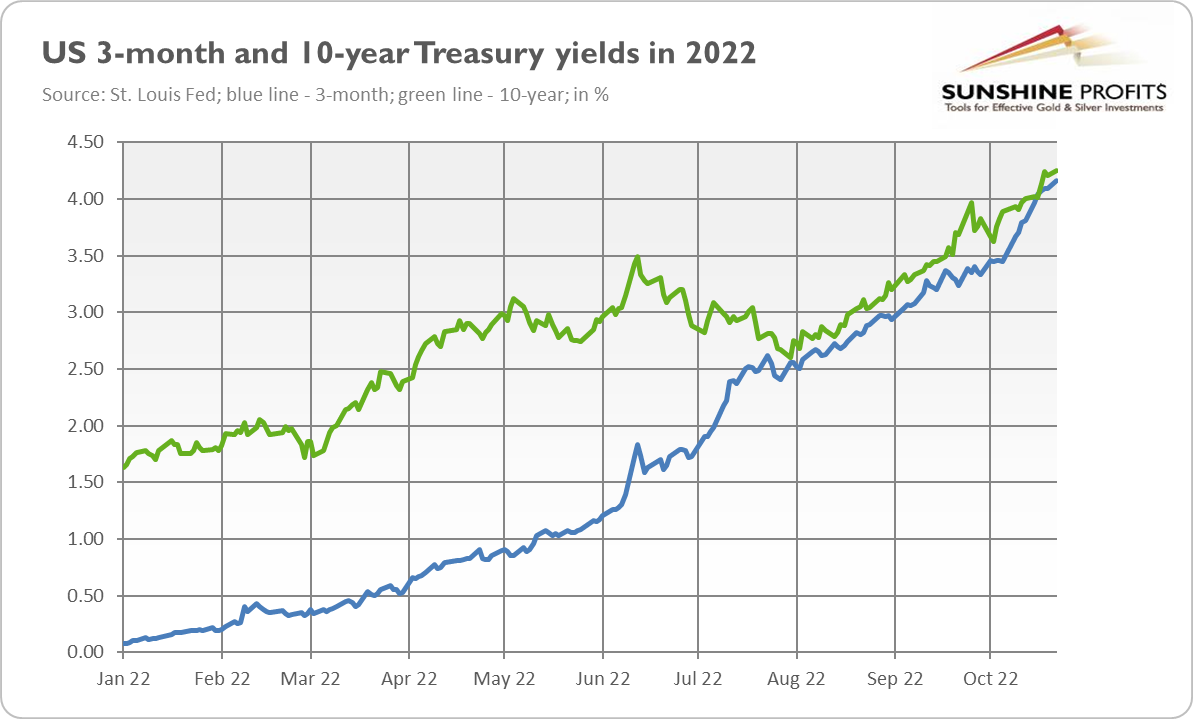
What’s also important is that the reason behind the recent inversion is not the decline in long-term yields but the increase in the 3-month Treasury yield, as the chart below shows. To be precise, both yields have risen recently, but the short-term yields simply climbed higher. Why? Well, the Fed’s tightening cycle and input price inflation made entrepreneurs and investors scramble for the funds needed to finish their investment projects. As they compete for liquidity and the Fed hikes the federal funds rate, short-term interest rates go up.
What does it all mean for the gold market? Well, the increase in the bond yields won’t help the gold prices – it can actually send them lower. However, the recessionary signal sent by the yield curve is clearly bullish for gold. If the predictive power of the yield curve remains in force, a recession is very likely to arrive by the end of 2023, as it historically used to follow the inversion of the yield curve after four quarters (or sometimes more). Hence, gold should also shine at some point in the near future. As the chart below shows, inversions of the yield curve have not only preceded recessions but also rallies in gold prices.
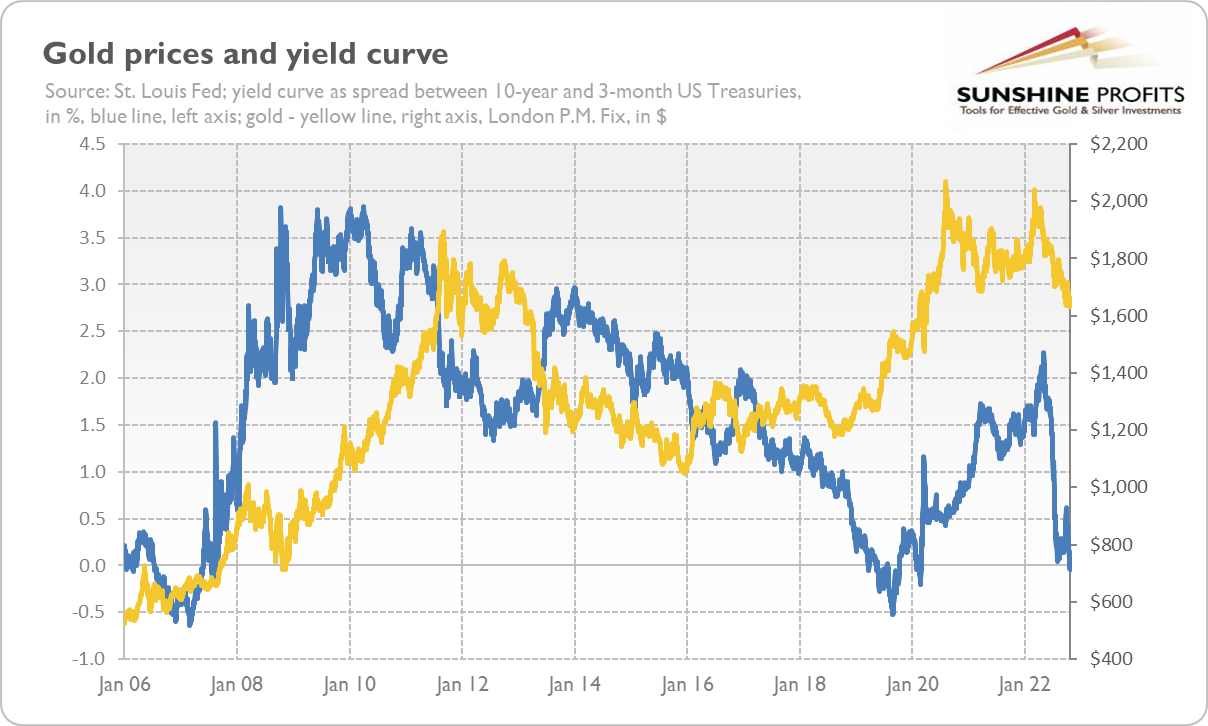
To be clear, what is positive for gold is not the inversion of the yield curve. Gold goes up together with the steepening of the yield curve, which happens when short-term rates decline. It occurs when the Fed smells a recession and starts to cut interest rates. In other words, gold needs the Fed’s pivot to reverse its downward trend. It’s a matter of time – some analysts believe that the January hike will be the last in this cycle – a recession is already on the way. The adoption of a more neutral stance by the Fed, which is quickly approaching, should allow gold to catch its breath and prepare for the future rally.
Thank you for reading today’s free analysis. If you enjoyed it, and would you like to know more about the links between the economic outlook, and the gold market, we invite you to read the November Gold Market Overview report. Please note that in addition to the above-mentioned free fundamental gold reports, and we provide premium daily Gold & Silver Trading Alerts with clear buy and sell signals. We provide these premium analyses also on a weekly basis in the form of Gold Investment Updates. In order to enjoy our gold analyses in their full scope, we invite you to subscribe today. If you’re not ready to subscribe yet though and are not on our gold mailing list yet, we urge you to sign up. It’s free and if you don’t like it, you can easily unsubscribe. Sign up today!
Arkadiusz Sieron, PhD
Sunshine Profits: Effective Investment through Diligence & Care.-----
Disclaimer: Please note that the aim of the above analysis is to discuss the likely long-term impact of the featured phenomenon on the price of gold and this analysis does not indicate (nor does it aim to do so) whether gold is likely to move higher or lower in the short- or medium term. In order to determine the latter, many additional factors need to be considered (i.e. sentiment, chart patterns, cycles, indicators, ratios, self-similar patterns and more) and we are taking them into account (and discussing the short- and medium-term outlook) in our Gold & Silver Trading Alerts.
-
The Queen Is Dead, Long Live the (Gold) King!
October 28, 2022, 12:17 PMQueen Elizabeth II died. She was a powerful anchor and symbol in the political sphere, just like gold in the financial realm.
The Power of Symbols
Her Majesty Queen Elizabeth II, the Sovereign of the United Kingdom of Great Britain and Northern Ireland and the Head of the Commonwealth, died on September 8, 2022. I’m not a British or Commonwealth citizen, nor a devoted supporter (and observer) of the British monarchy. And yet – together with millions of people all over the world – I was saddened by the death of the Queen. I began to wonder why it was such poignant news, given that she was not my monarch and that her role was purely ceremonial and formal (the Queen reigned, but didn’t rule).
The first common explanation is that Queen Elizabeth II was a fixture, a source of continuity and stability in an ever-changing world. In the words of the former Prime Minister, Lizz Truss, Queen Elizabeth was “the rock on which modern Britain was built”. Indeed, she acceded to the throne in February 1952, when Winston Churchill was Prime Minister and Harry Truman was President of the United States. It means that she ruled for more than 70 years, the longest of any British monarch and the longest recorded of any female head of state in history. She has simply always been there as Queen, many years before I and many other people were even born.
However, there must be much more than that – actually we don’t despair after the death of every old person who remembers WWII. It seems that, despite how modern and progressive we are, there is a magic in the monarchy that resonates with something deep in us. Please note that the UK’s Parliament is practically the supreme authority, but its members exercise their power in the name of the Crown. The government was, for seventy years, Her Majesty’s government, while the opposition was Her Majesty’s most loyal opposition. Of course, from the pragmatic point of view, it was just a play, but thanks to these rituals, the British monarchy remains a symbolic but integral part of the UK’s power structure.
Don’t underestimate the power of symbols! According to polls, more than a third of Britons regularly dream about the Queen and other members of the royal family. Elizabeth II could play just a symbolic role – but the symbol she embodied in herself was very powerful, almost religious nature. Actually, we can say that Elizabeth II was the most well-known representation of an archetype of the queen, one of the most important archetypes that symbolizes the wholeness and full potential of a woman and the ultimate in female leadership. The archetypal good queen is beloved as she takes care of her people and provides them with the structure they look to for safety. This is why her death disheartened so many people in the world.
The Queen and Gold
OK, but what does the Queen and her death have in common with gold (except she apparently liked gold pianos)? Should we expect some geopolitical turmoil right now that could support the price of the yellow metal? I don’t think so. Elizabeth was automatically replaced by her son as the next king, Charles III. And whoever reigns in the UK, he or she doesn’t rule, so the change on the throne shouldn’t disturb the functioning of the government. Perhaps some countries will leave the Commonwealth now, or this structure will disintegrate, but it shouldn’t pose any significant geopolitical risks that could support, even temporarily, gold prices.
I decided to write about the Queen’s death rather than because I see some parallels between the perception of the Queen in the political realm and gold in the financial sphere. Why do people despair after the death of Elizabeth? Because, as previously stated, Queen was a fixture and a symbol. So why do people buy gold? Well, because gold is also a fixture, the rock on which the modern financial system was built. The golden anchor was removed only in the early 1970s, but to this day we say “gold standard” to describe a certain ideal (for example, we say that randomized double-blind placebo control studies are the “gold standard” of epidemiologic studies). Elizabeth Windsor ruled for 70 years, while gold ruled as money for centuries, and although dethroned, it’s still with us.
People purchase gold also because it’s a powerful symbol, or even an archetypical form of money. You can easily verify it – please stop reading for a while and imagine a great treasure. What came to your mind? I bet that you saw precious metals, diamonds, etc., rather than credit cards or paper money. This is also why in times of crisis, people used to seek comfort in gold, an ultimate safe-haven asset, and in soothing speeches of the Queen. Hence, gold (nor a monarchy) is not a “barbarous relic”, but a powerful symbol deeply rooted in our psychology. If so, it won’t disappear anytime soon, but should last with us for a long time (although at what price is a completely different issue). The Queen is dead, long live the (gold) king!
Thank you for reading today’s free analysis. If you enjoyed it, and would you like to know more about the links between the economic outlook, and the gold market, we invite you to read the October Gold Market Overview report. Please note that in addition to the above-mentioned free fundamental gold reports, and we provide premium daily Gold & Silver Trading Alerts with clear buy and sell signals. We provide these premium analyses also on a weekly basis in the form of Gold Investment Updates. In order to enjoy our gold analyses in their full scope, we invite you to subscribe today. If you’re not ready to subscribe yet though and are not on our gold mailing list yet, we urge you to sign up. It’s free and if you don’t like it, you can easily unsubscribe. Sign up today!
Arkadiusz Sieron, PhD
Sunshine Profits: Effective Investment through Diligence & Care.-----
Disclaimer: Please note that the aim of the above analysis is to discuss the likely long-term impact of the featured phenomenon on the price of gold and this analysis does not indicate (nor does it aim to do so) whether gold is likely to move higher or lower in the short- or medium term. In order to determine the latter, many additional factors need to be considered (i.e. sentiment, chart patterns, cycles, indicators, ratios, self-similar patterns and more) and we are taking them into account (and discussing the short- and medium-term outlook) in our Gold & Silver Trading Alerts.
-
China Is Losing Momentum. Will Gold Find It?
October 21, 2022, 12:51 PMChina is facing several economic problems right now. Will gold benefit from them?
The country was to become the biggest economic power that would dethrone the United States. Its pace of development was impressive and practically without precedent: in 1980-2010, the annualized rate of growth was an average of 10%. Understandably, everyone trembled at the mere mention of the country’s name: China. Not anymore. China’s economy is clearly losing momentum.
In some senses, the slowdown is not surprising. The wealthier the country, the more challenging it is to develop very quickly. As China’s economy grew, the deceleration was only a matter of time, and right now, the country is still severely hit by the strict zero-COVID
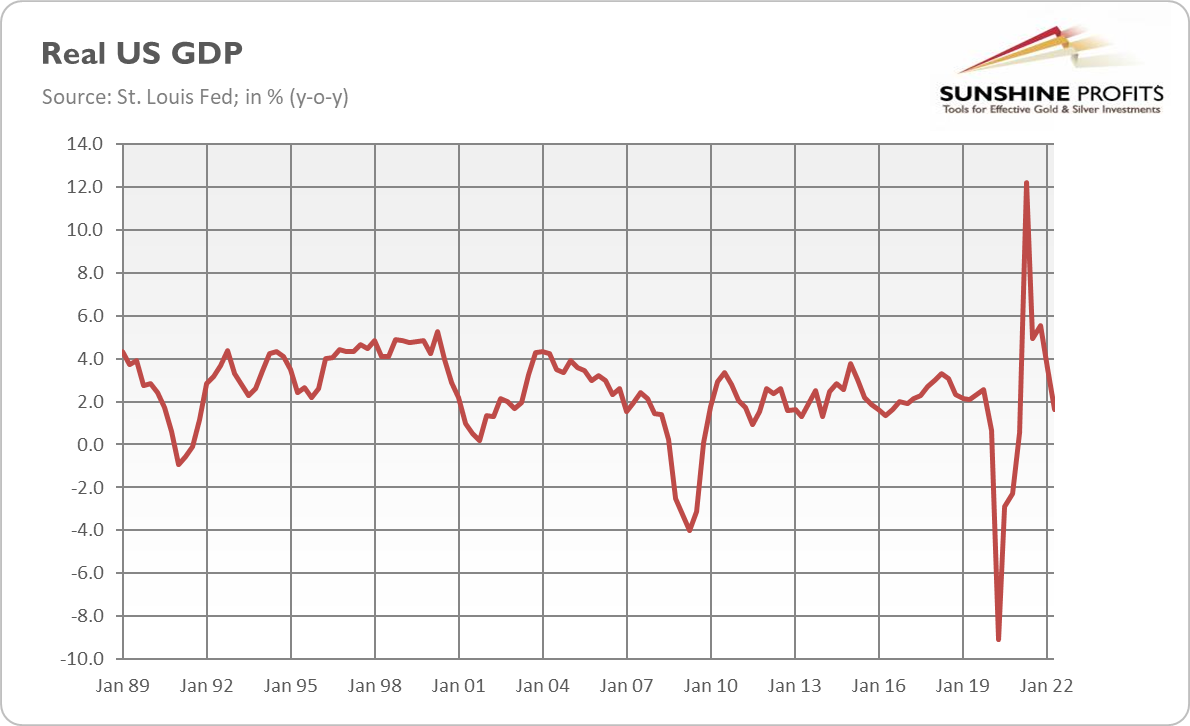
policy. According to Nomura bank, about 12% of China’s GDP is affected by harsh lockdowns and other sanitary measures. As a consequence, it cut the forecast of the country’s economic growth in 2022 to just 2.7%. As the chart below shows, the GDP contracted 2.6% on a quarterly basis and rose just by 0.4% year-to-year in the second quarter of this year. Beijing, we have a problem!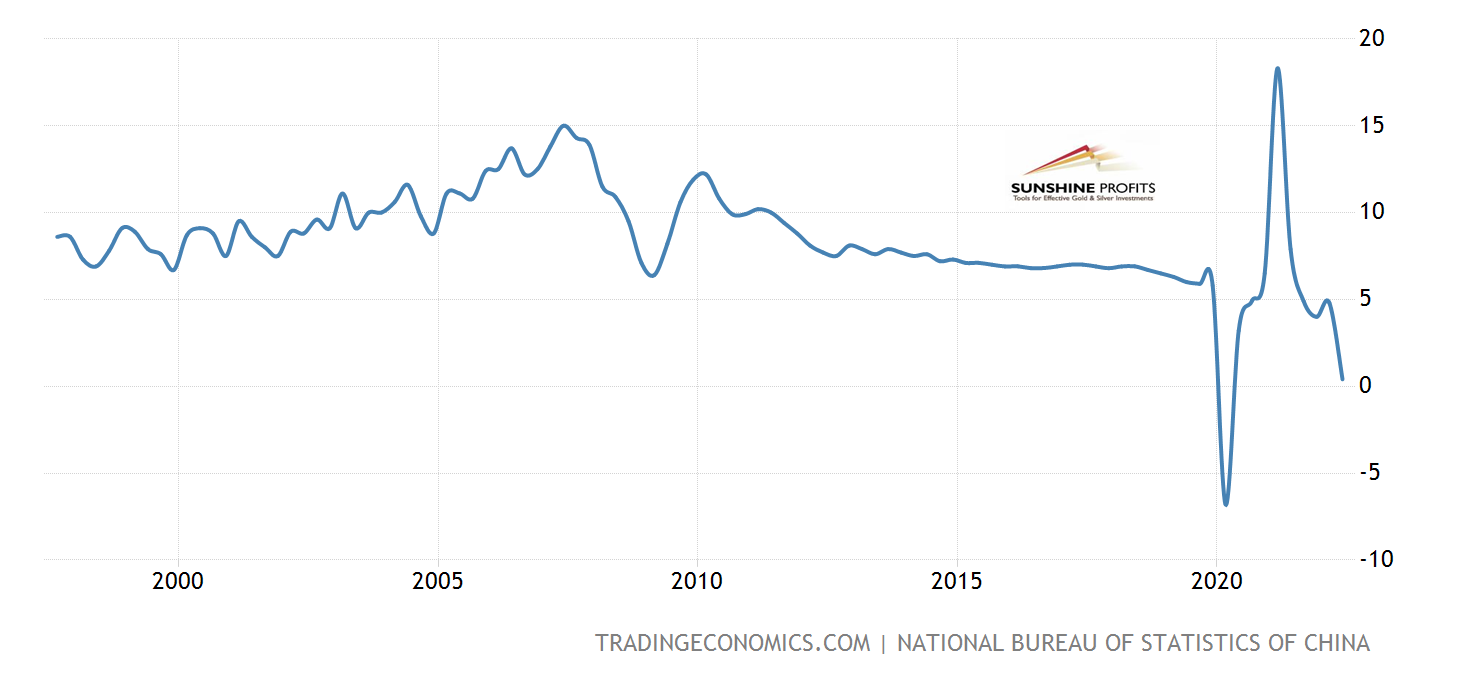
However, the dark clouds go beyond the pandemic. Stephen Roach mentions three powerful forces at work here: a profound shift in the ideological underpinnings of Chinese governance towards less market-friendly and more nationalistic and statist ideology that focuses more on a muscular foreign policy than economic growth, a structural transformation of the economy toward more consumer and services-based, and payback for past excesses.
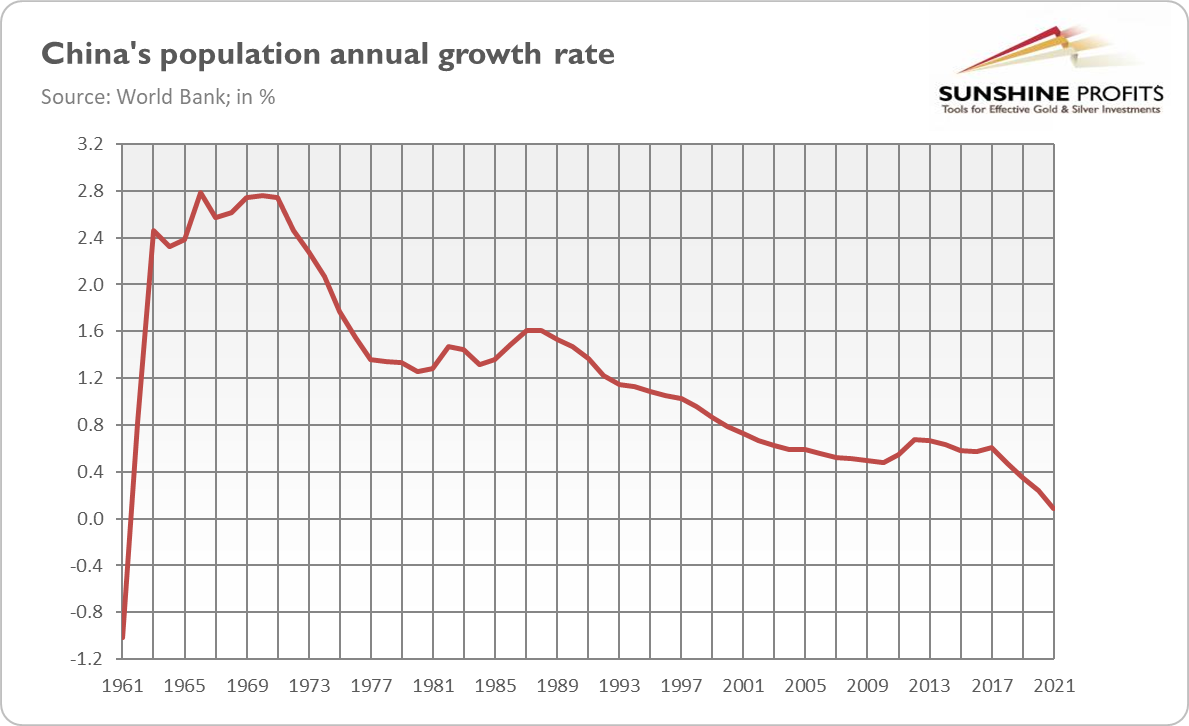
Other analysts add the issue of aging and population decline to this list. As the chart below shows, China’s population growth has been declining for decades – and this year it could actually shrink for the first time since the Great Famine of 1959-1961. According to the Shanghai Academy of Social Sciences’ predictions, from 2022, the population of China will decline annually by 1.1%, shrinking from 1.4 billion to about 600 million in 2100, if the trend continues. It would imply a decreased workforce and a slower pace of economic growth.
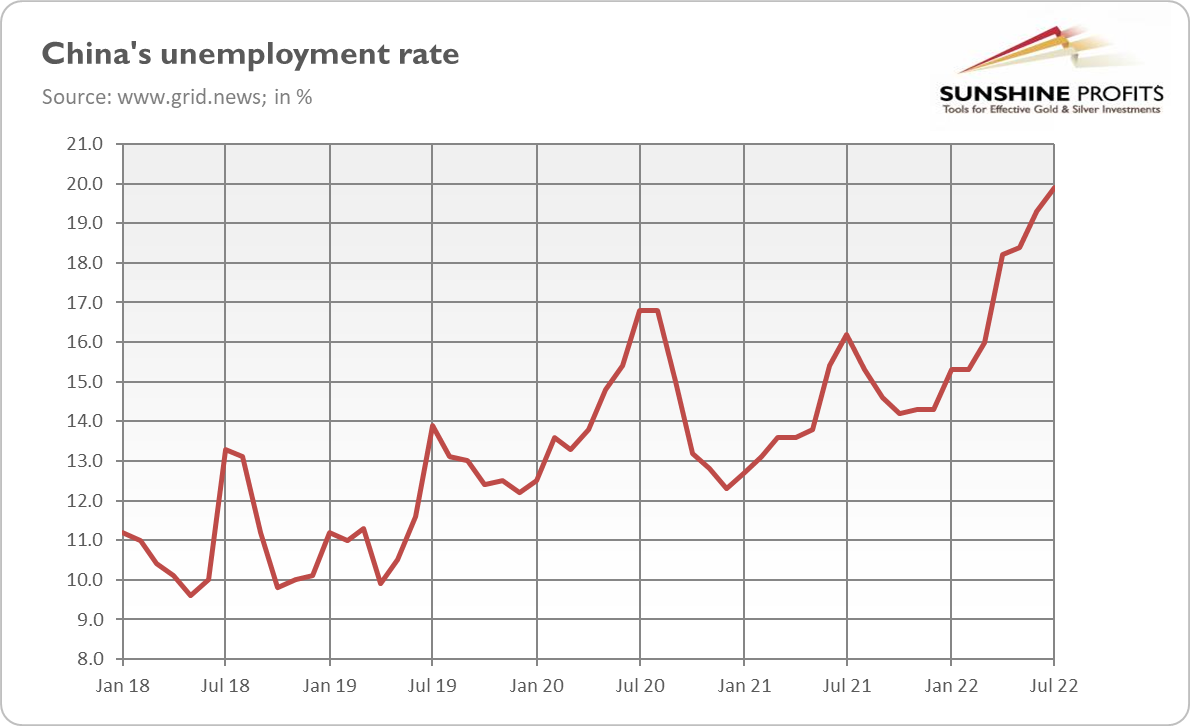
There is also a high rate of youth unemployment. In July, the unemployment rate among 16-24 year-olds hit an all-time high of 19.9%, as the chart below shows. Four years ago, when the data for the figure was finally made public, it was as low as 9.6%. Don’t expect mass riots, but high unemployment among young people could add some tensions and complicate the socio-political situation in China.
Let’s focus on an inevitable bust that came after the boom of the hyper-growth era. The best known manifestation of such a painful but necessary readjustment is, of course, the deflating property bubble. Paraphrasing Churchill’s famous phrase, never before have so many loans been taken by so many developers to build so many buildings in which so few people wanted to live! As Peter Hannam from The Guardian notes, “while China’s economy is roughly three-quarters that of the US or Europe, property assets have ballooned to double the size of America’s and triple Europe’s,” leading to one of the greatest misallocation of resources in the world. Suffice it to say that property companies are demolishing entire cities of half-finished buildings. Goodbye, ghost towns!
Remember Evergrande, which defaulted on part of its debt? This infamous company is just the tip of the iceberg. According to the S&P Global Ratings, 40% of developers are in “financial trouble,” and the situation may worsen further as some homeowners stop paying their mortgages in an untypical strike (the idea is simple: you stop construction, we stop paying mortgages). These boycotted loans could be worth as much as $300 billion.
What does China’s economic slowdown imply for the world’s economy and the gold market? Well, as China dominates global demand for many raw materials, its economic slowdown should take some pressure off commodity prices. On the other hand, the series of lockdowns could prolong the supply-chain issues and, thus, a period of elevated inflation. This could be positive for gold prices, but as long as the Fed remains hawkish and determined to beat inflation, gold will struggle.
We can't rule out the possibility that the real estate crisis will lead to a wider financial crisis, though given the peculiarities of Chinese state capitalism, I expect more of a Japan-style period of stagnation (or relatively low growth) rather than an American-style outright economic crisis. Gold could rally only if we see a contagion from China’s real estate to the US financial markets. Hence, gold bulls shouldn’t count on China’s economic problems – actually, the country’s slowdown could support the US dollar, putting gold prices under pressure. However, China’s economic slowdown would imply slower global growth, making the world more fragile and prone to recessions.
Last but not least, it could be that Xi Jinping decides to distract attention from economic problems and escalate conflict over Taiwan. In this scenario, gold could get support, although geopolitical tensions usually provide only a short-term boost.
Thank you for reading today’s free analysis. If you enjoyed it, and would you like to know more about the links between the economic outlook, and the gold market, we invite you to read the October Gold Market Overview report. Please note that in addition to the above-mentioned free fundamental gold reports, and we provide premium daily Gold & Silver Trading Alerts with clear buy and sell signals. We provide these premium analyses also on a weekly basis in the form of Gold Investment Updates. In order to enjoy our gold analyses in their full scope, we invite you to subscribe today. If you’re not ready to subscribe yet though and are not on our gold mailing list yet, we urge you to sign up. It’s free and if you don’t like it, you can easily unsubscribe. Sign up today!
Arkadiusz Sieron, PhD
Sunshine Profits: Effective Investment through Diligence & Care.-----
Disclaimer: Please note that the aim of the above analysis is to discuss the likely long-term impact of the featured phenomenon on the price of gold and this analysis does not indicate (nor does it aim to do so) whether gold is likely to move higher or lower in the short- or medium term. In order to determine the latter, many additional factors need to be considered (i.e. sentiment, chart patterns, cycles, indicators, ratios, self-similar patterns and more) and we are taking them into account (and discussing the short- and medium-term outlook) in our Gold & Silver Trading Alerts.
-
The Fed’s Challenge and Gold
October 14, 2022, 1:21 PMAs the economic slowdown deepens, the Fed’s challenges grow larger. It increases the risk of policy mistakes that could benefit gold.
Inflation Is Still a Challenge
It was a tough year for the Federal Reserve. The U.S. central bank’s inflation forecasts were embarrassing. In December 2021, it projected the PCEPI inflation rate at 2.6%, while it soared to 6.8% through June. The Fed disclosed $300 billion in unrealized losses on its assets as of the end of March, showing the negative impact of rising interest rates on the market value of the Fed’s balance sheet (that likely only intensified since Q1). There was a trading scandal with two top officials resigning.
The real challenges are still ahead of Powell and his colleagues. They are caught between a rock and a hard place. The rock is, of course, inflation, which was caused by the huge increase in the money supply in response to the pandemic. At its current level, above 8%, it’s intolerable and must be curbed. However, the hard place is an economic slowdown. The Fed continues its tightening cycle, but it might be too complacent about the strength of the labor market and overall economy.
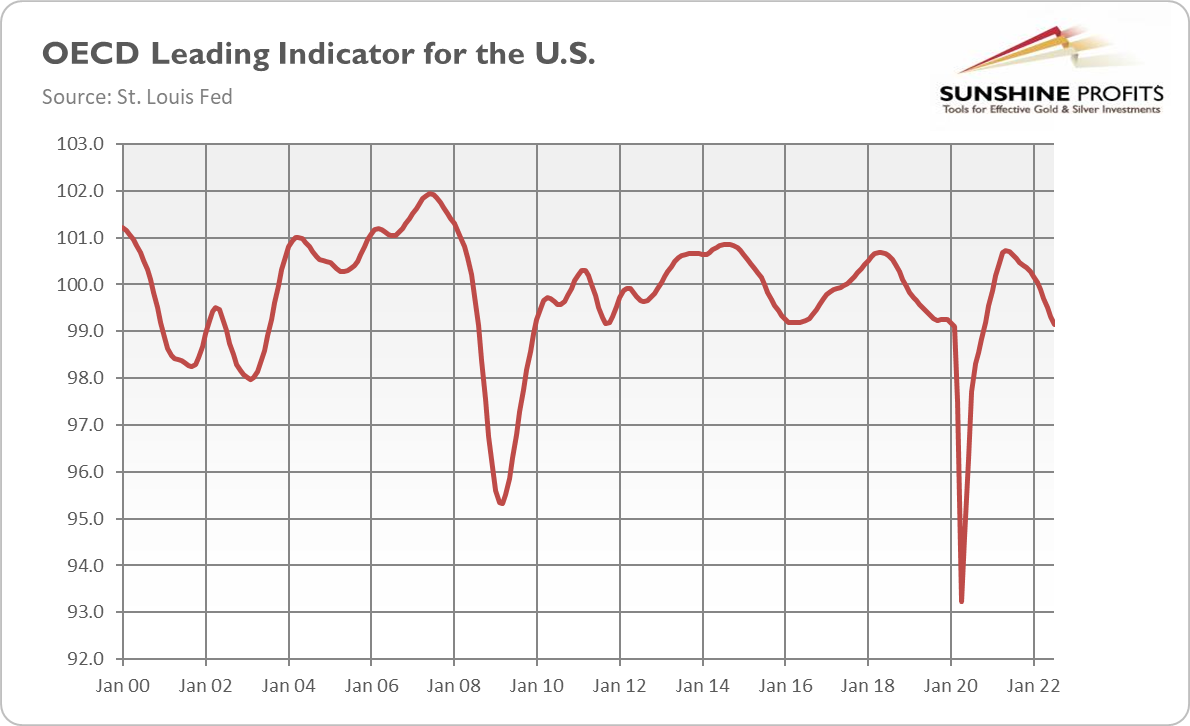
Indeed, the OECD’s leading indicator of U.S. economic activity has been on a decline for months, as the chart below shows, while the latest PMI data shows a steep fall in output across the US service sector and the fastest fall in activity since May 2020.
The S&P Global US Sector PMI is really worrisome, as it shows a broad-based contraction in the private sector:
US private sector firms signalled a broad-based decline in output during August, as all seven monitored sectors registered contractions in business activity. It was only the second time on record (since October 2009) that all sectors had seen a decrease in output, the first time having been in May 2020 during the initial wave of COVID-19.
No recession risk, huh? You see, the problem is that the economy is already on the brink of recession, but the Fed hasn’t yet shown its hawkish claws. What I mean here is that with the federal funds rate at about 3% and inflation at 8.3%, the real interest rates are still deeply negative, below minus 5%, and the fiscal policy is also accommodative (although less than last year).
Thus, as Daniel Lacalle puts it rightly, “it is impossible to create a monetary tsunami slashing rates and pumping trillions of newly printed dollars into the economy and expect it to correct with a small splash of water in the face. It is worse, it is impossible to create a soft landing with an overheated engine.”
Indeed, the Fed never managed to engineer a soft landing during such high inflation.
The tightening of monetary policy initially hits only the most interest rate-sensitive sectors, such as housing, but it will affect the entire economy ultimately. The Fed reacted to inflation too late, but now – because of this delay – it could overreact, given the state of the U.S. economy, pushing it into recession.The Fed may also overstate the level of liquidity in the markets. So far, financial conditions seem to be just fine, while markets have ample liquidity. However, liquidity is very tricky as there is plenty of it – until it isn’t! History teaches us that during financial crises, liquidity quickly evaporates. The strengthening dollar only aggravates the problem, as it’s draining global liquidity and tightening conditions violently for large parts of the international financial system.
Implications for Gold
What does it all mean for the gold market? Well, the Fed’s trap is fundamentally positive for the yellow metal. For now, the Fed remains relatively hawkish, which boosts the dollar and puts gold under downward pressure. However, when the unemployment rate starts to increase and the next economic crisis begins, the Fed will have to – as a lender of last resort – reverse its course and adopt a dovish stance again. Many analysts are skeptical about the dovish pivot, but this is exactly what history suggests, especially given the level of private and public debt.
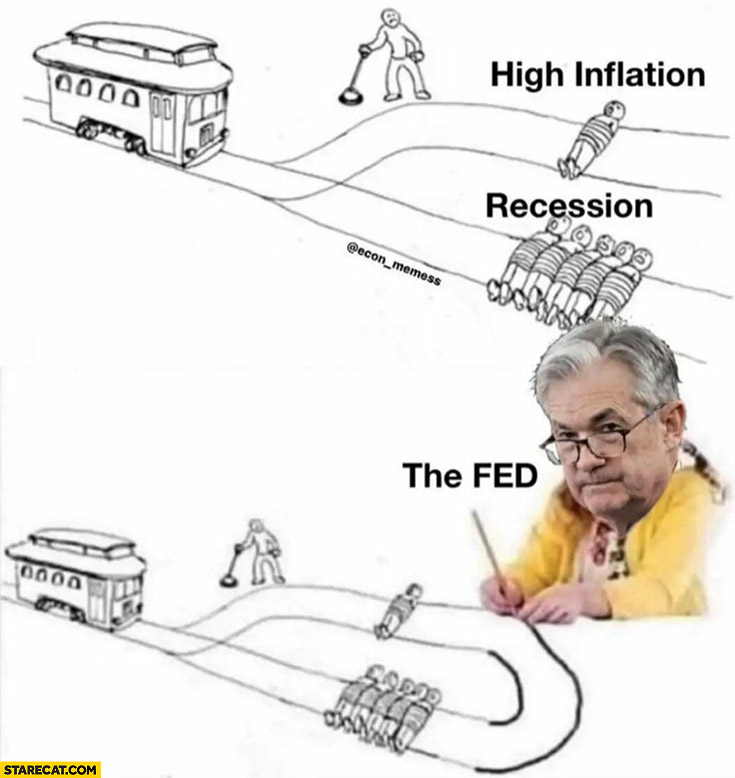
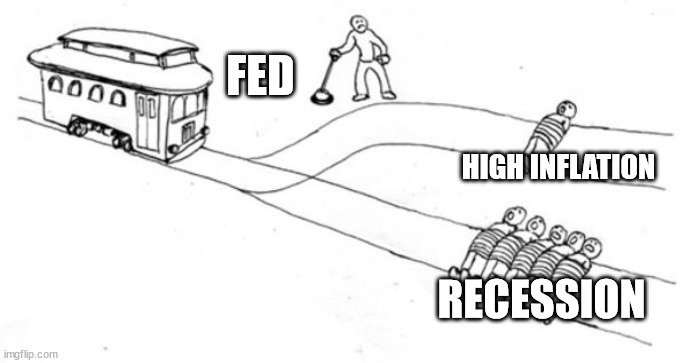
As recession is likely to be accompanied by still high inflation, the macroeconomic environment will be quite stagflationary, which should also support gold prices through low real interest rates and elevated demand for gold as an inflation hedge and a safe-haven asset. Additionally, in such an environment, there is a high chance that monetary policy will be “whipsawed, seemingly alternating between targeting lower inflation and higher growth, but with little success on either,” as Mohamed A. El-Erian puts it. This scenario is illustrated in the picture above, and it wouldn’t be good for the U.S. economy. But gold could finally shine then.
Thank you for reading today’s free analysis. If you enjoyed it, and would you like to know more about the links between the economic outlook, and the gold market, we invite you to read the October Gold Market Overview report. Please note that in addition to the above-mentioned free fundamental gold reports, and we provide premium daily Gold & Silver Trading Alerts with clear buy and sell signals. We provide these premium analyses also on a weekly basis in the form of Gold Investment Updates. In order to enjoy our gold analyses in their full scope, we invite you to subscribe today. If you’re not ready to subscribe yet though and are not on our gold mailing list yet, we urge you to sign up. It’s free and if you don’t like it, you can easily unsubscribe. Sign up today!
Arkadiusz Sieron, PhD
Sunshine Profits: Effective Investment through Diligence & Care.-----
Disclaimer: Please note that the aim of the above analysis is to discuss the likely long-term impact of the featured phenomenon on the price of gold and this analysis does not indicate (nor does it aim to do so) whether gold is likely to move higher or lower in the short- or medium term. In order to determine the latter, many additional factors need to be considered (i.e. sentiment, chart patterns, cycles, indicators, ratios, self-similar patterns and more) and we are taking them into account (and discussing the short- and medium-term outlook) in our Gold & Silver Trading Alerts.
-
The Queen Died, but King Dollar Lives On
September 30, 2022, 2:20 PMQueen Elizabeth II died, but King Dollar is the strongest in decades. Gold doesn’t like it.
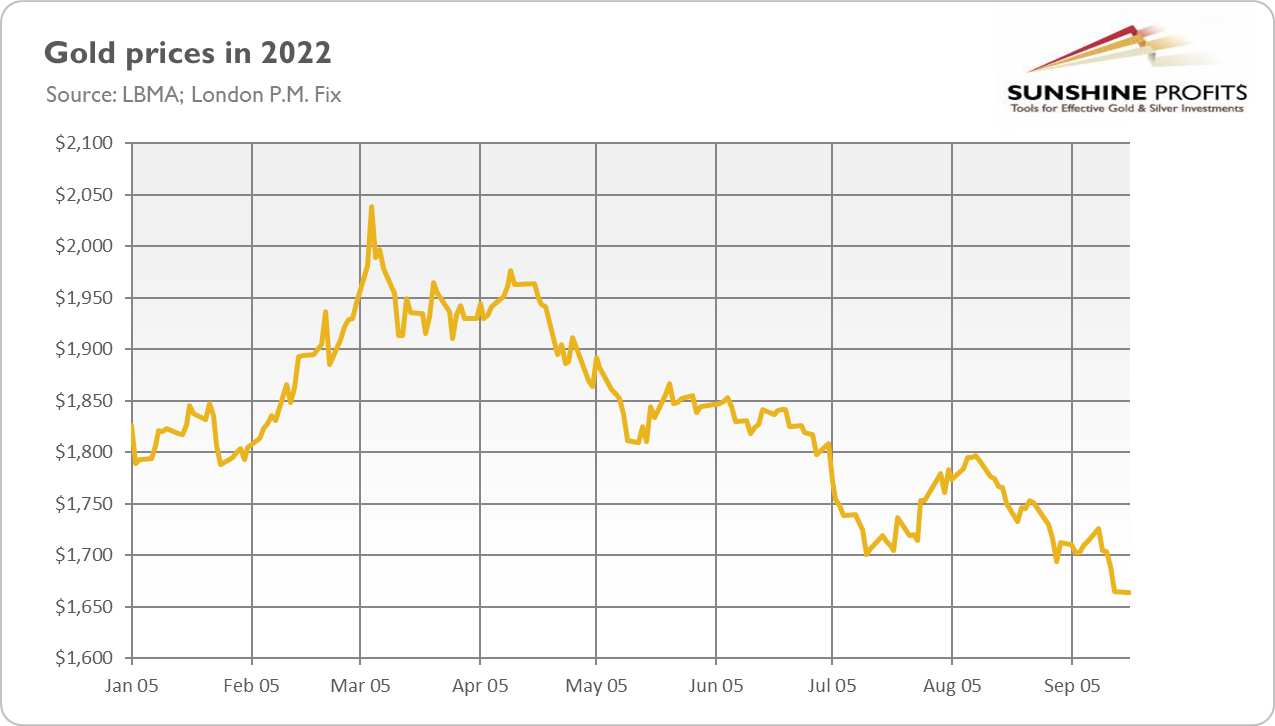
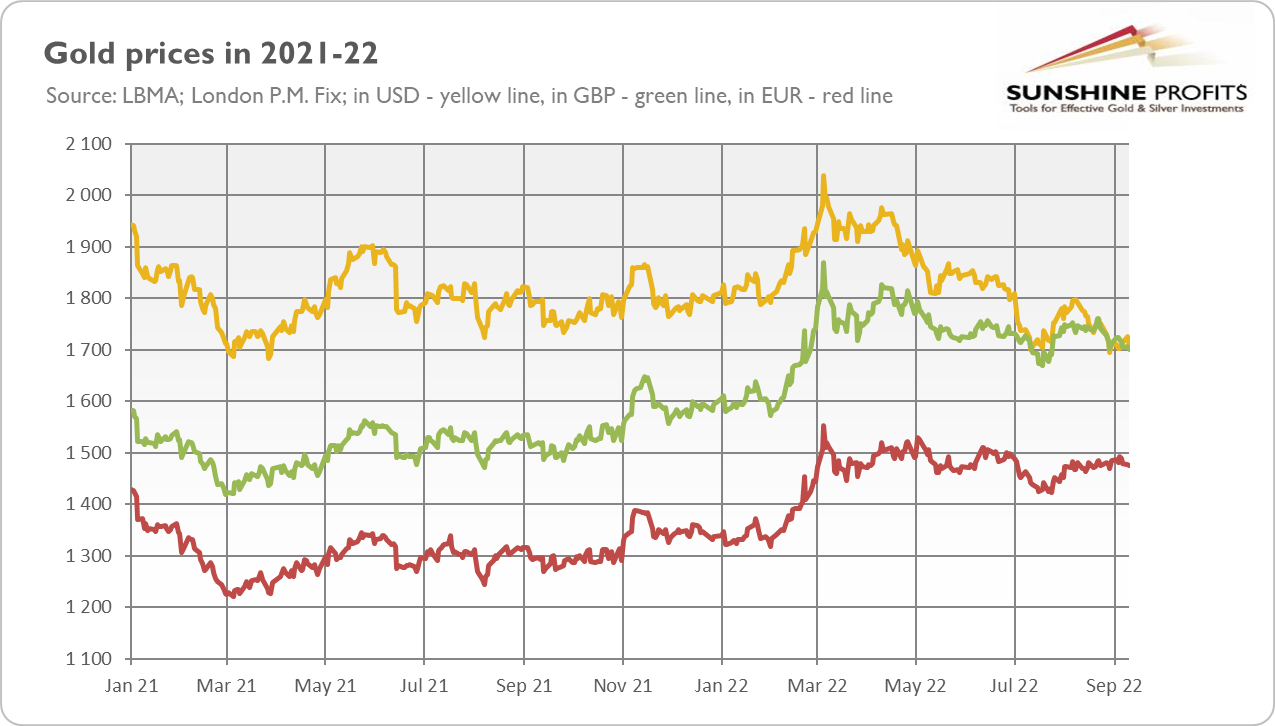
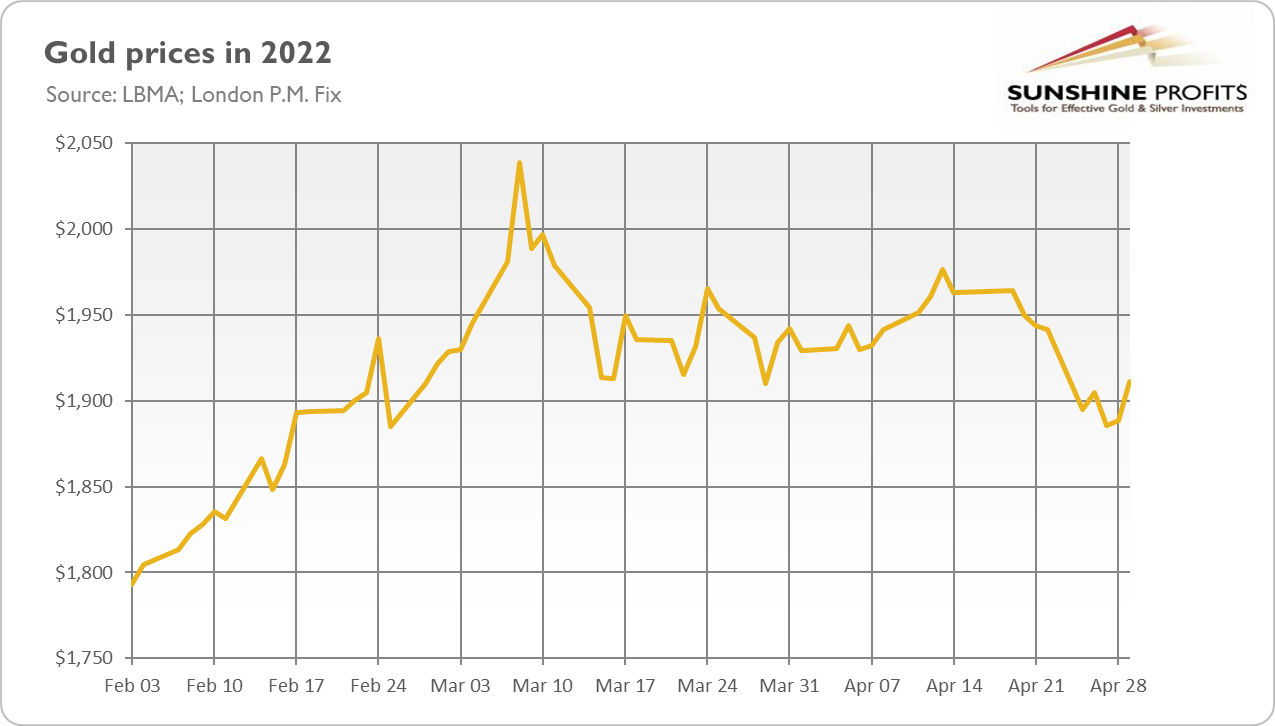
To say that gold has been struggling this year is an understatement. As the chart below shows, the price of the yellow metal declined from above $2,000 to below $1,700 (as of September 20). That slide occurred during the highest inflation since the great stagflation of the 1970s.
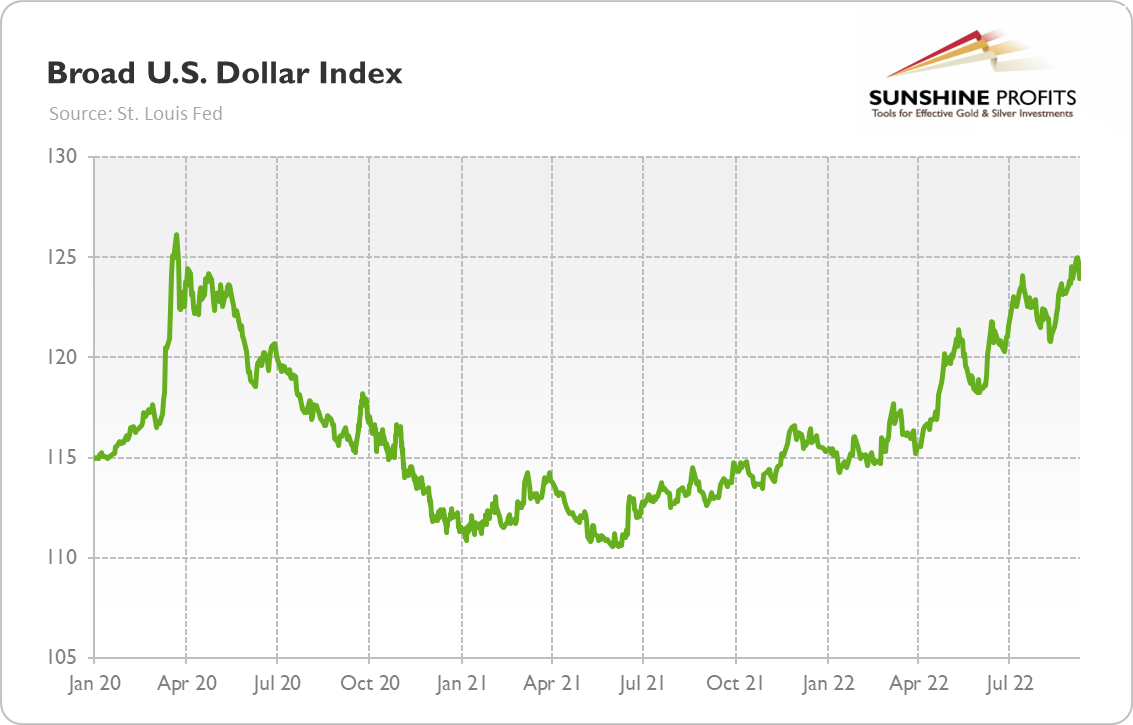
One of the headwinds blowing strongly in the gold market has been the strong greenback. As the chart below shows, the American currency has been appreciating since mid-2021. The broad U.S. dollar index rose from 110.5 in June 2021 to 124 right now, or more than 12%.
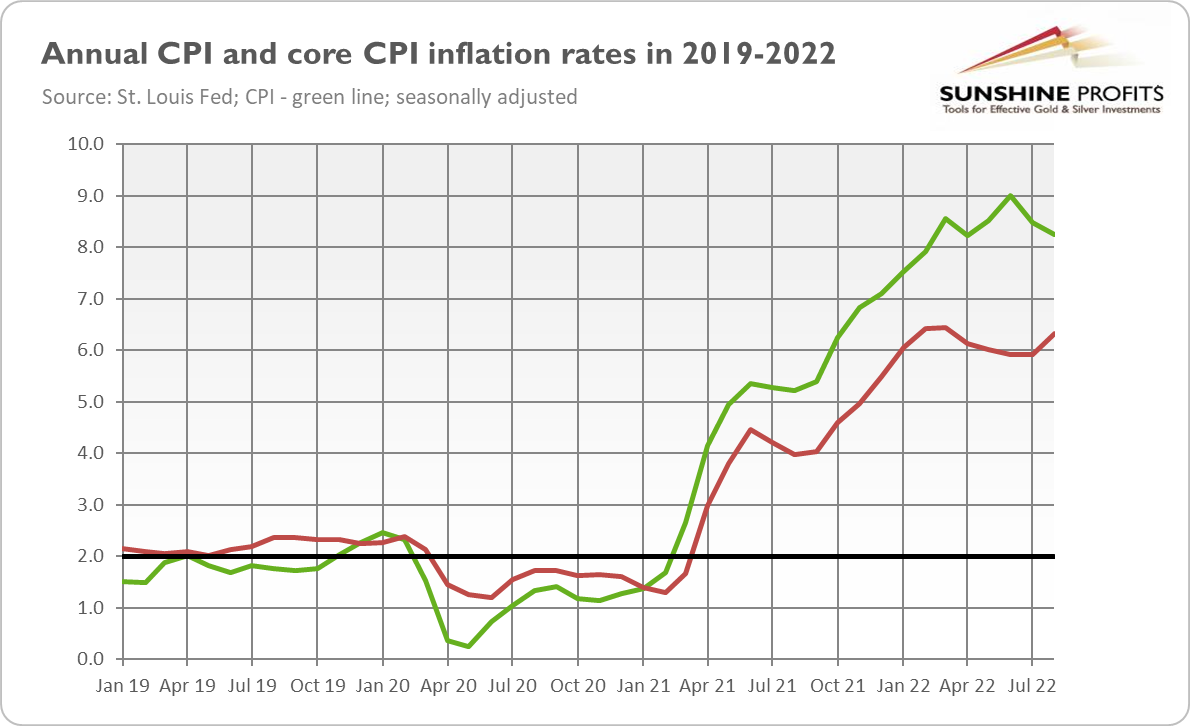
Wait, wait a second. The dollar strengthened during a period of high inflation (see the chart below) in which money is losing purchasing power. How could the currency gain and lose value at the same time? It doesn’t seem to make any sense.
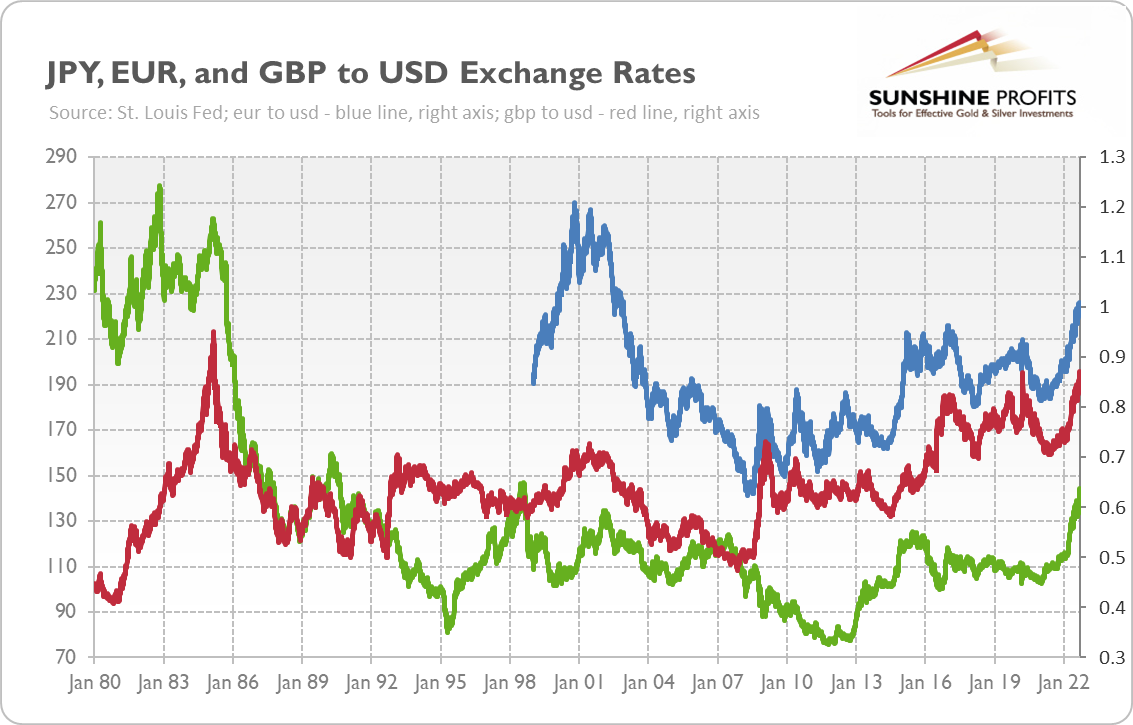
Nevertheless, it does. Because of inflation, the dollar is losing its internal purchasing power, i.e., how many real goods and services can we buy with these green pieces of paper? However, the exchange rate is about external purchasing power, i.e., how many pieces of paper with different symbols and signatures issued by foreign central banks we can buy. The answer is: more! As the chart below shows, the dollar is now near its highest levels in decades versus the British pound, the euro, and Japanese yen (please note that, for consistency, the chart paints the exchange rates as the dollar’s value in foreign currencies).
However, it doesn’t necessarily reflect the dollar’s greatness but the fact that other currencies have been even worse. As investors’ saying goes, the dollar is “the least-ugly mug in a beauty contest”. You see, the Fed was terribly delayed with its combat against inflation, but compared to other major central banks, such as the ECB and the Bank of Japan, it’s an uber-hawk that quickly stood up for a fight. Remember that exchange rates are all about relative values. For example, inflation in the euro area surpassed 5% in December 2021 and by now it has increased to about 9%, but the central bank didn’t lift its interest rates until July 2022.
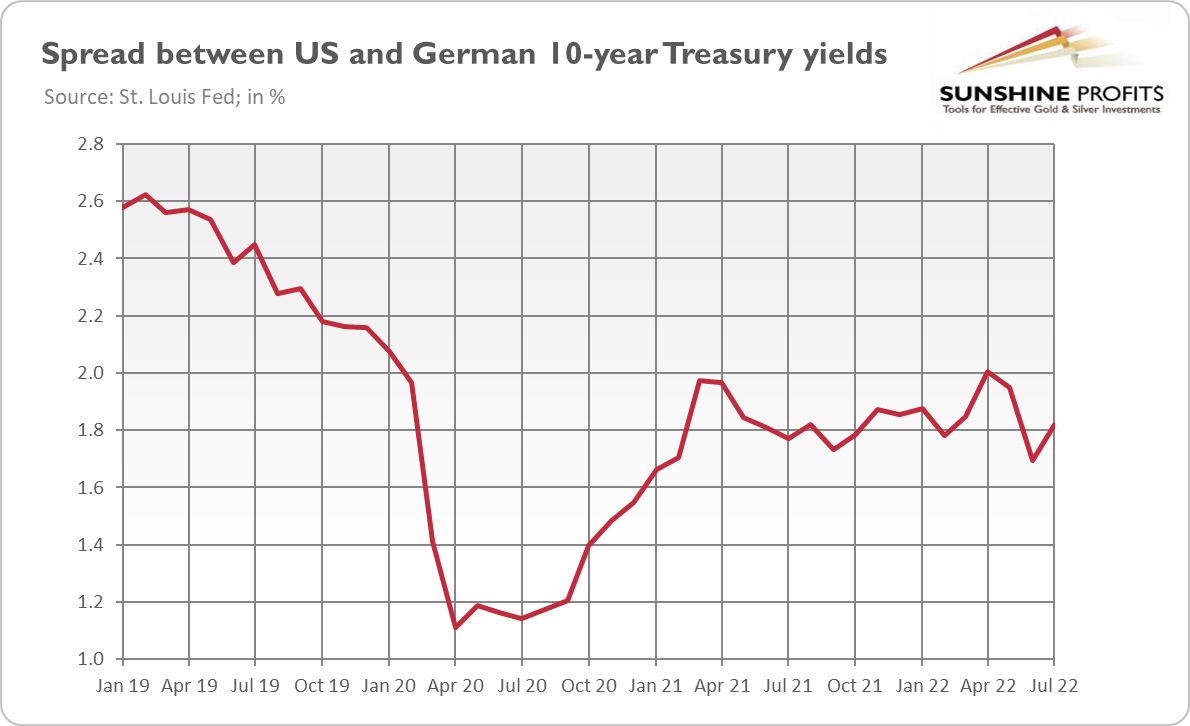
The faster and more decisive Fed’s reaction increased the divergence in monetary policies and interest rates (see the chart below) between the dollar and the euro, which strengthened the value of the former. The mechanism was simple: higher rates in America attracted money from all over the world, and as investors have been buying dollar-denominated assets, the value of the greenback has increased.
So far, so good. Now, the question is, what does a strong dollar imply for the global economy? Problems! Why? Well, maybe because about 30% of all S&P 500 companies’ revenues are earned abroad, a stronger dollar reduces the dollar’s value of these sales. Or maybe because many governments and companies have international debts denominated in dollars?
Hence, the stronger the dollar, the higher the debt to be repaid. According to the IMF, 60% of low-income countries are in or at high risk of government debt distress. Tighter financial conditions in the U.S. and a stronger dollar could only increase the pressure on countries with foreign debts. The dollar is America’s currency, but the emerging market’s troubles. Egypt, Pakistan, and Sri Lanka have already asked the IMF for help – and others may follow suit.
Please also note that about half of international trade is invoiced in dollars, which means that importers are facing higher costs not only because of inflation and supply-chain disruptions but also because of the stronger dollar.
What does the strong dollar mean for the gold market? It goes without saying that the recent appreciation of the greenback has weighed on gold prices. If not for the strong dollar, gold would have fared much better. Indeed, this year, the yellow metal lost about 6% of its value when measured in the U.S. dollar, but it gained 6.2% in euros and 9.3% in British pounds. Thus, maybe gold’s performance hasn’t been disappointing, but simply the greenback has been shining, and maybe gold is an inflation hedge, after all (but in other currencies than the US dollar)!
It gives hope that when the dollar weakens (for example, due to the start of the recession and the Fed’s pivot, or due to the end of the war in Ukraine), gold will start rallying eventually. It seems that the greatest part of the upward move in the greenback is already behind us.
The strong dollar could also trigger some economic turbulence, which could benefit the yellow metal. However, I wouldn’t bet that financial crises in emerging markets will induce a safe-haven demand for gold. Precious metals investors don’t care too much about other countries than the U.S. or Western Europe.
There is a true silver lining for gold bulls: one reason behind the appreciation of the dollar. The Fed’s tightening cycle is only one driver, but another is safe-haven inflows. Investors have been moving to the U.S. dollar not because it is so strong, but because of economic turmoil and recessionary risk. If so, gold could at some point (perhaps when the Fed pivots and adopts a dovish policy again) start to move in tandem with the greenback.
Thank you for reading today’s free analysis. If you enjoyed it, and would you like to know more about the links between the economic outlook, and the gold market, we invite you to read the October Gold Market Overview report. Please note that in addition to the above-mentioned free fundamental gold reports, and we provide premium daily Gold & Silver Trading Alerts with clear buy and sell signals. We provide these premium analyses also on a weekly basis in the form of Gold Investment Updates. In order to enjoy our gold analyses in their full scope, we invite you to subscribe today. If you’re not ready to subscribe yet though and are not on our gold mailing list yet, we urge you to sign up. It’s free and if you don’t like it, you can easily unsubscribe. Sign up today!
Arkadiusz Sieron, PhD
Sunshine Profits: Effective Investment through Diligence & Care.-----
Disclaimer: Please note that the aim of the above analysis is to discuss the likely long-term impact of the featured phenomenon on the price of gold and this analysis does not indicate (nor does it aim to do so) whether gold is likely to move higher or lower in the short- or medium term. In order to determine the latter, many additional factors need to be considered (i.e. sentiment, chart patterns, cycles, indicators, ratios, self-similar patterns and more) and we are taking them into account (and discussing the short- and medium-term outlook) in our Gold & Silver Trading Alerts.
-
All Gold and Quiet on the Eastern Front
September 23, 2022, 12:36 PMThe war in Ukraine has entered its seventh month and some people believe that China is gearing up for a war with Taiwan. Will bulls invade the gold market?
In August, half a year had passed since the beginning of the war in Eastern Europe. Ukraine defended its independence but lost 13% of its territory. The six months of war between Europe’s two largest nations have brought death and suffering on a mass scale. More than 13 million people have been displaced, and nearly 7 million refugees have dispersed across Europe. Ukraine’s economy collapsed while the prices of food and energy have soared.
What is the situation on the front? Unfortunately, the aggressor’s troops maintain a relatively stable land connection with Crimea and are slowly pushing the Ukrainian army from its positions in Donbas, the main area of combat. It means that taking control of the rest of the Donetsk Oblast by the Russians is probably a matter of time, although it may take several more months. The change in favor of the Ukrainians is possible only if the West significantly increases its military supplies, which would enable an effective Ukrainian counter-offensive. It’s true that the Ukrainian counter-offensive in the direction of Kherson in the south of the country is gaining momentum – in particular thanks to the supplies of HIMARS – but a full scale operation is unlikely due to a lack of manpower and weapons.

However, that happened, Russia would then have to decide whether to give up and withdraw its troops or to announce a universal draft and full mobilization, throwing all its potential into the fight. It would take war to a whole new level, which could boost gold prices, at least temporarily.
What are the possible scenarios for the war’s end? Well, given that Russia’s military capability is gradually decreasing and the country needs an operational pause to build up its forces, it would like to sit down at the negotiating table with the aim of taking control of Donbas. However, Ukrainians are not ready to make any territorial concessions. Thus, the Russians will likely continue to bombard Ukrainian cities and blackmail the whole world with the nuclear power plant in Zaporizhia, trying to force Ukraine to negotiate and accept some territorial losses.
What are the implications for gold? Well, the war shows that gold bulls shouldn’t count on geopolitical events. Although gold initially gained during the first phase of the conflict, the impact was short-lived, as the chart below shows. At this point, when the situation has stabilized somewhat, and the war of attrition could last another several months – if not years, as some experts believe – gold is unlikely to be significantly affected by the conflict. This may change, of course, if the conflict escalates, for example, to the nuclear field.
Or to the Far East. You see, the war is having effects beyond Eastern Europe. For Beijing, the balance of power with the U.S. is shifting in its favor, as Uncle Sam’s focus is on Ukraine. If you look at the direction in which China is now going, you can clearly see its preparation for a conflict outside its own country. This is a huge departure from the well-known doctrine that China defends itself only on its own territory. Beijing’s angry response to Nancy Pelosi’s visit to Taiwan, including unprecedented drills, is very telling.
Is an invasion of Taiwan likely? Well, “the complete reunification of the motherland” is an official policy of China. What has recently changed is only the fact that China has built and modernized an impressive army, reaching a point where it could actually achieve its goal. The timing would be quite good for China, given its economic slowdown, President Xi Jinping’s aspirations, and the ongoing war in Ukraine.
Such a military conflict could be even more impactful than the war in Ukraine. This is not only because Taiwan is a great semiconductor producer and an integral part of the Western tech industry, but also because, unlike with Ukraine, the U.S. government hasn’t ruled out direct intervention to protect Taiwan. Actually, Uncle Sam, together with Japan and Australia, has verbal agreements to intervene militarily in the case of China’s attack. Hence, it could trigger WW3.
Given the fact that Taiwan is an island that could be quickly blocked by China, the U.S. and its allies wouldn’t be able to choose a middle ground and deliver weapons to Taiwan through neighboring countries like in the case of Ukraine. They would either give up Taiwan or engage in a full-scale military operation. Hence, the price of gold could react more vividly to the invasion of Taiwan than to the invasion of Ukraine.
However, Beijing is unlikely to launch a full-scale invasion of Taiwan in the near future, as China possesses only a fraction of the necessary ships to execute an amphibious assault. Moreover, the possible landing sites on the west coast are blocked by nearby mountains, and the island lacks the infrastructure to support invaders. Instead, China could choose options other than a full-scale amphibious invasion. It won’t be equally positive for gold prices, but the yellow metal could still gain somewhat, at least for a while.
The bottom line is that the war in Ukraine could last for several more months. However, gold bulls shouldn’t count that gold will benefit from it. The yellow metal could gain more only if the conflict escalates either to the nuclear field or to the Far East, with China’s attempt to invade Taiwan. However, both these scenarios remain unlikely, and even if they happen, their impact on gold should be only temporary. Fundamental factors are much more important for the long-term outlook of gold than geopolitical ones.
Thank you for reading today’s free analysis. If you enjoyed it, and would you like to know more about the links between the economic outlook, and the gold market, we invite you to read the September Gold Market Overview report. Please note that in addition to the above-mentioned free fundamental gold reports, and we provide premium daily Gold & Silver Trading Alerts with clear buy and sell signals. We provide these premium analyses also on a weekly basis in the form of Gold Investment Updates. In order to enjoy our gold analyses in their full scope, we invite you to subscribe today. If you’re not ready to subscribe yet though and are not on our gold mailing list yet, we urge you to sign up. It’s free and if you don’t like it, you can easily unsubscribe. Sign up today!
Arkadiusz Sieron, PhD
Sunshine Profits: Effective Investment through Diligence & Care.-----
Disclaimer: Please note that the aim of the above analysis is to discuss the likely long-term impact of the featured phenomenon on the price of gold and this analysis does not indicate (nor does it aim to do so) whether gold is likely to move higher or lower in the short- or medium term. In order to determine the latter, many additional factors need to be considered (i.e. sentiment, chart patterns, cycles, indicators, ratios, self-similar patterns and more) and we are taking them into account (and discussing the short- and medium-term outlook) in our Gold & Silver Trading Alerts.
-
Gold Wonders How Severe This Recession Will Be
September 9, 2022, 9:56 AMEconomic contraction is unfolding – but how painful will it be? The deeper the recession, the better for gold.
Let’s make it clear: an economic downturn is coming. We are already in a technical recession (GDP contracted in the first two quarters of this year), despite the White House’s attempts to change its definition.
A full-blown recession is just around the corner and will likely come out next year. At this point, another question is more interesting: how long will the pain last? Or, how deep will the contraction be? Will it be a short and shallow recession like in 1990-91 or in 2001, or a long and severe one like the Great Recession? Or maybe a short but deep one like the pandemic recession of 2020?
I don’t know . I forgot to take my crystal ball. However, I would exclude the last possibility, as the latest recession was mainly caused by the Great Lockdown – this is why it was so deep and short. This recession will be more normal – as long as recessions have anything to do with normality.
Actually, this won’t be a normal recession, as it will be accompanied by high inflation, which implies that we will experience stagflation. This is a strong argument for a deep recession. Why?
Well, the Fed is already engineering a recession (although Powell prefers talking about bringing demand and supply into balance) to slow inflation. Given how high inflation remains and how long the U.S. central bank has been in denial and inaction, it will have to continue its unprecedentedly large interest rate hikes. Such an aggressive tightening cycle could lead to a serious economic decline.
This is also what history suggests. There was no period of such high inflation that didn’t lead to a severe recession. There was a long recession in 1973-1975 and later a double-dip recession in the early 1980s. The recession of 1990-91 was milder, but inflation was lower, while the Fed’s reaction to it was faster.
Another argument that strengthens the pessimistic view is the size of monetary stimulus during the boom phase of this business cycle. The broad money supply increased by more than one fourth in 2020 in a response to the pandemic (see the chart below), as the central and commercial banks created trillions of dollars to tranquilize the population into accepting lockdowns. However, the higher the flight, the more painful the fall will be.
Last but not least, there is a lot of debt accumulated in the economy. The public debt is $30.6 trillion, or 124.7% of GDP, and there is also the private debt, which is actually larger than the public.
Thanks to recent declines, asset valuations are less stretched, but the financial system remains fragile. It’s true that banks are now in better shape than before the financial crisis of 2007-2009 and that they were rather unaffected by the pandemic. Hence, the replay of the Great Recession – when banks were severely hit, which resulted in a credit crunch – doesn’t have to occur.
However, there is so much debt that hikes in interest rates and withdrawal of liquidity in the form of quantitative tightening – not to mention any sudden events – could trigger a financial crash or an economic crisis.
What does it all mean for the gold market? Well, the mild recession, not to mention a soft landing, would be a relatively negative scenario for the yellow metal. It could still gain somewhat, but markets are forward-looking and when a recession is shallow, they would anticipate a quick recovery (which would rather support equities and other risky assets). The mild recession would also allow the Fed to stay relatively calm and to not fire all the monetary ammunition – while gold would prefer the U.S. central bank to go fully dovish.
On the other hand, a deep recession would be much better for gold. During severe economic downturns, moods are really pessimistic, and risk aversion is high. Hence, investors shift into safe-haven assets such as gold. What’s more, the Fed would then break out all available weapons to avoid a full economic catastrophe, even in the face of high inflation. This would create excellent conditions for gold to rally.
If a deep recession is accompanied by a financial crisis or sovereign-debt crisis, when confidence in a financial system and fiat money is ultra low, it would be a really perfect scenario for the yellow metal.
Which scenario is most likely? Given how high inflation is and how (relatively) aggressive the Fed’s tightening cycle is in response to price instability – the federal funds rate is historically still low, but the increase from 0-0.25 to 2.25-2.50% is huge in percentage terms (1800%) – I bet on a deep recession. It’s true that the boom phase was short, so not many malinvestments had time to show up, but there are many erroneous projects accumulated in the 2010s that were never corrected (some analysts even say about everything bubble).
A lot will depend on the path of inflation. If inflation decelerates relatively quickly and to an acceptable level, the Fed could announce a triumph over the inflationary beast (at least in the first battle) and reverse or at least pause interest rate hikes. Then, a recession could be relatively mild while its support for gold is positive but limited. However, if inflation remains stubbornly high, the Fed could continue its hiking cycle, which could trigger a potentially severe recession and make gold shine really bright.
Thank you for reading today’s free analysis. If you enjoyed it, and would you like to know more about the links between the economic outlook, and the gold market, we invite you to read the September Gold Market Overview report. Please note that in addition to the above-mentioned free fundamental gold reports, and we provide premium daily Gold & Silver Trading Alerts with clear buy and sell signals. We provide these premium analyses also on a weekly basis in the form of Gold Investment Updates. In order to enjoy our gold analyses in their full scope, we invite you to subscribe today. If you’re not ready to subscribe yet though and are not on our gold mailing list yet, we urge you to sign up. It’s free and if you don’t like it, you can easily unsubscribe. Sign up today!
Arkadiusz Sieron, PhD
Sunshine Profits: Effective Investment through Diligence & Care.-----
Disclaimer: Please note that the aim of the above analysis is to discuss the likely long-term impact of the featured phenomenon on the price of gold and this analysis does not indicate (nor does it aim to do so) whether gold is likely to move higher or lower in the short- or medium term. In order to determine the latter, many additional factors need to be considered (i.e. sentiment, chart patterns, cycles, indicators, ratios, self-similar patterns and more) and we are taking them into account (and discussing the short- and medium-term outlook) in our Gold & Silver Trading Alerts.
-
After a July Slowdown, Has Inflation Finally Peaked?
September 2, 2022, 12:48 PMInflation moderated a bit in July, fueling hopes that it has peaked. Are they justified?
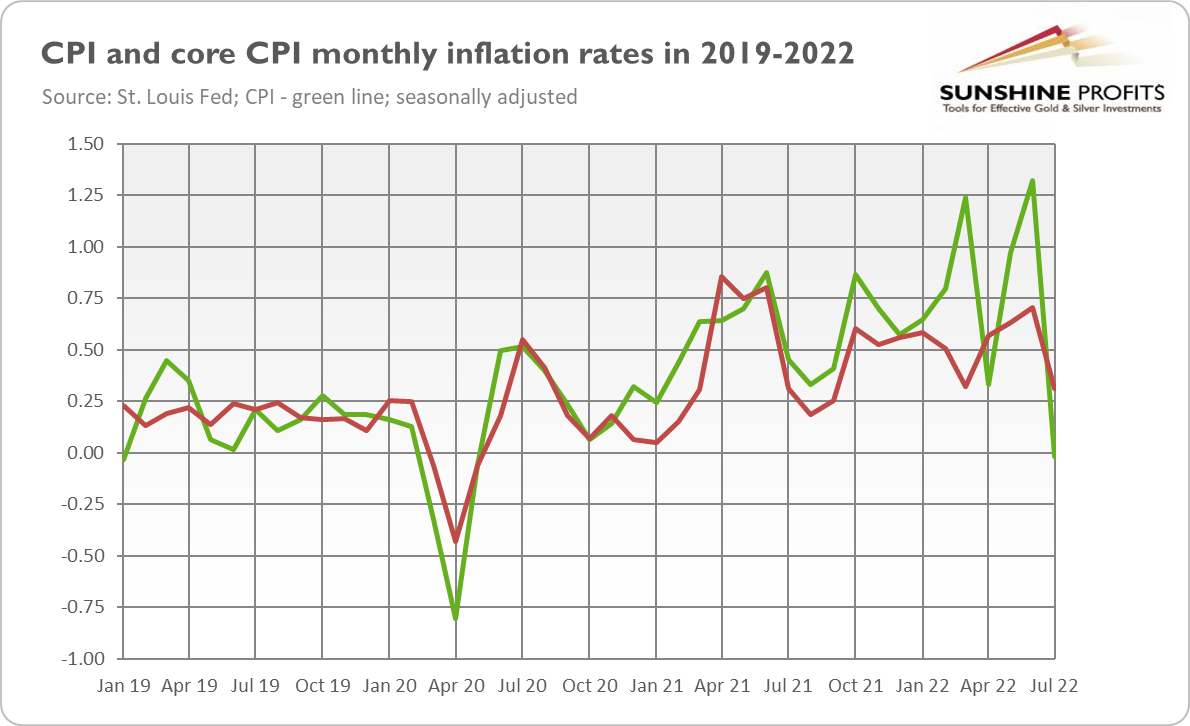
Yes and no, but before I elaborate on this enigmatic answer, let’s see what happened in July. On a monthly basis, the CPI was unchanged then, after rising 1.3 percent in June, as the chart below shows. The core CPI, which excludes food and energy prices, didn’t come flat, but it still decelerated from 0.7% in June to 0.3% in July, according to the BLS.
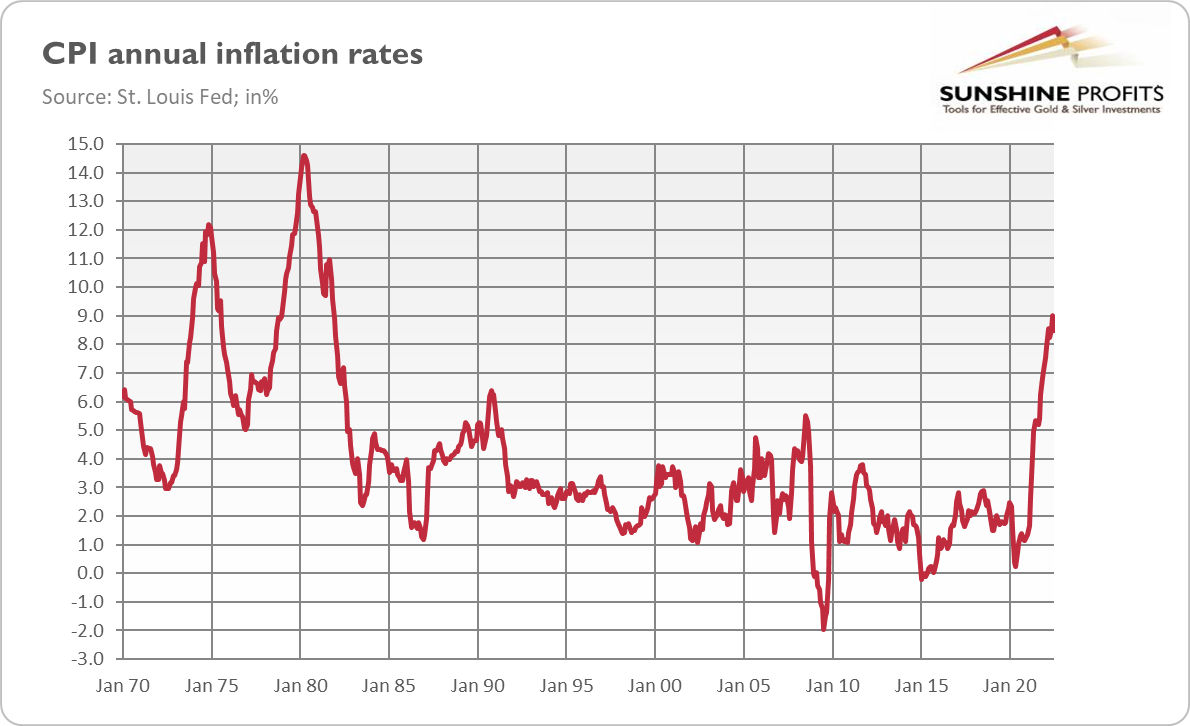
The price hikes also took a breather on an annual basis. As the next chart shows, the seasonally adjusted rate of increase in the CPI slowed down from 9% in June to 8.5% in July.
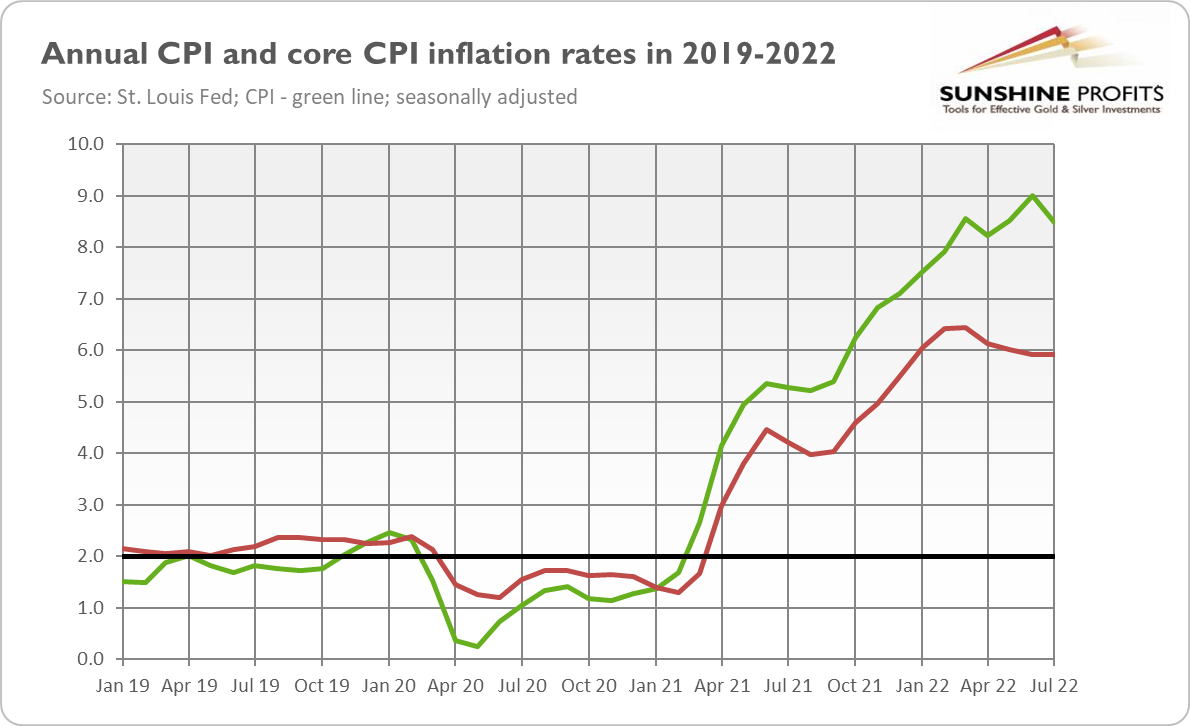
Meanwhile, the core CPI rose 5.9%, the same pace as in the previous month. This is due to a 10.9 percent increase in the food index over the last year, the largest 12-month increase since the period ending May 1979. What’s important is that the headline inflation readings came better than the markets and analysts expected.
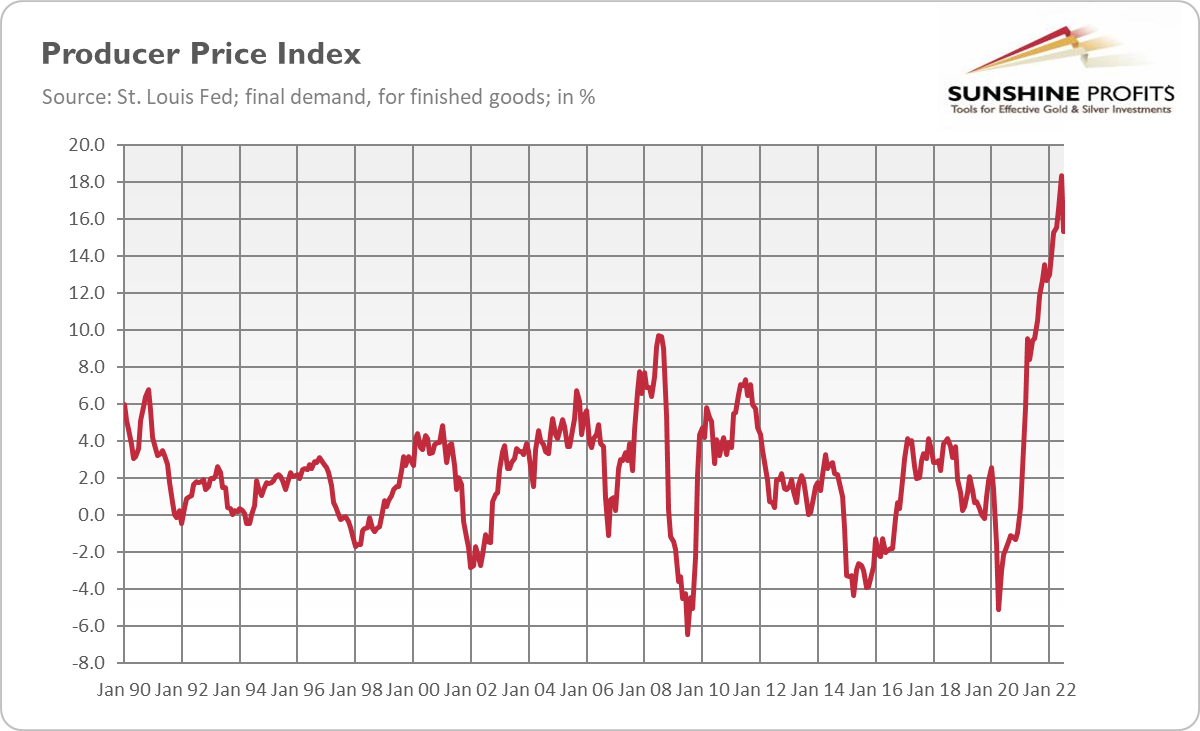
Does it all mean that inflation has already peaked? Yes, it’s possible, at least in the short-term. After all, the Producer Price Inflation (for finished goods) has also moderated recently. As shown in the chart below, the annual PPI rate of change rose 15.3% in July, down from 18.3% in June.
What’s more, the slowing economy coupled with the Fed’s tightening cycle could negatively affect the demand side of the economy and, thus, curb inflation. Additionally, some of the supply problems have already been resolved, while the rate of increases in the money supply has returned to a more normal level than seen before the pandemic. As one can see in the chart below, the pace of M2 money supply growth has peaked at 27% in February 2021 and since then it has decelerated below 6%.
Moreover, the monetary base has declined 8.6% in June 2022 over the last twelve months, while fiscal deficits have normalized, although at high levels.
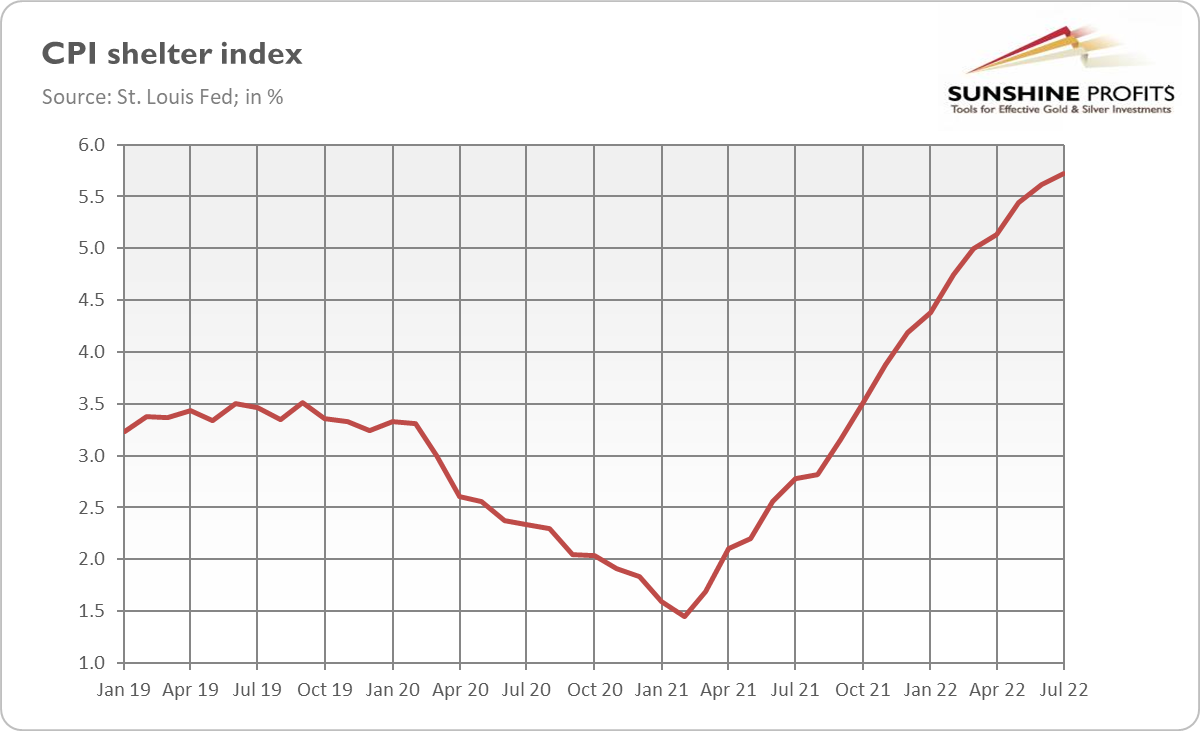
However, it’s also possible that inflation hasn’t peaked yet. There is still strong inflationary pressure, and monetary forces operate with a significant lag. What worries me is the rising home prices (which are reflected in the CPI with a lag) and shelter costs. As the chart below shows, the CPI shelter subindex accelerated slightly from 5.6% in June to 5.7% in July. It’s really disturbing, as shelter costs are the biggest component of the CPI. They are also stickier and harder to fix than other constituents of inflation.
More generally, one month of moderation is not enough to draw any sensible conclusions about the future path of inflation, as there are always ups and downs on the way as a part of normal economic volatility. The Fed is still behind the inflation curve.
The key argument against prematurely celebrating the victory over inflation is that not all the newly created money during the pandemic has already shown up in inflation. Why? This is because people buried it in the backyard. Actually, they didn’t bury it but stashed money in their bank accounts. However, the economic effect is similar: the fresh money hasn’t been fully spent and translated into higher prices. When people spend all these excess savings, inflation will get a second boost.
Additionally, according to the Bank of International Settlements, “as inflation rises, it naturally becomes more of a focal point for agents and induces behavioural changes that tend to entrench it.” In other words, inflation has risen so much that it could become more persistent as self-feeding dynamics kick in. It means that “we may be reaching a tipping point, beyond which an inflationary psychology spreads and becomes entrenched.”
What does it imply? Well, as the main drivers are fading, inflation is likely to moderate somewhat in the near future. The local peak is near or it’s already been achieved. However, inflation is likely to stay elevated for some time. Actually, the top half of the population by wealth still has some excess savings. When people tap into them, inflation could accelerate again. I’m not saying that inflation rates will continue to rise, reaching double-digit values. My claim is that inflation hasn’t said its last word yet.
What does it all mean for the gold market? Well, the July deceleration in inflation is good news for the gold market because it may prompt the Fed to adopt a more dovish monetary policy. However, inflation is still obscenely high, which will force the U.S. central bank to continue its interest rate hikes and quantitative tightening. The second bout of inflation, if it happens, will only reinforce the hawkish stance of the Fed. But even without it, the central bank will continue its current monetary policy, unless there is a strong and decisive slide in inflation rates. The following increase in real interest rates would be negative for gold prices. However, the Fed’s monetary policy would lead at some point to recession or even to stagflation, which should make gold rally.
Thank you for reading today’s free analysis. If you enjoyed it, and would you like to know more about the links between the economic outlook, and the gold market, we invite you to read the September Gold Market Overview report. Please note that in addition to the above-mentioned free fundamental gold reports, and we provide premium daily Gold & Silver Trading Alerts with clear buy and sell signals. We provide these premium analyses also on a weekly basis in the form of Gold Investment Updates. In order to enjoy our gold analyses in their full scope, we invite you to subscribe today. If you’re not ready to subscribe yet though and are not on our gold mailing list yet, we urge you to sign up. It’s free and if you don’t like it, you can easily unsubscribe. Sign up today!
Arkadiusz Sieron, PhD
Sunshine Profits: Effective Investment through Diligence & Care.-----
Disclaimer: Please note that the aim of the above analysis is to discuss the likely long-term impact of the featured phenomenon on the price of gold and this analysis does not indicate (nor does it aim to do so) whether gold is likely to move higher or lower in the short- or medium term. In order to determine the latter, many additional factors need to be considered (i.e. sentiment, chart patterns, cycles, indicators, ratios, self-similar patterns and more) and we are taking them into account (and discussing the short- and medium-term outlook) in our Gold & Silver Trading Alerts.
-
Gold Sees Light at the End of the Fed’s Tightening Tunnel
August 26, 2022, 11:32 AMThe FOMC hiked rates by 75 basis points in July. However, the recession drums are getting louder, and gold likes such music.
Another large interest rate hike! The Fed raised the federal funds rate by 75 basis points to 2.25-2.50%. It was the second such big move in a row, making the current tightening cycle the steepest in modern history. So, the Fed must be hawkish now, right?
Well, not necessarily. The Fed is tightening its monetary policy – and it’s doing it relatively fast. That’s true. However, the Fed hasn’t turned hawkish or restrictive yet. You see, the Fed raised rates to a merely neutral level – and to “neutral” only in the very specific meaning of “the projected appropriate target range for the federal funds rate over the longer run” (according to the latest dot-plot). However, according to the Taylor rule, the federal funds rate should be around 7% (the median) or at least 4.7%.
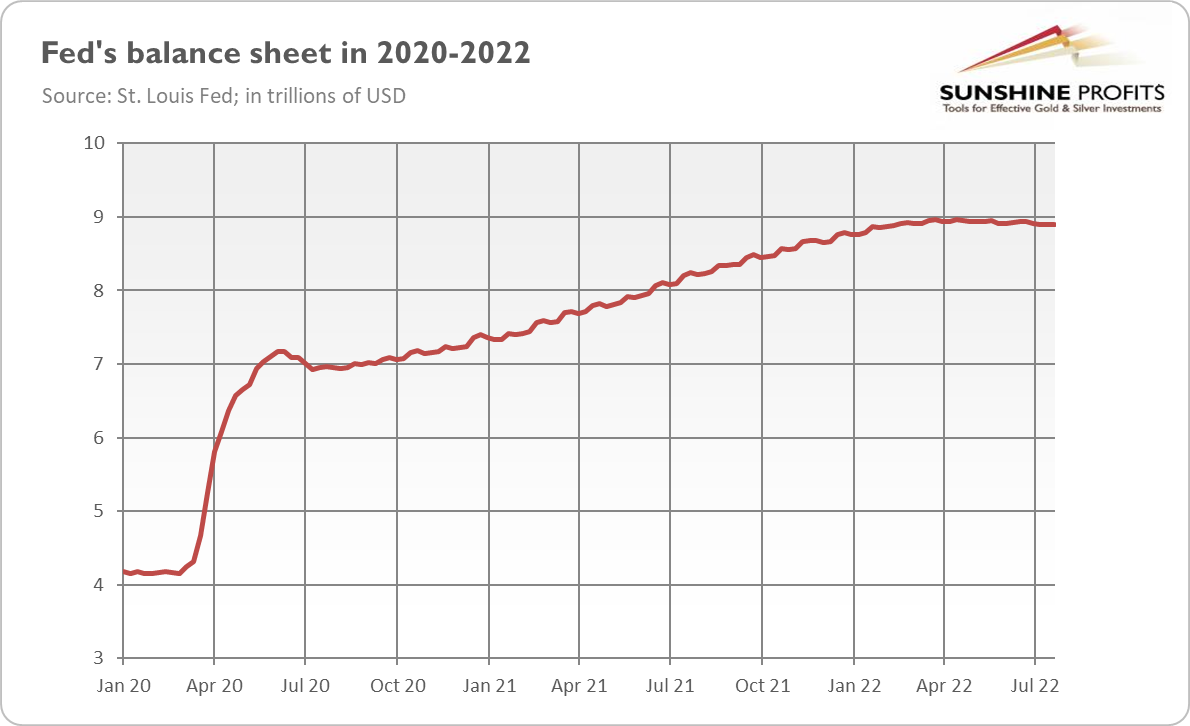
Hence, despite all the hawkish rhetoric, so far, the Fed has lifted interest rates from extremely accommodating rates to moderately accommodative levels. There is still much to go to reach restrictive levels. This is bad news for gold, which generally doesn’t like rising interest rates. As the chart below shows, the Fed’s balance sheet has barely declined in recent weeks, despite the beginning of the quantitative tightening.
However, it shouldn’t be long before the Fed throws in the towel and eases its stance again. In the July monetary policy statement, the FOMC admitted that “recent indicators of spending and production have softened,” and during the press conference, Powell signaled that the pace of increases will likely slow down in the near future. Additionally, the Fed got rid of its forward guidance. Then Powell said: “We think it's time to just go on a meeting by meeting basis, and not provide the kind of clear guidance that we did on the way to neutral,” which indicates that the US central bank is very uncertain about the state of the US economy. The Fed could have provided a decisive hawkish path of rate hikes – instead, it will be data-dependent. It suggests that the Fed is worried about the recession and is preparing a justification for a dovish turn.
Last but definitely not least, the American economy has already entered a technical recession, as defined as a period of two quarters with negative economic growth. According to the Bureau of Economic Analysis, the U.S. GDP dropped 0.9% in Q2, following a 1.6% contraction in Q1. And please remember that the full effect of interest rate hikes hasn’t been felt by the economy yet. Hence, the odds of soft landing have decreased – and Powell admitted it, saying: “We know that the path [to soft landing] has clearly narrowed, really based on events that are outside of our control. And it may narrow further.”
The only thing that makes the Fed feel quite comfortable when tightening its monetary policy stance is that the unemployment rate remains very low. However, the labor market is in worse condition than the unemployment rate suggests. Moreover, the unemployment rate is a lagging indicator. Thus, if economic news worsens, especially that related to the labor market, the Fed may pivot and return to a very accommodative stance. Actually, as the chart below shows, the federal funds rate is at the same target range of 2.25-2.50% seen in 2019, when the Fed ended its previous tightening cycle and started to cut interest rates.
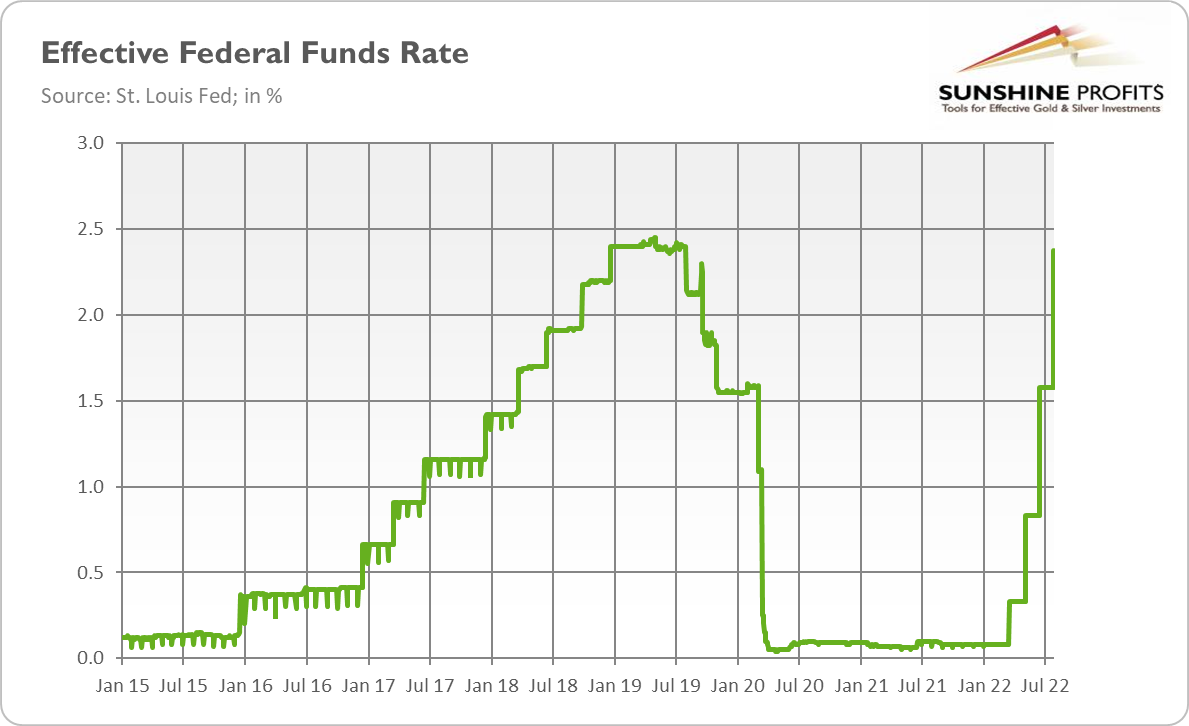
Of course, inflation is now much higher, so the rates could go up in a more decisive way. However, it could be difficult for the heavily indebted and financially fragile economy to stomach much higher interest rates. My bet is that the Fed could raise the federal funds rate three more times by 50 basis points at best. Then it would reach its predicted level for 2023 in the last dot-plot. Given that the economy has already weakened significantly since the time of this projection, I wouldn’t be surprised if the Fed stopped its tightening cycle earlier, for example, after only two 50 basis point hikes. It could be hard to justify interest rate cuts with such high inflation, but if inflation peaks and there is disinflation, the US central bank could at least pause hikes and adopt a more dovish rhetoric. In other words, the Fed could pull the lever and divert a runaway trolley from ‘recession’, sacrificing rather high inflation than a deep recession.
What does it all mean for the gold market? Well, the US economy is going to slow down, but that doesn’t automatically mean that the Fed will bring inflation under control. Rather, we could have stagflation, which should be positive for gold prices. The July FOMC meeting could be a game-changer for gold. This is because it was the first meeting in months that wasn’t unequivocally hawkish but included some dovish signals, mainly because of the economic slowdown (or recession). In other words, there is a light at the end of this tightening tunnel. The light that could make gold shine. The deteriorating macroeconomic outlook should boost safe-haven demand for gold, while a very steep pace of hikes (that is going to slow down soon) could make gold find its bottom and start its next rally.
Thank you for reading today’s free analysis. If you enjoyed it, and would you like to know more about the links between the economic outlook, and the gold market, we invite you to read the August Gold Market Overview report. Please note that in addition to the above-mentioned free fundamental gold reports, and we provide premium daily Gold & Silver Trading Alerts with clear buy and sell signals. We provide these premium analyses also on a weekly basis in the form of Gold Investment Updates. In order to enjoy our gold analyses in their full scope, we invite you to subscribe today. If you’re not ready to subscribe yet though and are not on our gold mailing list yet, we urge you to sign up. It’s free and if you don’t like it, you can easily unsubscribe. Sign up today!
Arkadiusz Sieron, PhD
Sunshine Profits: Effective Investment through Diligence & Care.-----
Disclaimer: Please note that the aim of the above analysis is to discuss the likely long-term impact of the featured phenomenon on the price of gold and this analysis does not indicate (nor does it aim to do so) whether gold is likely to move higher or lower in the short- or medium term. In order to determine the latter, many additional factors need to be considered (i.e. sentiment, chart patterns, cycles, indicators, ratios, self-similar patterns and more) and we are taking them into account (and discussing the short- and medium-term outlook) in our Gold & Silver Trading Alerts.
-
2022 Doesn’t Have to Be Like 1980 for Gold
August 19, 2022, 1:58 PMA recession is coming – but will it really be positive for gold? After all, the yellow metal plunged in 1980, despite an economic downturn.
Everyone says that the upcoming recession and stagflation will be good for gold. However, will they really? Some doubts also arose in my mind, so let’s investigate them. I, of course, don’t dispute that gold soared in the 1970s. This is a fact which is illustrated nicely by the chart below.
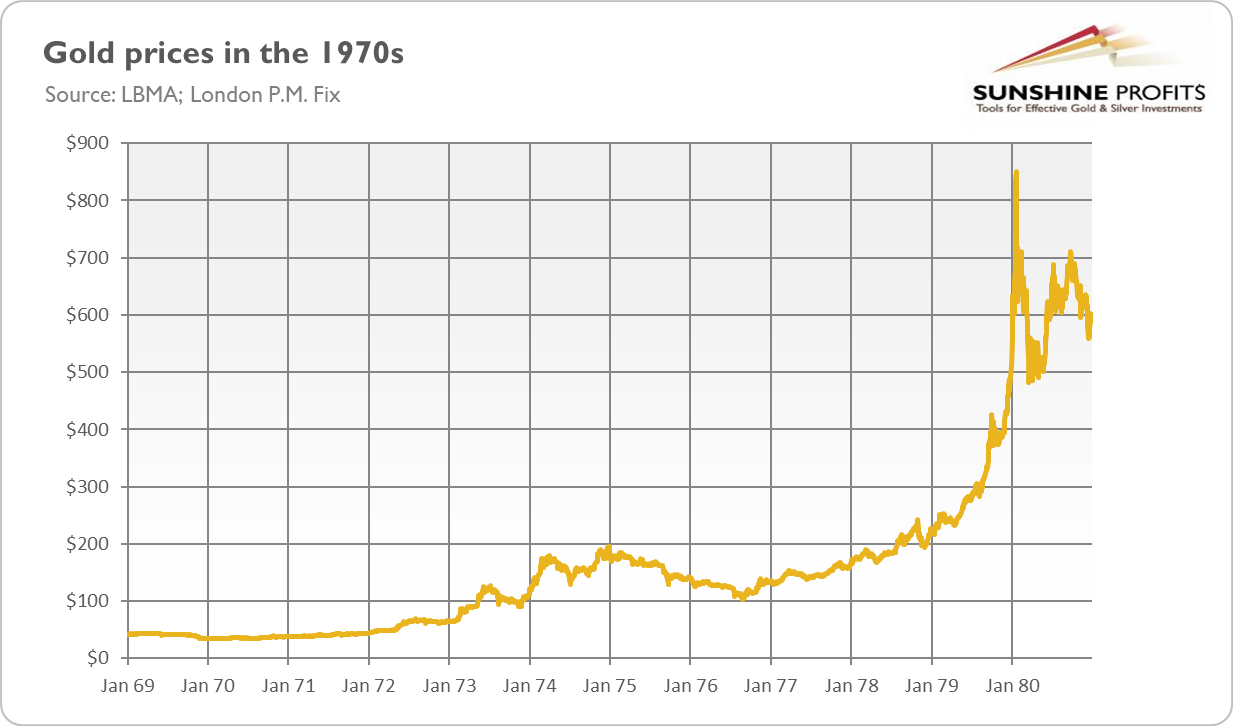
But was it really caused by stagflation, or was it just a time coincidence? What I mean here is that the 1970s were a special time, the end of Breton Woods. In 1971, Nixon ended the gold window, and the price of gold was allowed to fluctuate freely. Under the gold standard, the US dollar was defined as 13.71 grains of gold, which implied that it was convertible to gold at the fixed rate of $35 per ounce. However, such a fixed exchange rate (technically, it wasn’t an exchange rate as the dollar was defined in terms of gold) was introduced in 1934, and since then the dollar had been losing its purchasing power. Hence, the rally in gold prices after the convertibility was ended was completely natural and could have had a limited relationship with the rampant inflation. The peg was artificially high for years, so the dollar was overvalued while gold was undervalued.
Another issue is that in the 1970s, the world moved into a new world of completely fiat, floating currencies, so there was a lot of concern and a safe-haven demand for gold. In short, the 1970s were a very special time in which several bullish factors occurred, boosting gold prices. But some of these drivers won’t be present in the 2020s, as the fiat monetary system is well established today, while in the 1970s it was in its infancy. You can’t break the gold standard twice.
That’s true, but there were bull markets in gold also in the 2000s and in 2019-2020, even though some factors characteristic of the 1970s were absent. Moreover, it’s very difficult to separate the end of the gold standard from stagflation, as the concerns about the new monetary system would be lower if rampant inflation were absent. It’s obvious that Nixon’s shock contributed to the overall economic situation, but trends in gold prices were driven ultimately by macroeconomic forces – and these forces can reemerge.
Last but not least, it seems to me that although gold’s initial rally in 1972-1973 had more in common with the abandonment of the gold standard than with CPI inflation and other macroeconomic variables, after that period, trends in gold prices were more related to inflation and other fundamental factors (see the chart below). Hence, it would be hard to argue that the whole 1970s bull market was caused by the collapse of the gold standard.
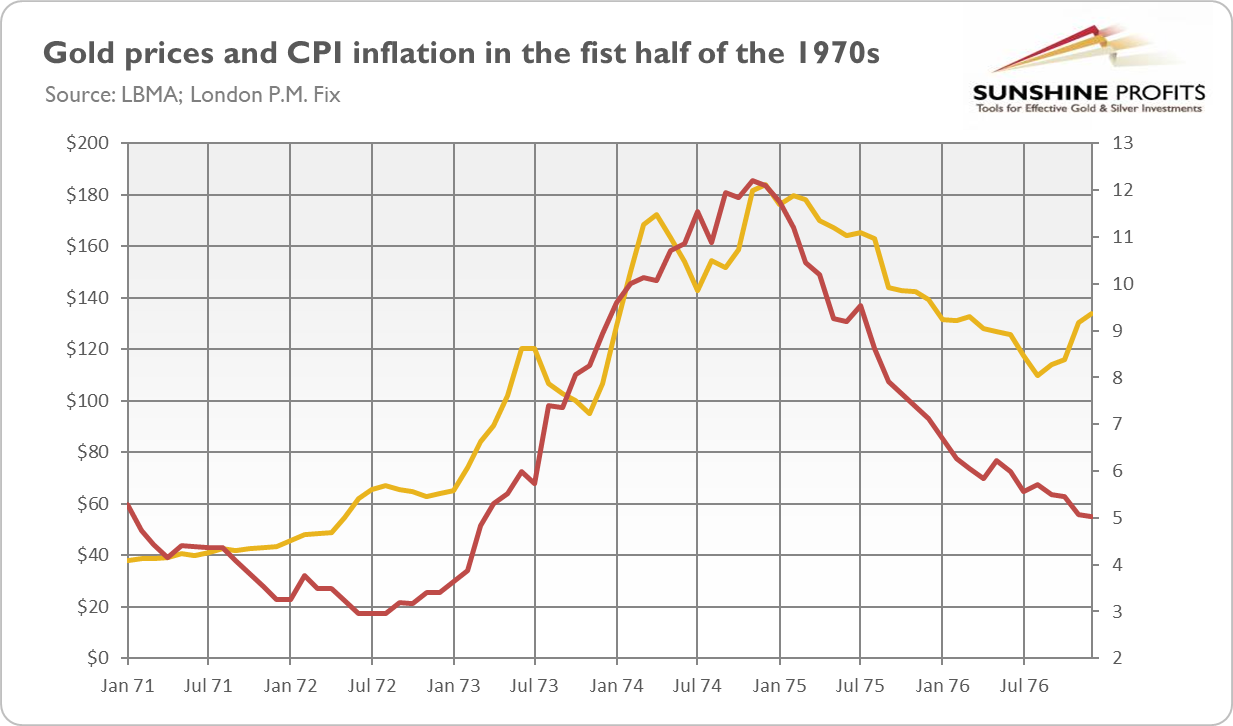
My second concern is probably more disturbing. Although the 1970s were a great time for gold, its price peaked in tandem with inflation in early 1980 (see the chart below), entering a bear market for two decades. Hence, my worry is that when inflation peaks, gold may plunge, as it did in 1980-1981 due to the lower inflation expectations and high interest rates, which raised the opportunity costs of investing in gold. After all, during disinflation, inflation expectations decline while real interest rates increase, which should negatively affect gold prices.
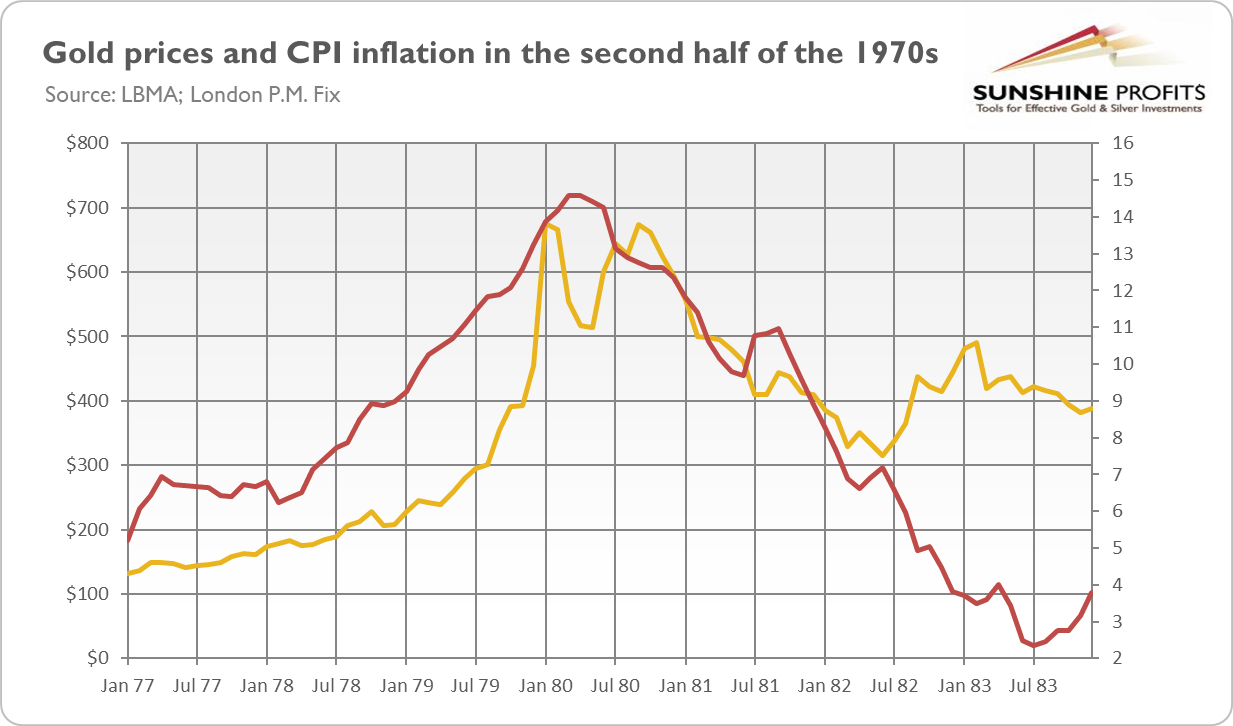
However, history doesn’t repeat itself (though it often rhymes). As the chart below shows, gold hasn’t actually surged with the current inflation. The rally occurred in the first half of 2020 amid the coronavirus recession when both actual inflation and inflation expectations initially plunged. Hence, the peak in inflation doesn’t have to be detrimental to gold. After all, what didn’t rise can’t fall.
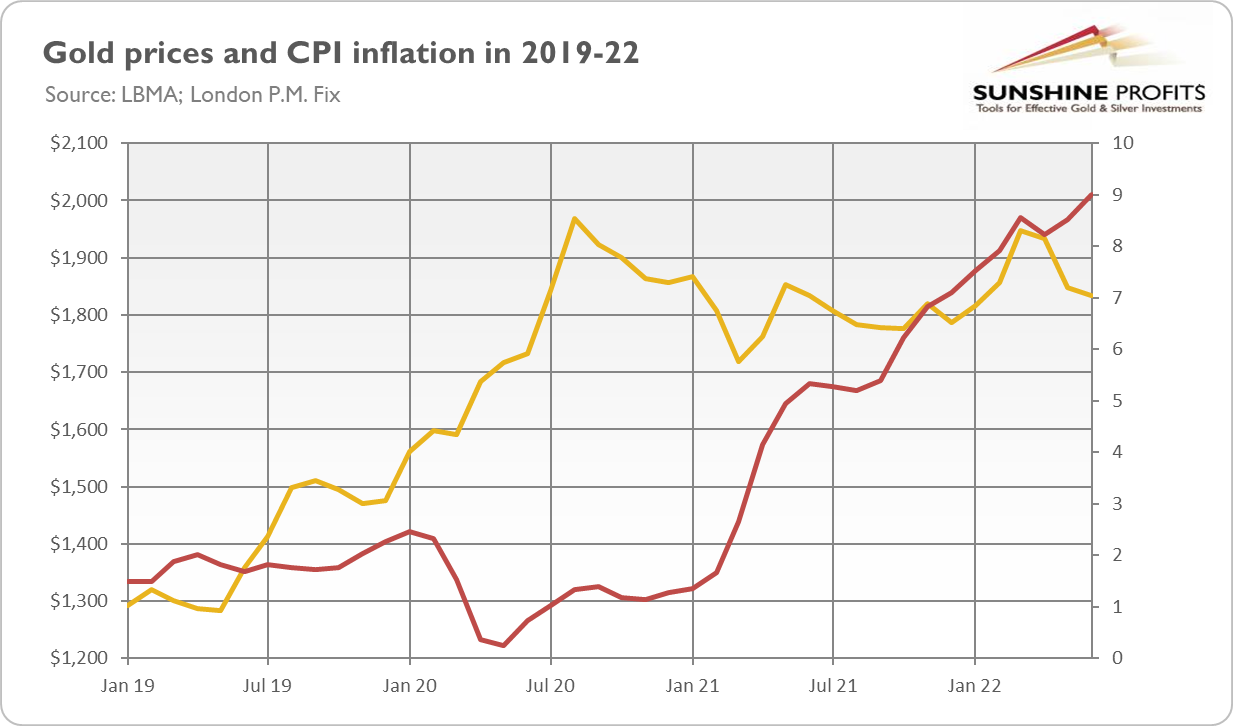
What’s more, real interest rates have already surged (see the chart below), so the room for further movement is limited. Of course, they can always go up, but the risk of a spike similar to that seen in 1980-1981 is much lower, especially given the recessionary worries and their dampening impact on rates.
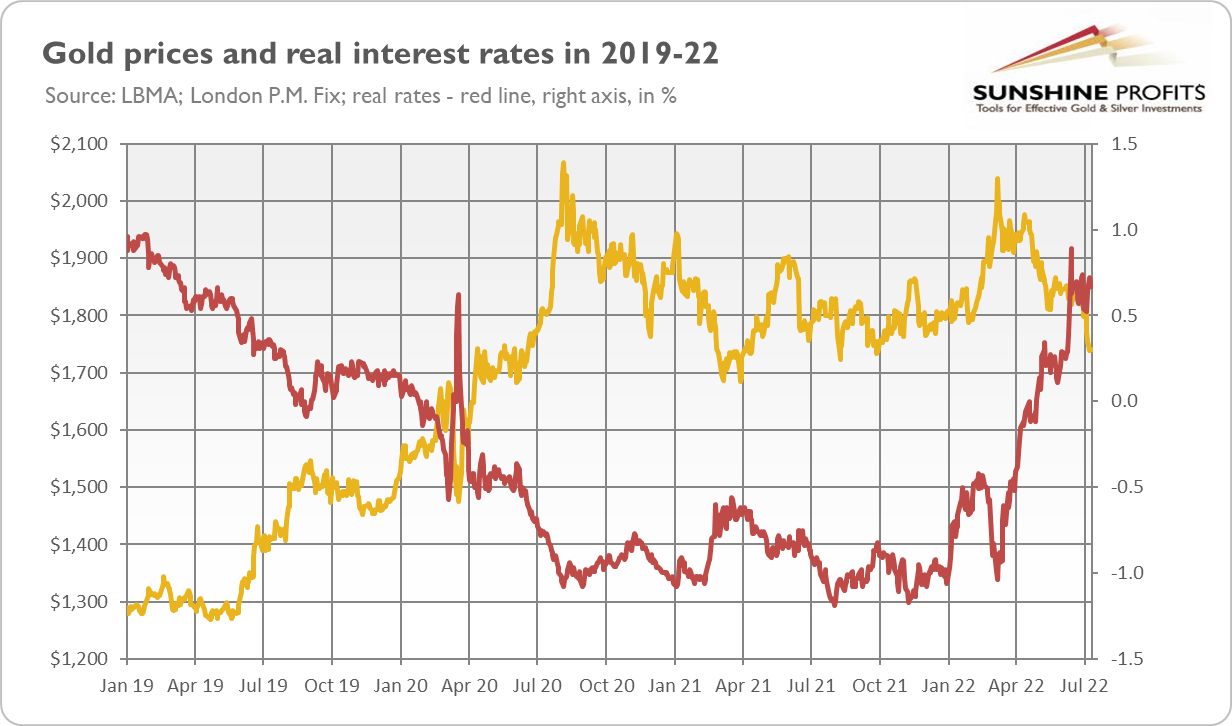
Additionally, please remember that years of ultra-low interest rates created a lot of economic bubbles (some analysts say about “everything bubble”), so the upcoming economic crisis could be really severe, especially given the pace of the Fed’s tightening cycle (compared to 2015-2018). In other words, the level of debt and financial imbalances is larger than in the 1970s, so the Fed may turn to a dovish stance (or at least soften its hawkish stance) even if inflation remains high.
So far, Powell can flex his muscles, but only because the unemployment rate is staying low and interest rate hikes haven’t yet hit the financial sector. However, when the unemployment rate starts to go up and financial markets begin to falter, the US central bank will be under strong pressure to stimulate the economy once again. I seriously doubt whether there would be a willingness to accept a really huge economic cost to combat inflation. Hence, luckily for gold, the upcoming recession doesn’t have to be like that of 1980, but it can be rather similar to that of 2007-2009 or 2020.
Thank you for reading today’s free analysis. If you enjoyed it, and would you like to know more about the links between the economic outlook, and the gold market, we invite you to read the August Gold Market Overview report. Please note that in addition to the above-mentioned free fundamental gold reports, and we provide premium daily Gold & Silver Trading Alerts with clear buy and sell signals. We provide these premium analyses also on a weekly basis in the form of Gold Investment Updates. In order to enjoy our gold analyses in their full scope, we invite you to subscribe today. If you’re not ready to subscribe yet though and are not on our gold mailing list yet, we urge you to sign up. It’s free and if you don’t like it, you can easily unsubscribe. Sign up today!
Arkadiusz Sieron, PhD
Sunshine Profits: Effective Investment through Diligence & Care.-----
Disclaimer: Please note that the aim of the above analysis is to discuss the likely long-term impact of the featured phenomenon on the price of gold and this analysis does not indicate (nor does it aim to do so) whether gold is likely to move higher or lower in the short- or medium term. In order to determine the latter, many additional factors need to be considered (i.e. sentiment, chart patterns, cycles, indicators, ratios, self-similar patterns and more) and we are taking them into account (and discussing the short- and medium-term outlook) in our Gold & Silver Trading Alerts.
-
Does Gold Know That a Recession Is Coming?
August 12, 2022, 11:28 AMRecession has already occurred or is on its way.. Somebody should tell gold about it!
Is a recession really coming? We already know that the yield curve inverted last month for the second time this year, but what are other indicators of looming economic troubles? Well, let’s start with GDP. According to the initial measure of the Bureau of Economic Analysis, real GDP dropped 0.9% in the second quarter, following the 1.6% decline in the first quarter (annualized quarterly rates). On a quarterly basis, real GDP decreased by 0.4 and 0.2 percent, respectively. Hence, the American economy recorded two quarters of negative growth, which implies a technical recession.
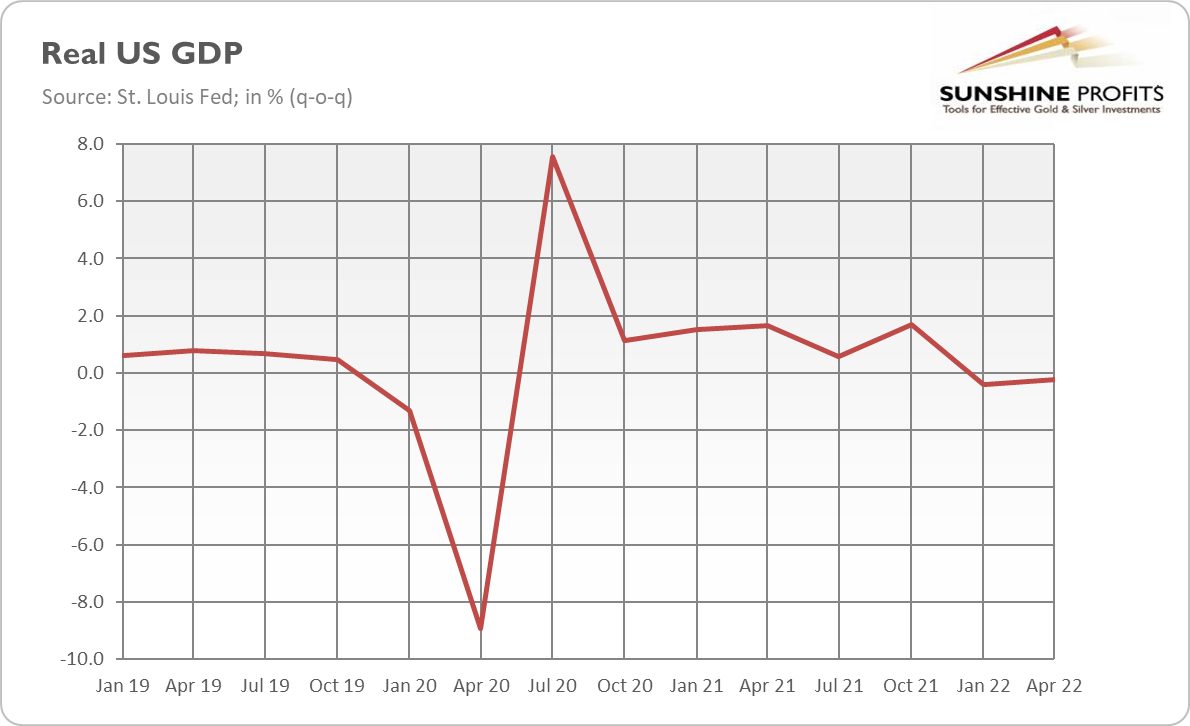
Second, the New York Fed’s DSGE Model became pessimistic in June, as it predicted modestly negative GDP growth in both 2022 (-0.6%) and 2023 (-0.5%). According to the model, the probability of a soft landing is only 10%, while the probability of hard landing—defined to include at least one quarter in the next ten in which four-quarter GDP growth dips below -1 percent—are about 80 percent. When the Fed’s own models predicts recession, you can be sure that the situation is serious!
Third, money supply growth has slowed down significantly in recent months. As the chart below shows, the growth rate declined from the peak of 26.9% in February 2021 to 5.9% in June 2022. This is a significant shift, because money supply tends to grow quickly during economic booms and slow before recessions, as banks "slam on the brakes" on money creation.

That’s not all! The S&P 500 has entered a bear market, while credit spreads have widened significantly. Financing costs for “junk” companies have almost doubled this year. Residential investment plunged 14% in Q2 2022, the largest decline in 12 years (excluding the pandemic era), and the housing market in general is suffering right now. The auto bubble is showing signs of bursting, and banks are already leasing more land to handle the expected surge in repossessed used cars. Business confidence and consumer sentiment are very low. Commodity prices (like copper) have plunged recently, and rising inventories at retailers could also foreshadow upcoming economic weakness.
Of course, not all the data points to a recession. In particular, the unemployment rate is still very low and the labor market remains tight. The problem is that the unemployment rate is a lagging indicator, as people start to lose jobs only when the economy has already begun declining. However, as the chart below shows, the unemployment rate hasn’t changed since March 2022, when it reached 3.6%. It suggests that it has found its bottom and may be ready to go up after a while. Moreover, jobless claims have risen from 166,000 on March 19 to 244,000 on July 9, which may herald upcoming problems. If we could have a jobless recovery from the 2001 recession, why couldn’t we have a jobful recession, at least in theory?
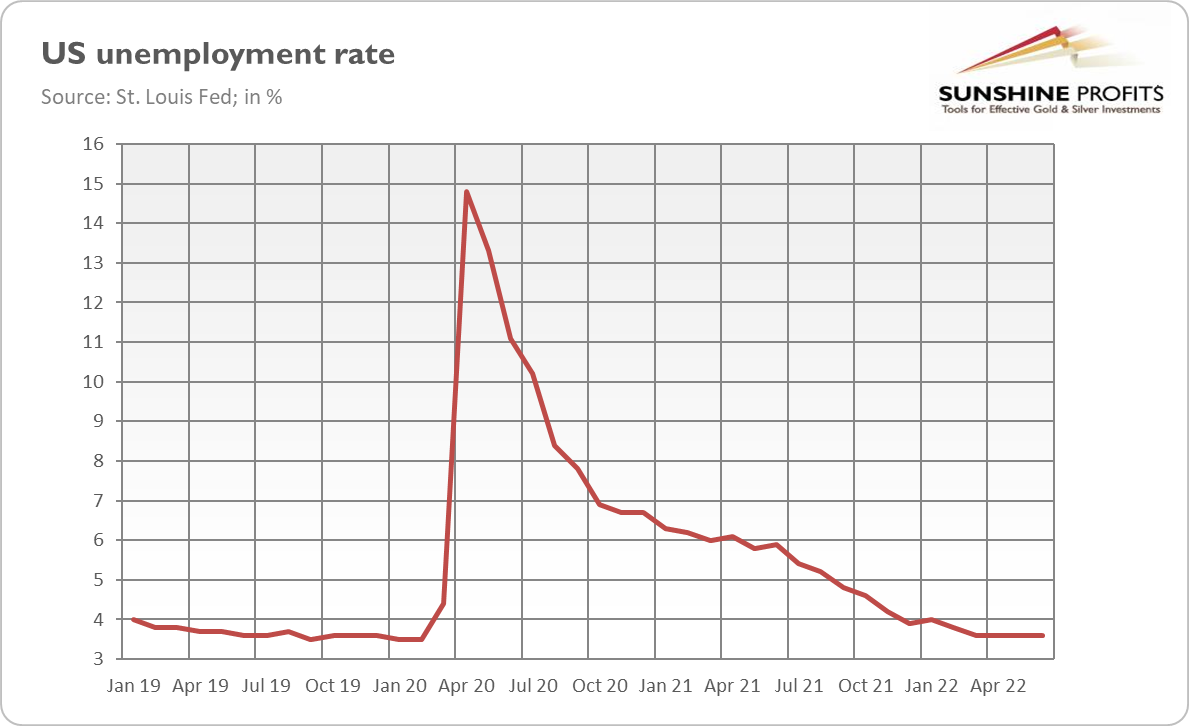
The second popular counterargument is that consumer spending remains healthy. This is true, but it shows some signs of slowing as inflation hits Americans’ budgets. In particular, real spending, adjusted for inflation, shows a less optimistic picture, as the chart below presents. Generally speaking, pointing at high spending during inflation doesn’t make sense, as this is exactly why we have inflation – newly created money by the Fed and commercial banks goes to people who are spending it. Moreover, during high inflation, spending money on goods and services is a reasonable course of action because it’s better to have some tangible assets than money, which is losing purchasing power each month.
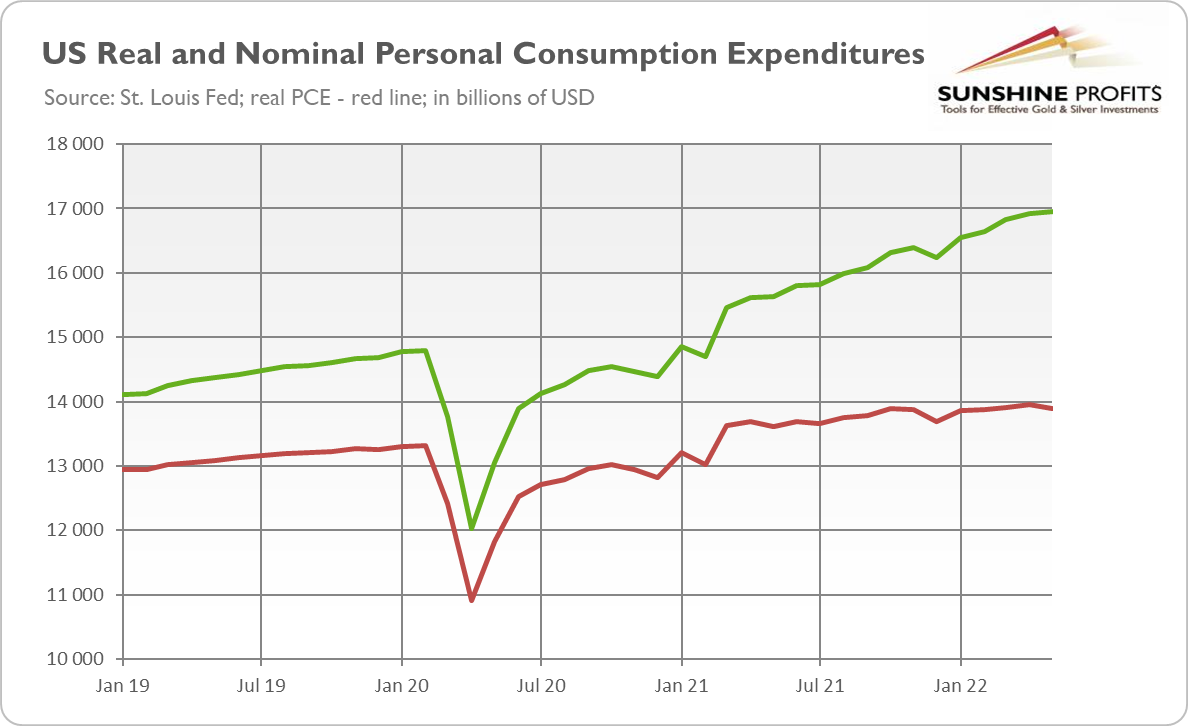
More generally, inflation has become so persistent that only a serious monetary policy tightening could bring it back to the Fed’s target of 2%. Actually, inflation is so high that it could trigger a recession on its own, as it seriously disrupts economic life. The problem here is that there is so much private and public debt that the aggressive interest rate hikes – needed to combat inflation – could burst asset bubbles and trigger a debt crisis.
What does it all mean for the gold market? Well, for me, the case is clear. We are either already in a recession or heading toward one. Given that gold is a safe-haven asset, a recession should be positive for its prices. As the chart below shows, gold usually rallies during economic downturns – and this has been the case in the past three recessions.
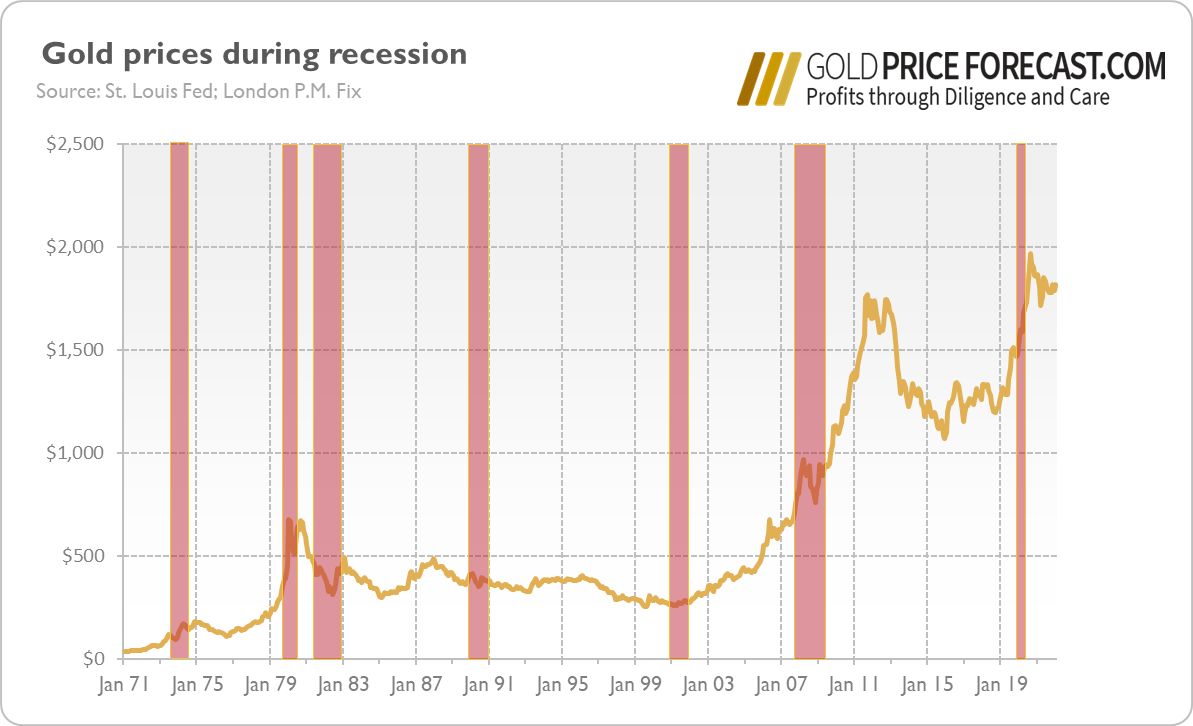
However, this relationship is not set in stone. The double-dip recession of the early 1980s was bearish for gold. The yellow metal soared during stagflation, but when Volcker hiked interest rates to combat inflation, it plunged, despite the fact that the Fed’s tightening cycle triggered recession. Hence, if the inflation rate goes down, real interest rates could increase further, putting downward pressure on gold. However, a recession is likely to be accompanied by a dovish Fed and declining bond yields, which should support gold.
Thank you for reading today’s free analysis. If you enjoyed it, and would you like to know more about the links between the economic outlook, and the gold market, we invite you to read the August Gold Market Overview report. Please note that in addition to the above-mentioned free fundamental gold reports, and we provide premium daily Gold & Silver Trading Alerts with clear buy and sell signals. We provide these premium analyses also on a weekly basis in the form of Gold Investment Updates. In order to enjoy our gold analyses in their full scope, we invite you to subscribe today. If you’re not ready to subscribe yet though and are not on our gold mailing list yet, we urge you to sign up. It’s free and if you don’t like it, you can easily unsubscribe. Sign up today!
Arkadiusz Sieron, PhD
Sunshine Profits: Effective Investment through Diligence & Care.-----
Disclaimer: Please note that the aim of the above analysis is to discuss the likely long-term impact of the featured phenomenon on the price of gold and this analysis does not indicate (nor does it aim to do so) whether gold is likely to move higher or lower in the short- or medium term. In order to determine the latter, many additional factors need to be considered (i.e. sentiment, chart patterns, cycles, indicators, ratios, self-similar patterns and more) and we are taking them into account (and discussing the short- and medium-term outlook) in our Gold & Silver Trading Alerts.
-
The Yield Curve Inverts. Now It’s Time for Gold to Turn Back
August 5, 2022, 1:22 PMThe yield curve has spoken: a recession is coming. Everything indicates that it will make gold shine.
It Happened Again
Have you ever wondered what the yield curve’s favorite song is? Neither have I, but I bet that in July it was Britney Spears’ hit, Oops, I Did It Again! Indeed, the yield curve inverted again last month, for the second time in 2022. It means that long-term rates fell below those on shorter-dated bonds.
As the chart below shows, the spread between 10-year and 2-year US Treasuries fell below zero for the first time this year at the beginning of April. However, it was a very short inversion, which lasted only two days, but on July 6, the yield curve inverted again – and this time it was more lasting.
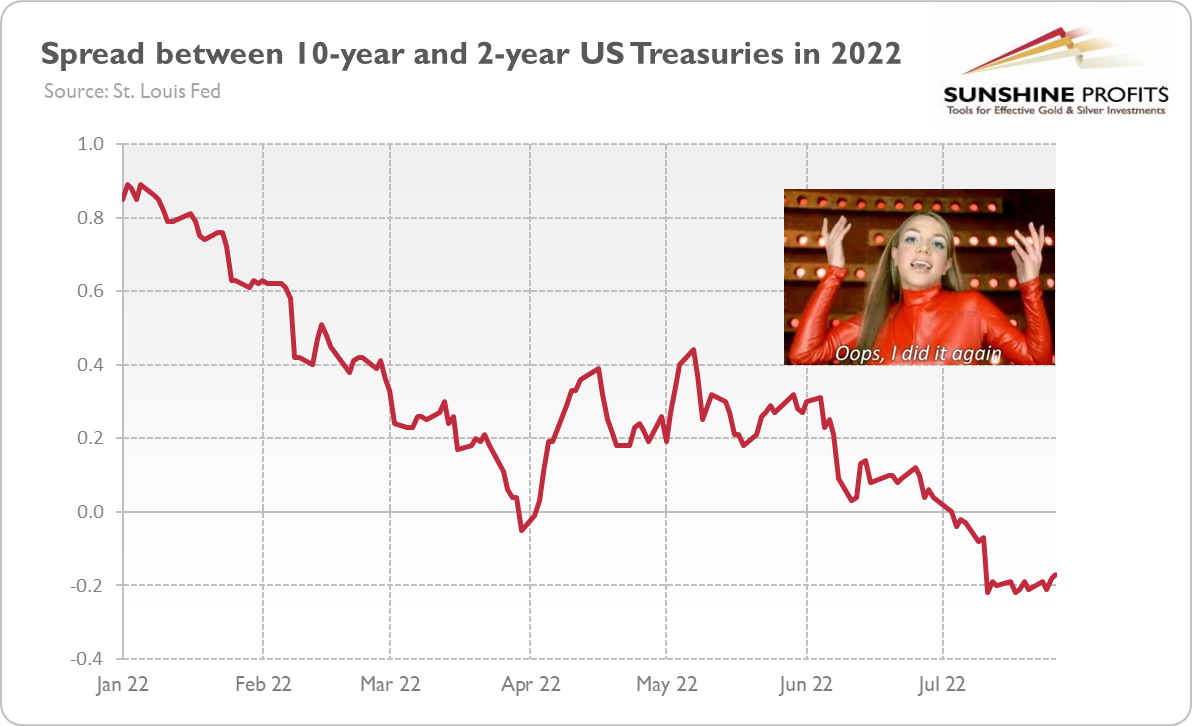
This is a very important development, as it strengthens the recessionary signal sent by the curve in April. The previous reversal was very brief and shallow – and thus not very reliable. However, the second inversion within just four months implies that dark clouds are indeed gathering over the US economy.
Why? There are two explanations for the yield curve’s inversion. According to the first one, more mainstream, inversion means that investors expect higher rates now and lower rates in the future, as they believe that the Fed’s tightening cycle will lead to a recession. The second interpretation is offered by the Austrian school of economics. It says that because of input price inflation and the tightening of the Fed’s monetary policy, entrepreneurs and investors are simply scrambling for funds, as they are in a liquidity shortage, which bids short-term interest rates up. Which one is true? Well, as the chart below shows, the yield curve has clearly inverted because of the rise in the 2-year Treasury yield, which fits nicely with the Austrian boom and bust cycle theory.
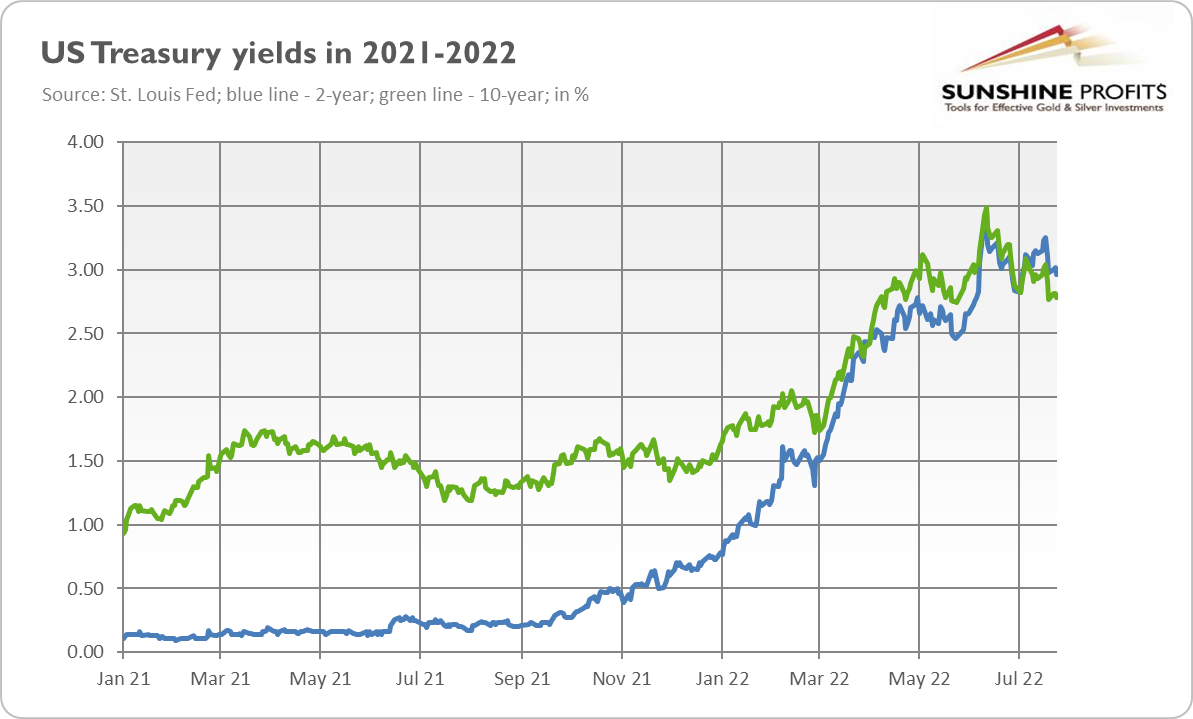
However, why should we worry about the yield curve’s inversion? Well, as the chart below shows, the inversion of the yield curve has been historically a very powerful recessionary signal. As one can see, it preceded all recessions since 1976. For example, the yield curve inverted in February 2000, in parallel with the burst of the dot-com bubble and about one year before the official beginning of a recession. The spread also turned negative in mid-2006, several months before the Great Recession, and in August 2019, just around the repo crisis, which would lead to another recession even if the coronavirus crisis didn’t occur. There was a false signal sent by the yield curve, but only one, when the curve inverted in mid-1998.
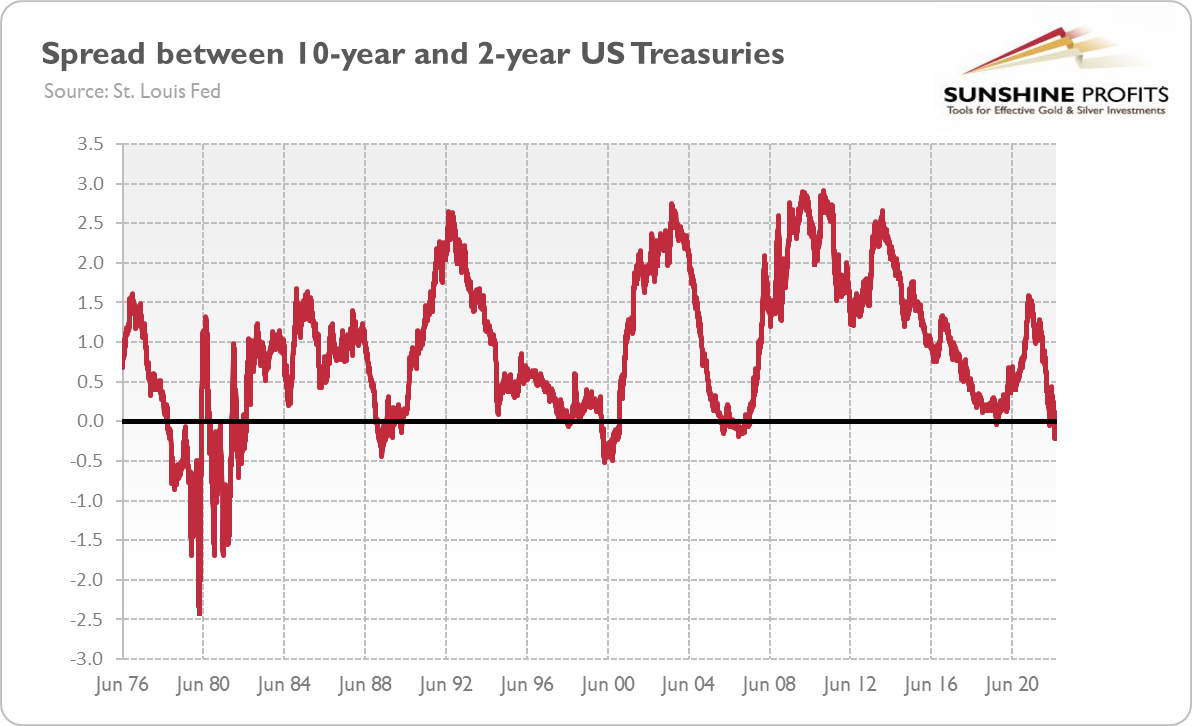
Should we believe the yield curve this time? Well, it’s possible that we’ll avoid a recession this time. After all, despite the slowdown in GDP growth, the labor market remains tight and the unemployment rate stays at a very low level. The more important spread between 10-year and 3-month US Treasuries hasn’t yet turned negative, as the chart below shows. However, it has flattened significantly since May, plunging to a level close to zero, and it may invert as well after the next hike in the federal funds rate.
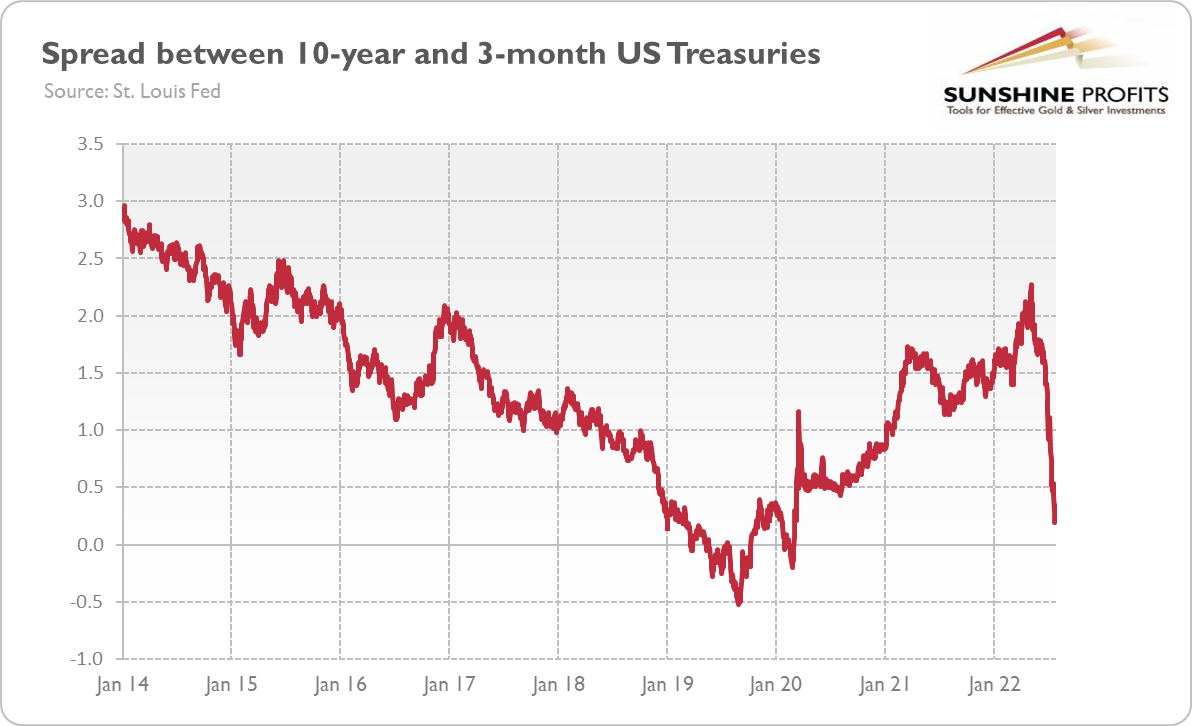
Another issue is that since COVID-19, we have lived in exceptional times, so traditional indicators might not work properly now. However, this is something the pundits say each time the yield curve inverts: this time it’ll be different. Yeah, for sure! I’ve heard many justifications why we shouldn’t worry about the yield curve’s inversion in 2019. Each time it turned out that the yield curve was right and the pundits – wrong. In 2019, there was a repo crisis and a standard recession was on the way – the only reason it didn’t occur was the introduction of the Great Lockdown and the emergence of the coronavirus recession.
What does it all mean for the gold market? Well, in the immediate future, not much. In fact, the increase in the short- to medium-term bond yields could be negative for the yellow metal. However, in the more distant future, the inversion of the yield curve bodes well for gold. After all, it means that the recession is coming, and gold tends to shine during economic crises. Also, during an economic downturn, the Fed is likely to reverse its hawkish stance. When the Fed stops raising interest rates and starts to cut them, gold should rally again.
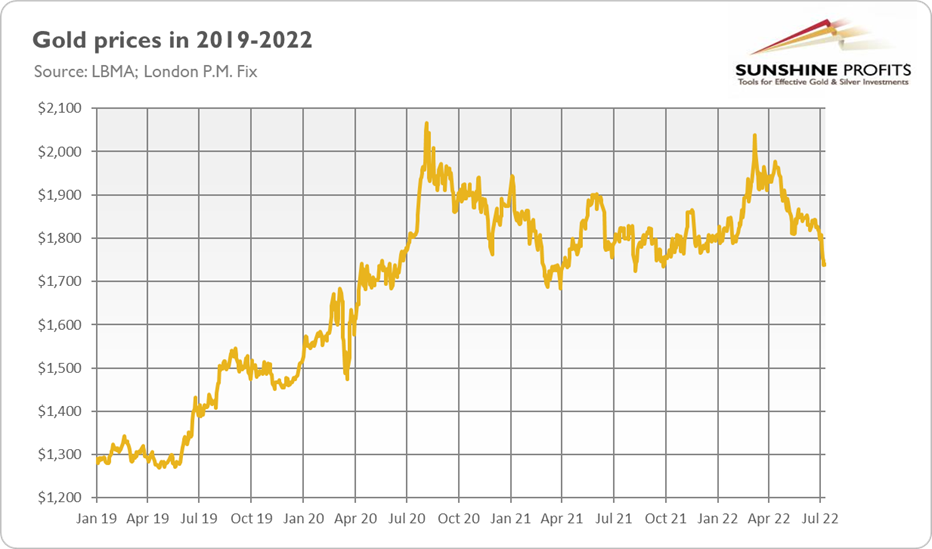
The analogy might be the 2018-2020 period. The Fed hiked the federal funds rate for the last time during its previous tightening cycle in December 2018. In July 2019, it started to cut its policy rates. As the chart above shows, the Fed’s dovish U-turn made gold soar. The same may happen this time. However, gold bulls should still be prepared for some pain – the Fed hasn’t said the last hawkish word.
Thank you for reading today’s free analysis. If you enjoyed it, and would you like to know more about the links between the economic outlook, and the gold market, we invite you to read the August Gold Market Overview report. Please note that in addition to the above-mentioned free fundamental gold reports, and we provide premium daily Gold & Silver Trading Alerts with clear buy and sell signals. We provide these premium analyses also on a weekly basis in the form of Gold Investment Updates. In order to enjoy our gold analyses in their full scope, we invite you to subscribe today. If you’re not ready to subscribe yet though and are not on our gold mailing list yet, we urge you to sign up. It’s free and if you don’t like it, you can easily unsubscribe. Sign up today!
Arkadiusz Sieron, PhD
Sunshine Profits: Effective Investment through Diligence & Care.-----
Disclaimer: Please note that the aim of the above analysis is to discuss the likely long-term impact of the featured phenomenon on the price of gold and this analysis does not indicate (nor does it aim to do so) whether gold is likely to move higher or lower in the short- or medium term. In order to determine the latter, many additional factors need to be considered (i.e. sentiment, chart patterns, cycles, indicators, ratios, self-similar patterns and more) and we are taking them into account (and discussing the short- and medium-term outlook) in our Gold & Silver Trading Alerts.
-
Gold Will Come Out Stronger from the Economic Hurricane
July 22, 2022, 10:37 AMRecession calls are getting louder. If history is any guide, the bust is coming. Good news for gold!
An economic hurricane is coming. Brace yourselves! This is at least what Jamie Dimon suggested last month. To be precise, he said: “Right now, it's kind of sunny. Things are doing fine. Everyone thinks the Fed can handle this. That hurricane is right out there down the road, coming our way. We just don’t know if it's a minor one or Superstorm Sandy.” When JP Morgan Chase’s CEO is painting such a gloomy picture, you know that something serious is going to happen!
Indeed, both on Wall Street and Main Street, calls for a recession are becoming more common and louder. According to Markit, credit default swaps have nearly doubled so far in 2022, surpassing the pre-pandemic levels. The higher their prices, the greater the chance of default in the eyes of investors. The high yield bond market is also showing that worries about the state of the economy are rising. As the chart below shows, the spread between so-called junk bonds and Treasuries surged from about 300 to more than 500 basis points in 2022.
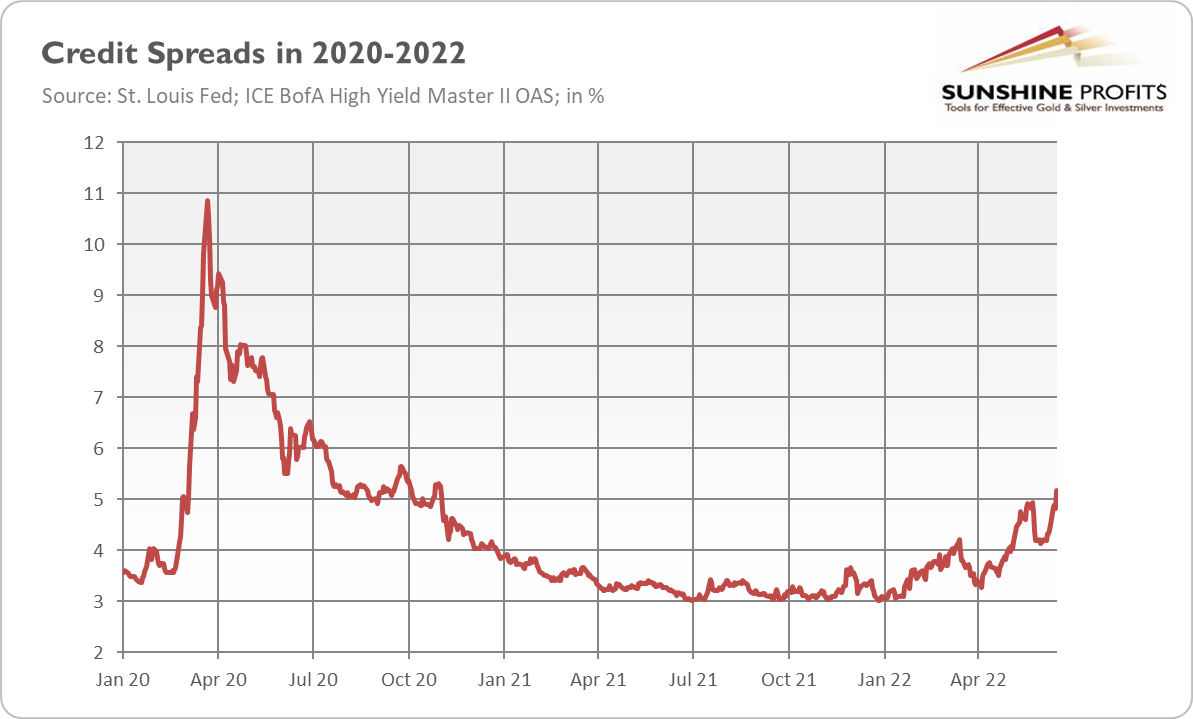
It means that the risk premium – a premium that investors require to hold risky bonds – has risen considerably this year, to the heights of the coronavirus crisis. The implication is clear: market sentiment is deteriorating and confidence in the economy’s strength is declining. The widening credit spreads are usually a good harbinger for the gold price.
Not only investors have become more worried recently. As the chart below shows, US consumer sentiment as measured by the University of Michigan dived below 60, to a level not seen since the Great Recession and, earlier, the recession of 1980.
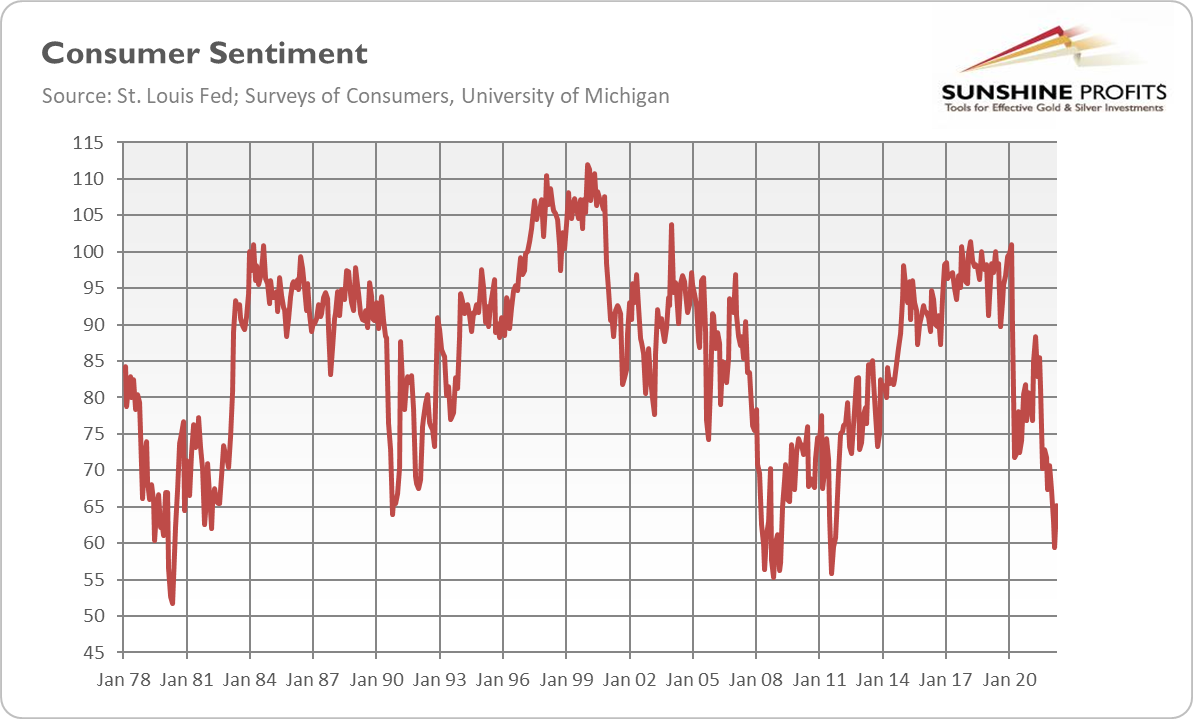
Are these concerns justified? I’m afraid so! The Atlanta Federal Reserve’s GDPNow tracker is now pointing to an annualized real GDP growth of just 0% for the second quarter. Atlanta, we have a problem!
To understand what is happening right now, it would be useful to recall the Austrian business cycle theory. According to the Austrian school of economics, there is a phase of boom triggered by the increase in the money supply in the form of credit expansion and the policy of low interest rates that stimulate borrowing and investment, and then the inevitable bust. The bust is imminent as a credit-based boom results in aan imbalance between saving and investment and widespread malinvestments. So, when the credit expansion is slowing down and interest rates are rising, it turns out that many investment projects were not justified by the fundamentals and could be started only because of artificially lowered interest rates and excessive lending. When the bubble bursts, a recession unfolds.
Now, let’s apply this theory to the present situation. In a response to the coronavirus pandemic, governments all over the world panicked and introduced costly lockdowns. To compensate for the losses, the Fed slashed the federal funds rate to almost zero and boosted the monetary base by 40% in just two months. But what distinguished this episode from the previous monetary injections is that the Fed introduced many liquidity programs for Main Street. As a consequence, in the two years after the outbreak of the pandemic, the broad money supply M2 rose by more than 40%, while bank credit increased by about 20% (see the chart below).
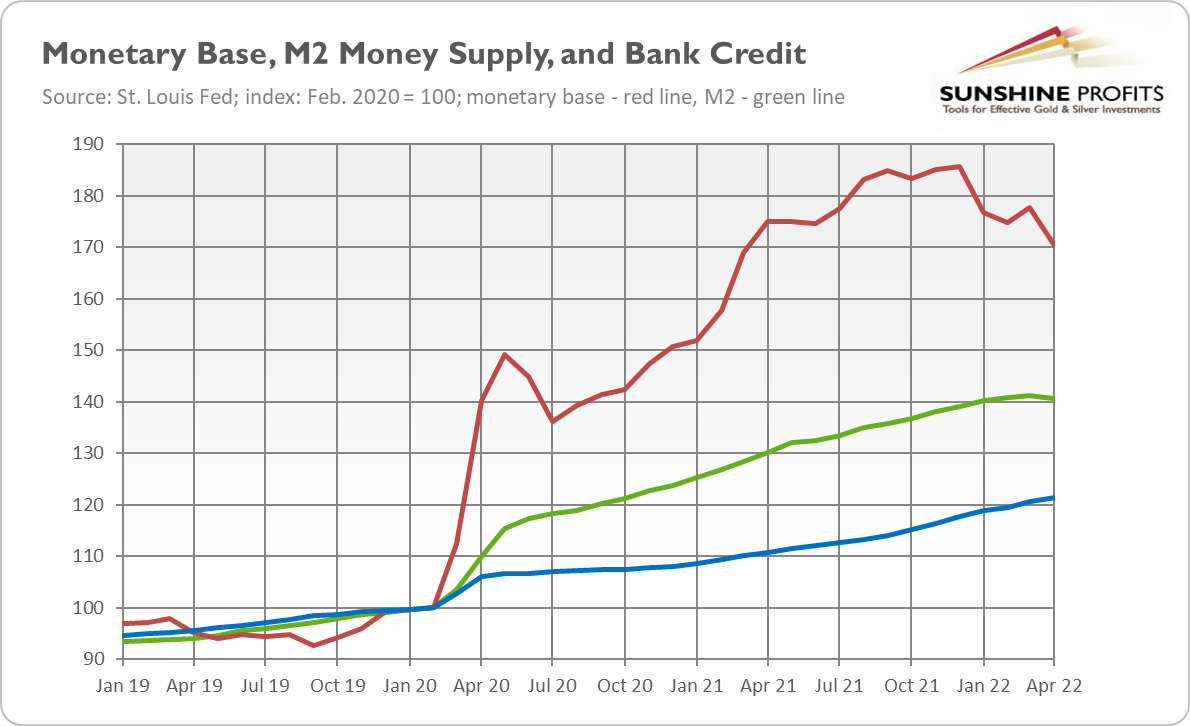
As the bulk of this newly created money went to entrepreneurs, they started new investments. However, because input supply had not increased, producer prices soared (as shown in the chart below, producer prices have risen 40% since the pandemic), forcing entrepreneurs to borrow money in the market, driving up bond yields and causing a yield curve inversion. At some point, when interest rates increase too much, entrepreneurs will have to abandon or seriously restructure their projects, triggering a full-scale recession. We are already witnessing some tech companies firing workers in an attempt to reduce costs.
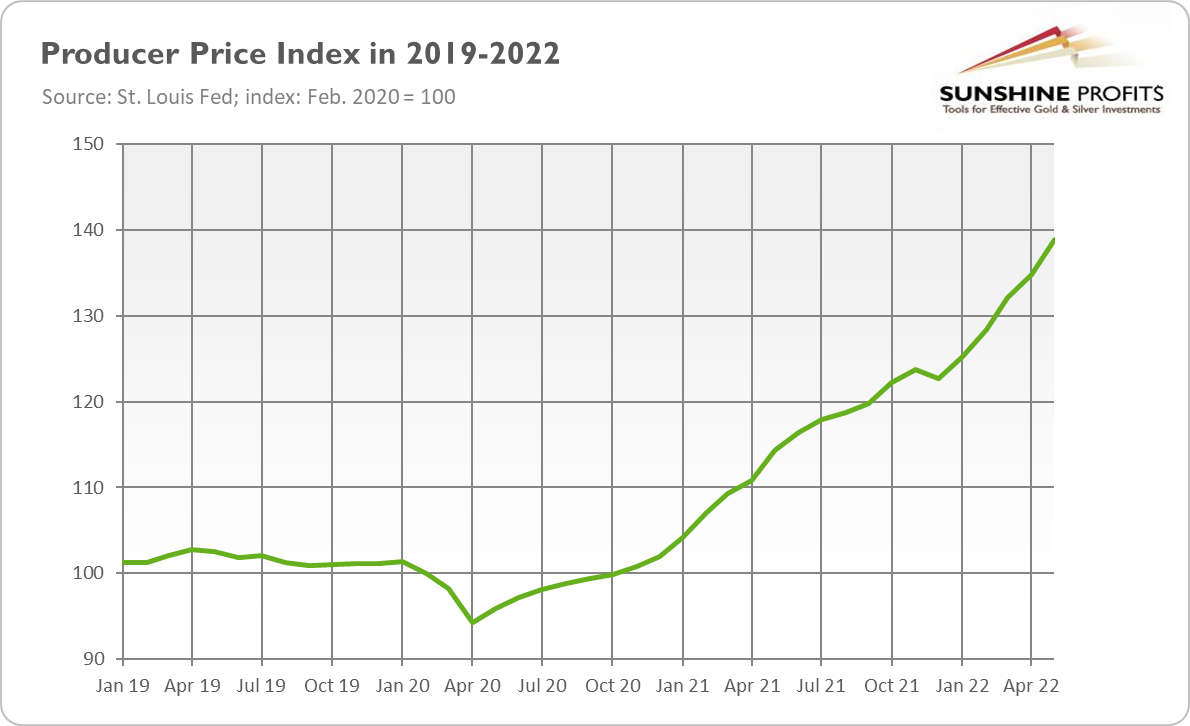
What does it all mean for the gold market? Well, the bust is coming, or, actually – as Kristoffer Hansen points out – the crisis is already upon us. This might be surprising as, typically, business cycles are much longer, but the 2020 monetary impulse was an unusually large but one-time event. This is good news for the yellow metal, which shines during financial crises. Indeed, in the recessionary year of 2008, gold gained 4%, although it initially lost due to fire-sales, and it rallied even more impressively in 2009 and subsequent years. So far, I would say that we are still in 2007, when the stock market has already entered the territory but the real economy hasn’t fallen into recession yet. However, this is likely to change in the upcoming months. If history is any guide, gold will ultimately come out stronger from the crisis.
Summary
Let’s sum up the current edition of the Gold Market Overview. As the chart below shows, June was negative for the yellow metal. The price of gold dropped 1.2% from $1,839 on May 31 to $1,817 on June 30. So, it was a better month than May, in which gold prices fell 3.8%. From its March peak, the yellow metal is down about 11%, but it’s slightly changed year-to-date.
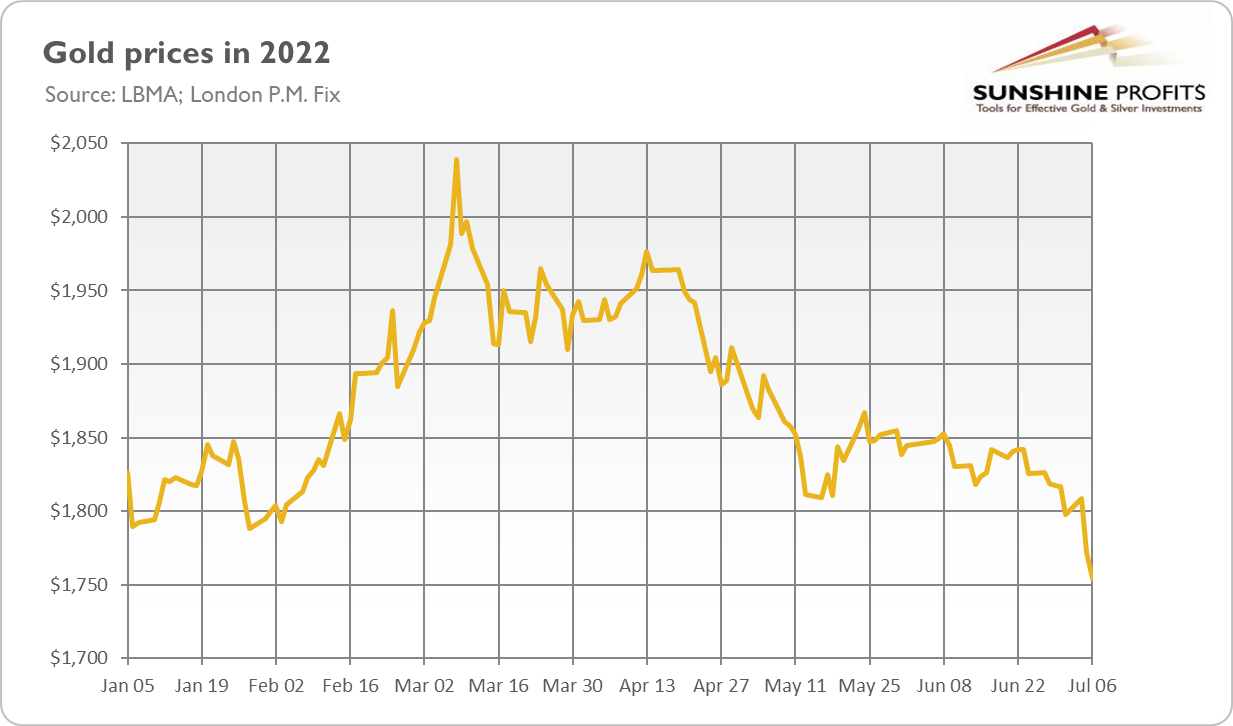
Gold’s performance was actually better than the chart suggests. This is because the yellow metal held its ground amid relatively steep hikes in the federal funds rate. The Fed hiked interest rates by 75 basis points in June, following a 50-basis point raise in May and a 25-basis point liftoff in March. The hawkish FOMC meeting contributed to the plunge in the stock market and cryptocurrencies, but gold remained generally resilient, clearly outperforming other assets. However, in early July, the price of gold sank deeply below $1,800, so the period of resilience could end and the downward wave could start.
Inflation is still very high and it persists even when GDP growth is slowing down. This means that we are approaching stagflation, which should cause gold to rally. The US economy is already decelerating, but the aggressive Fed’s tightening cycle (because it was so terribly delayed) could trigger a recession. The S&P 500 Index has already entered bear market territory, and credit spreads are widening, suggesting a drop in economic confidence. There are also other indications suggesting that the next economic crisis is coming. All this suggests that gold could shine, at least after the currently challenging time.
So far, surging real interest rates are creating downward pressure on gold. However, steep hikes in the federal funds rate imply that we’ll see the peak sooner. What’s important is that Powell is not Volcker and won’t swallow so much economic pain to combat inflation. Even if he was ready to do so, the current, highly indebted economy is not, and when the tightening cycle is over and investors start to expect interest rate cuts rather than further hikes, gold should rally again.
Thank you for reading today’s free analysis. If you enjoyed it, and would you like to know more about the links between the economic outlook, and the gold market, we invite you to read the July Gold Market Overview report. Please note that in addition to the above-mentioned free fundamental gold reports, and we provide premium daily Gold & Silver Trading Alerts with clear buy and sell signals. We provide these premium analyses also on a weekly basis in the form of Gold Investment Updates. In order to enjoy our gold analyses in their full scope, we invite you to subscribe today. If you’re not ready to subscribe yet though and are not on our gold mailing list yet, we urge you to sign up. It’s free and if you don’t like it, you can easily unsubscribe. Sign up today!
Arkadiusz Sieron, PhD
Sunshine Profits: Effective Investment through Diligence & Care.-----
Disclaimer: Please note that the aim of the above analysis is to discuss the likely long-term impact of the featured phenomenon on the price of gold and this analysis does not indicate (nor does it aim to do so) whether gold is likely to move higher or lower in the short- or medium term. In order to determine the latter, many additional factors need to be considered (i.e. sentiment, chart patterns, cycles, indicators, ratios, self-similar patterns and more) and we are taking them into account (and discussing the short- and medium-term outlook) in our Gold & Silver Trading Alerts.
-
When the Fed Takes the Punch Bowl Away, Stick to Gold
July 15, 2022, 10:12 AMThe massive monetary binge is over. The Fed is taking the punch bowl away. The hangover is coming. The best cure is – except for the broth – gold.
No Longer Doves
75 basis points! This is how much the FOMC raised interest rates in June. As the chart below shows, it was the biggest hike in the federal funds rate since the 1990s. Due to this huge move, the target range for the federal funds rate returned to the pre-pandemic level of 1.50-1.75%. Given how dovish and gradual the US central bank normally is, we may conclude that the inflation threat is really serious. The Fed has been so far behind the inflation curve that it must raise rates at the fastest pace in more than a quarter of a century!
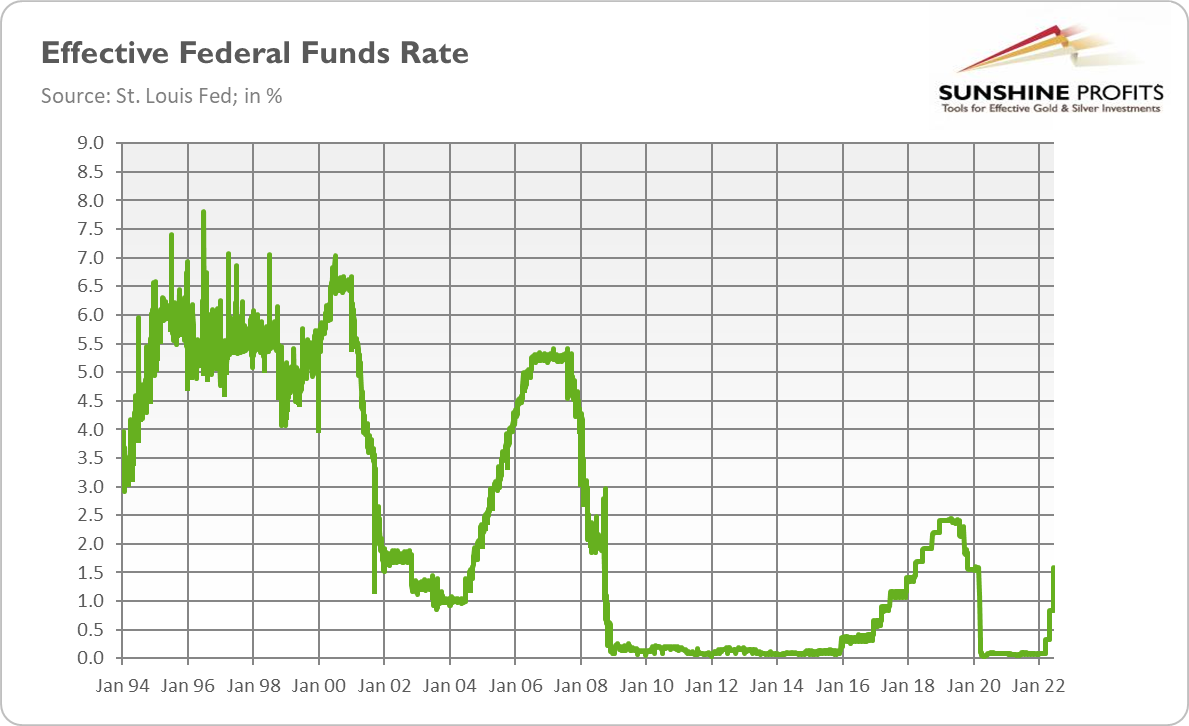
Last month, the US central bank also started reducing the size of its enormous balance sheet. Until September, the Fed will be cutting $45 billion a month from its massive holdings, and it will increase to $95 billion, almost twice as much as it did in the previous episode of quantitative tightening. As the chart below shows, the value of the Fed’s assets has already peaked, reaching $8.95 trillion in mid-May 2022.
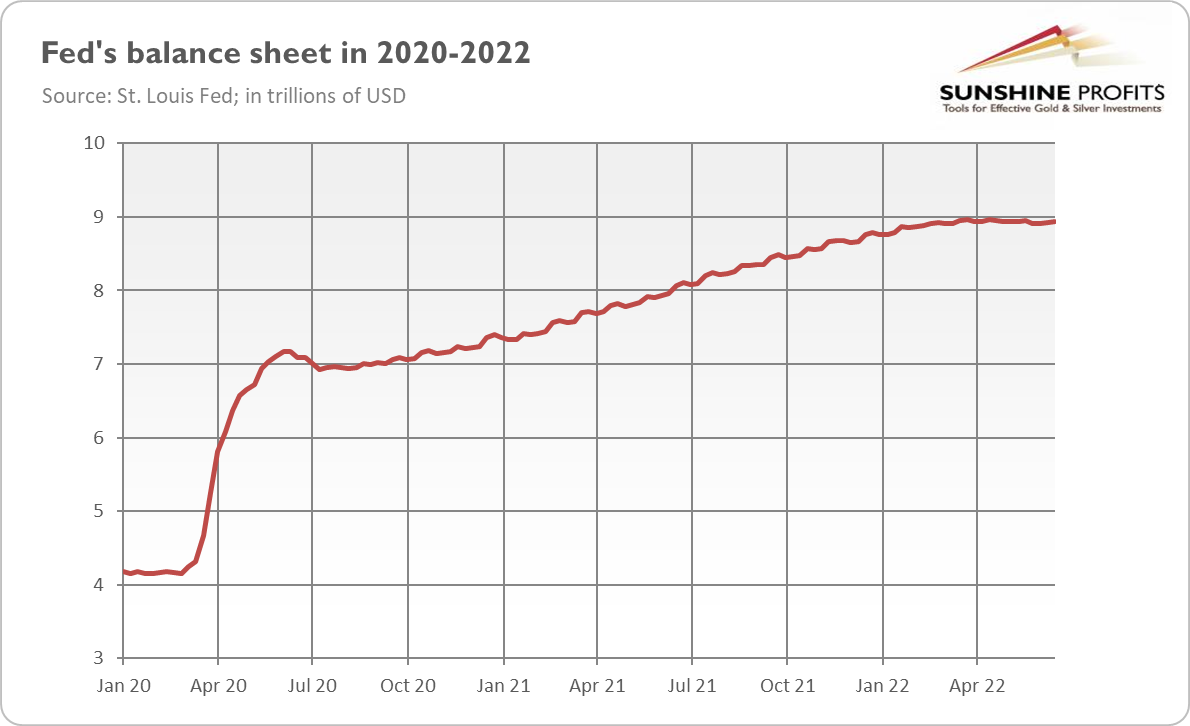
What does it all mean for the US economy? Well, let’s start with the observation that although the Fed is tightening its monetary policy, its stance remains accommodative. According to the Taylor rule, the federal funds rate shouldn’t be just between 1.50% and 1.75%, but at least above 5% (see the chart below taken from the Atlanta Fed)! At such a level, the Fed will be “neutral”, but to beat inflation it should be restrictive, not merely neutral!
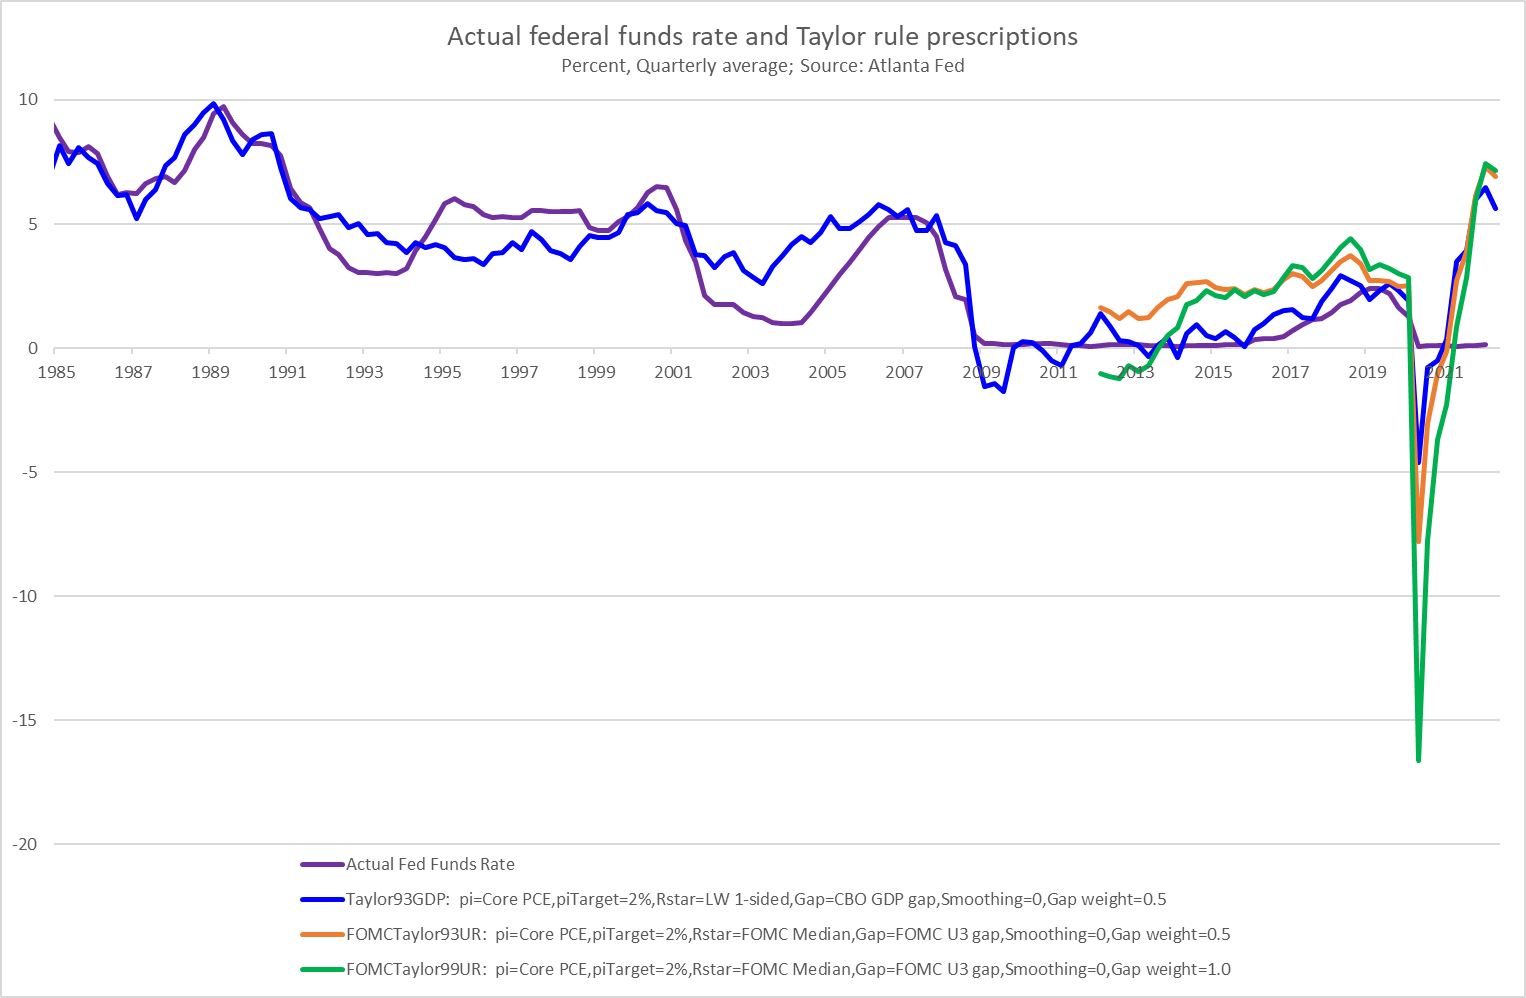
It means that the US central bank remains behind the inflation curve and would have to raise interest rates much further to combat high inflation. However, it raises a very important question: could the Fed raise rates so decisively without triggering the next economic crisis? This is, of course, a rhetorical question.
As a reminder, the previous Fed’s tightening cycle of 2017-2019 led to the repo crisis, forcing the US central bank to reverse its stance and cut interest rates. Given how fragile the financial system is and how much indebted the American economy is, it’s almost certain that the current monetary policy tightening will lead to a sovereign-debt crisis or another kind of financial crisis.
Right now, the commercial banks seem to be in healthy condition and with ample reserves, so the risk of a liquidity crisis in the very near future is low. However, as the tightening continues, the debt-servicing costs and share of nonperforming loans will increase, worsening the financial situation. So far, Powell is flexing his muscles, but this is only because the labor market remains strong, but when faced with the choice between fighting inflation and stimulating a crumbling economy, I doubt whether he could withstand the pressure from both Wall Street and the government, which are heavily indebted and addicted to easy money.
Implications for Gold
What does it all imply for the gold market? Well, theoretically, monetary policy tightening should be negative for gold prices, as higher real interest rates usually lead to lower gold prices. However, gold has been generally very resilient during the current tightening cycle. It’s true that it didn’t rally despite the outburst of inflation, but its gave a stellar performance (even when we take July plunge in the account) in the face of rising rates and in comparison to plunging equities or cryptocurrencies, as the charts below show. By the way, it seems that the debate about whether gold or Bitcoin is a better store of value has been settled.
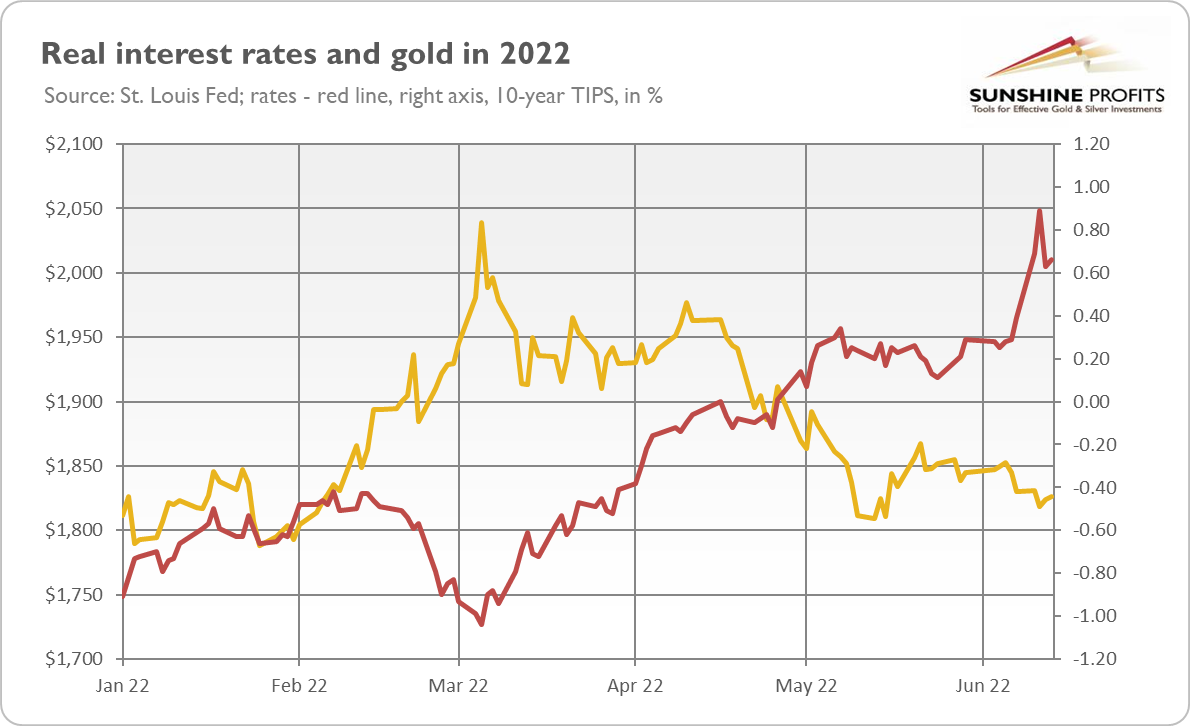
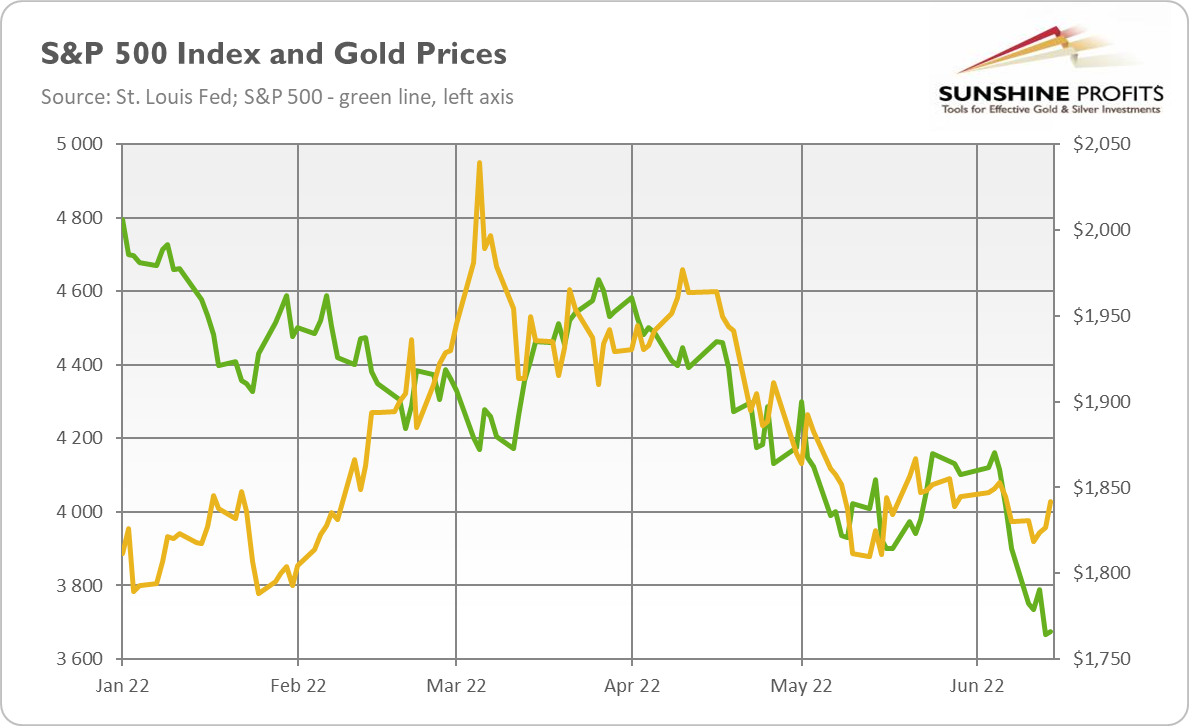
Powell still believes in a soft landing, but he may be the only one. You see, after a gigantic binge, there is always a hangover. When the host of the great party is taking away the punch bowl, drunken guests loudly express their dissatisfaction, which can even translate into brawling. Similarly, after a massive increase in the money supply, there is high inflation that you cannot just wait out, lying in bed and eating broth. You have to hike interest rates, but then borrowing costs are increasing, which hits many excessively indebted companies and investors, and the economic boom translates into a bust.
Busts are awful, but not for gold. The yellow metal rallied during both the Great Recession and the coronavirus crisis (and also during the repo crisis), and I believe that this time won’t be different. We just have to wait until deteriorating economic conditions force the Fed to deviate from its planned course. Initially, when the next crisis hits, there might be a panic sell-off in the precious metals market in order to raise liquidity, but after this short period, gold should rally, shining brightly as a truly safe haven.
Thank you for reading today’s free analysis. If you enjoyed it, and would you like to know more about the links between the economic outlook, and the gold market, we invite you to read the July Gold Market Overview report. Please note that in addition to the above-mentioned free fundamental gold reports, and we provide premium daily Gold & Silver Trading Alerts with clear buy and sell signals. We provide these premium analyses also on a weekly basis in the form of Gold Investment Updates. In order to enjoy our gold analyses in their full scope, we invite you to subscribe today. If you’re not ready to subscribe yet though and are not on our gold mailing list yet, we urge you to sign up. It’s free and if you don’t like it, you can easily unsubscribe. Sign up today!
Arkadiusz Sieron, PhD
Sunshine Profits: Effective Investment through Diligence & Care.-----
Disclaimer: Please note that the aim of the above analysis is to discuss the likely long-term impact of the featured phenomenon on the price of gold and this analysis does not indicate (nor does it aim to do so) whether gold is likely to move higher or lower in the short- or medium term. In order to determine the latter, many additional factors need to be considered (i.e. sentiment, chart patterns, cycles, indicators, ratios, self-similar patterns and more) and we are taking them into account (and discussing the short- and medium-term outlook) in our Gold & Silver Trading Alerts.
-
The Bears Took Control of the Market, but Refrained from Gold
July 8, 2022, 10:45 AMThe bears awoke from their winter sleep and took control of Wall Street. However, they haven’t conquered the gold market yet!
It’s official: there is a bear market in equities! As the chart below shows, last month, the S&P 500 Index plunged more than 20% from its historic peak of 4797 points in early January 2022. A decline of greater than 20% is considered to mark a bear market as opposed to a normal correction within the bull market. The Dow Jones hasn’t yet crossed that threshold, but the S&P better reflects the condition of the US stock market, so we can firmly state that bears took control of Wall Street for the first time since the pandemic crash.
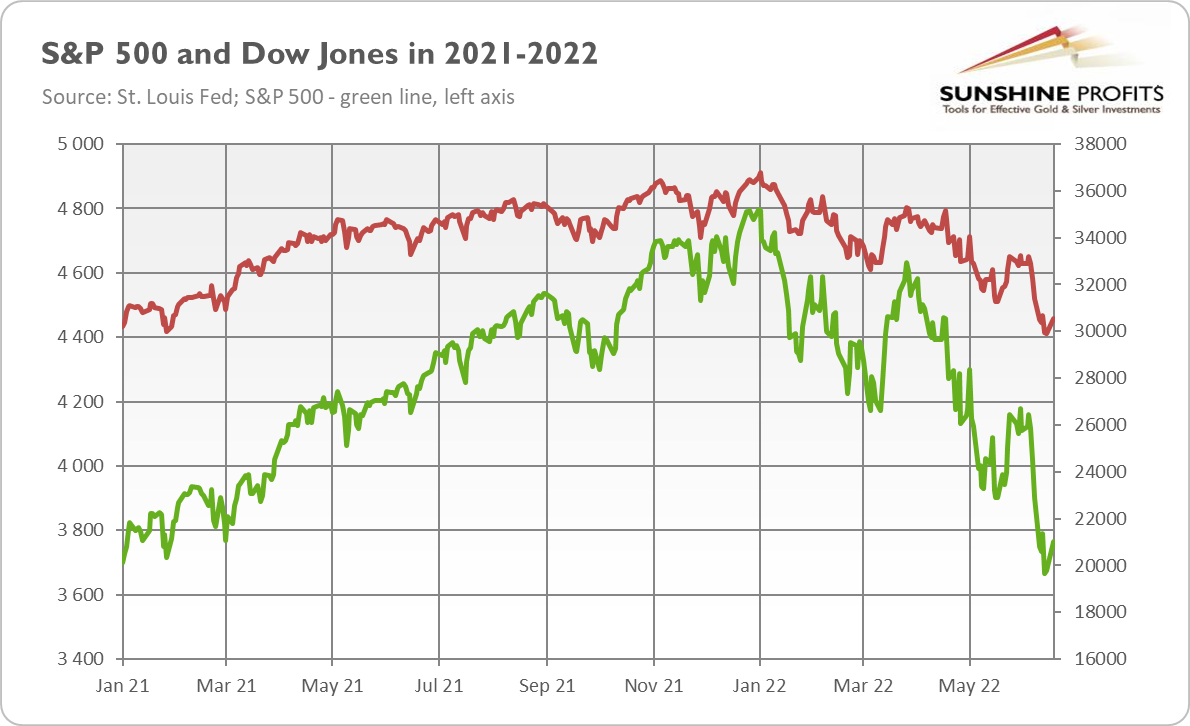
How long will the bear market last? According to Reuters, after World War II, on average, stocks declined slightly over a year from the peak to the bottom. So, the current bear market could continue for a few months. Similarly, on average, the S&P 500 index fell by 32.7% during modern bear markets. Hence, there is room for further declines in the stock market.
What does the bear market in equities mean for the US economy? Well, the bear market in stocks doesn’t have to be something disturbing for the whole economy. As the old joke goes, “the stock market has predicted nine of the past five recessions.” Indeed, 25 bear markets have happened since 1928, of which only fourteen have also seen recessions.
However, in modern times, the relationship between the stock market and overall economic activity has strengthened. There have been eleven bear markets since 1956, of which eight have been accompanied by recessions. Since 1968, all bear markets but one (the infamous 1987 crash) have coincided with overall economic crises. Finally, all four recent cases of bear markets (1990, 2000-2003, 2007-2009, and 2020) were accompanied by recessions (see the chart below).
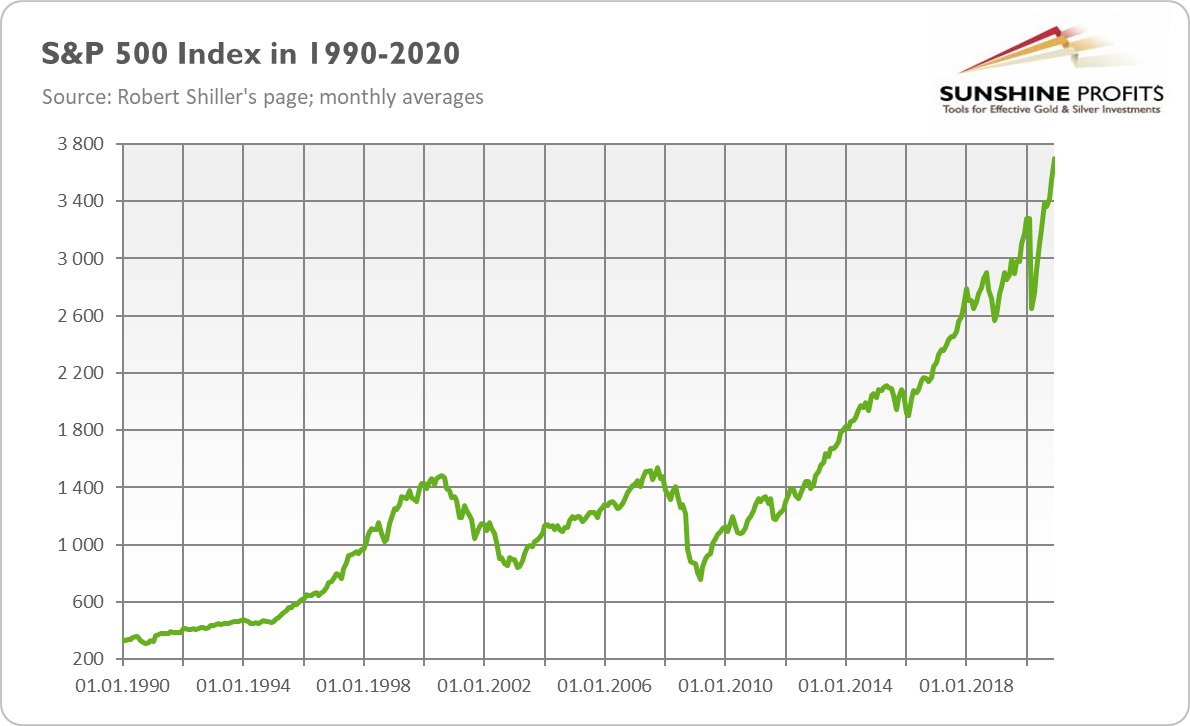
Hence, we should take the bearish stock market seriously. Although a bear market doesn’t necessarily cause a recession, it sometimes portends one. For example, the dot-com bubble in the stock market reached its peak and burst in August 2000, seven months before the US economy fell into recession. When this occurred in March 2001, the S&P500 just entered a bear market territory. Later, the stock market peaked again in October 2007, just two months before the official beginning of the Great Recession. It entered bearish territory in September 2008, when Lehman Brothers collapsed, triggering the most acute phase of the global financial crisis. Given that we are already five months since the S&P 500’s most recent peak and one month since the index entered a bear market, a recession may be on the horizon (theoretically, we could be already in one, as the NBER declares official beginnings many months after they have already started).
Of course, each case is unique, and this time may be different. However, there are important reasons to worry. After all, the stock market dived due to the Fed’s tightening cycle, initiated to curb high inflation. Although necessary to tame upward price pressure, it could trigger a recession. The last three economic downturns – and bear markets in equities – were preceded by hikes in the federal funds rate, as the chart below shows.
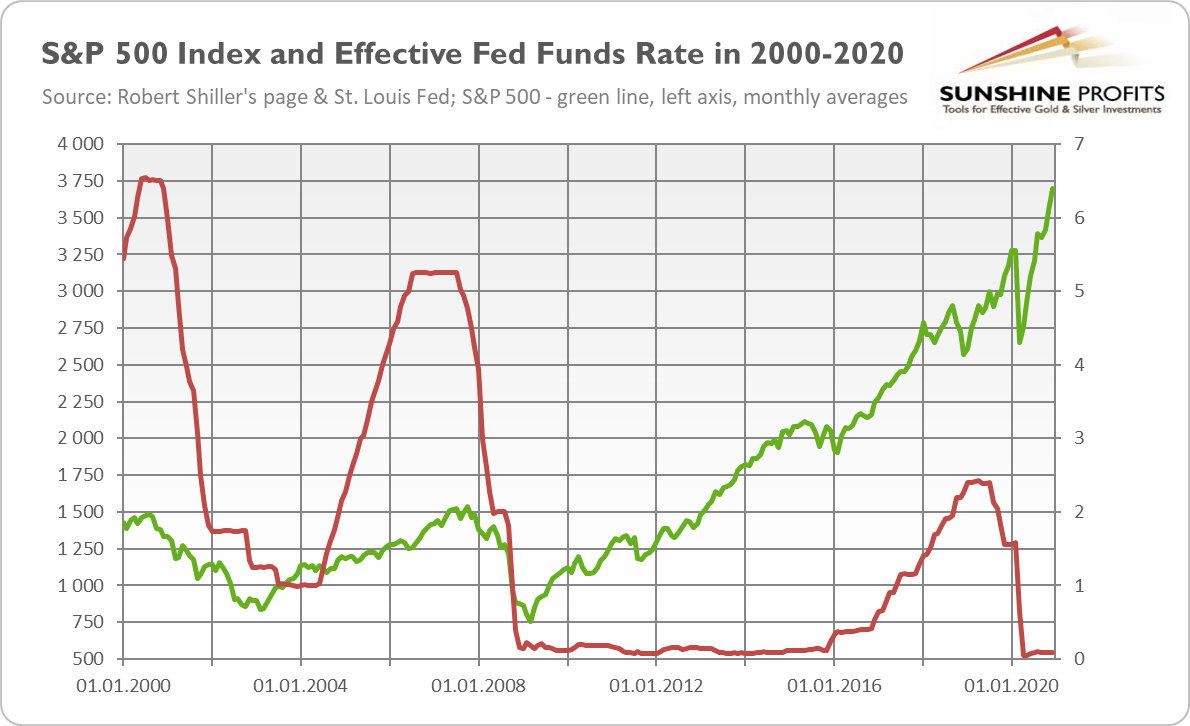
What does it all mean for the gold market? Well, bear markets that accompany recessions are generally positive for the yellow metal. However, the relationship is more nuanced than one could intuitively expect. In 2000-2001, gold declined initially in tandem with the stock market and bottomed out in April 2001, one month after the S&P 500 entered a bear market, as the chart below shows.
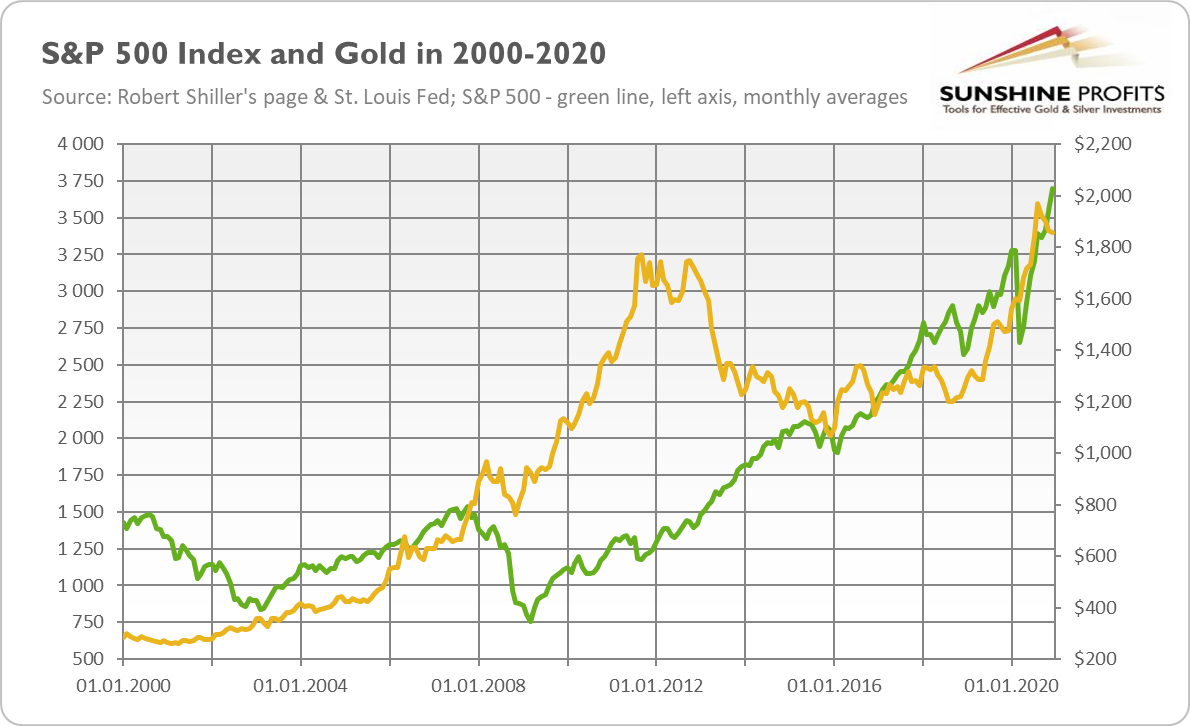
Then, it started a multi-year rally that ended in March 2008, in the middle of the Great Recession. Gold remained in a downward trend by November 2008, plunging in tandem with the stock market, although to a lesser extent. Only then did it start its fabulous surge. A similar pattern occurred in 2020: during the pandemic March, gold declined alongside the S&P 500, albeit to a lesser extent, and began to rally shortly after the initial sell-off.
This suggests that we could be close to the bottom in the gold market. If there is an asset sell-off when investors scramble for cash needed to fulfill their obligations and cover their margin calls, the yellow metal could decline further. However, when this phase of a crisis is over, gold should shine. Rising interest rates could continue to exert a downward pressure on the yellow metal for a while, but when they peak, gold will have a clear field to run.
Thank you for reading today’s free analysis. If you enjoyed it, and would you like to know more about the links between the economic outlook, and the gold market, we invite you to read the July Gold Market Overview report. Please note that in addition to the above-mentioned free fundamental gold reports, and we provide premium daily Gold & Silver Trading Alerts with clear buy and sell signals. We provide these premium analyses also on a weekly basis in the form of Gold Investment Updates. In order to enjoy our gold analyses in their full scope, we invite you to subscribe today. If you’re not ready to subscribe yet though and are not on our gold mailing list yet, we urge you to sign up. It’s free and if you don’t like it, you can easily unsubscribe. Sign up today!
Arkadiusz Sieron, PhD
Sunshine Profits: Effective Investment through Diligence & Care.-----
Disclaimer: Please note that the aim of the above analysis is to discuss the likely long-term impact of the featured phenomenon on the price of gold and this analysis does not indicate (nor does it aim to do so) whether gold is likely to move higher or lower in the short- or medium term. In order to determine the latter, many additional factors need to be considered (i.e. sentiment, chart patterns, cycles, indicators, ratios, self-similar patterns and more) and we are taking them into account (and discussing the short- and medium-term outlook) in our Gold & Silver Trading Alerts.
-
Stagflation With Powell Could Make Gold Happy
July 1, 2022, 12:37 PMThe upcoming stagflation might be less severe than in the 1970s. So is the Fed’s reaction, which could mean good news for gold.
There are many terrifying statements you can hear from another person. One example is: “Honey, we need to talk!” Another is: “I’m from the government and I’m here to help.” However, the scariest English word, especially nowadays, is “stagflation.” Brrr!
I’ve explained it many times, but let me remind you that stagflation is a combination of economic stagnation and high inflation. This is why it’s a nightmare for central bankers as they should ease monetary policy to stimulate the economy and simultaneously tighten it to curb inflation.
Although we haven’t fallen into recession yet, the pace of GDP growth has slowed down recently. According to the World Bank’s report Global Economic Prospects from June 2022, “the global economy is in the midst of a sharp growth slowdown” and “growth over the next decade is expected to be considerably weaker than over the past two decades.” The U.S. growth is expected to slow to 2.5 percent in 2022, 1.2 percentage points lower than previously projected and 3.2 percentage points below growth in 2021.
This is why more and more experts raise concerns about stagflation similar to what happened in the 1970s. So far, employment remains strong, but the misery index, which is the sum of the unemployment rate and inflation rate, is already relatively high (see the chart below) and could continue to rise if economic activity deteriorates further.
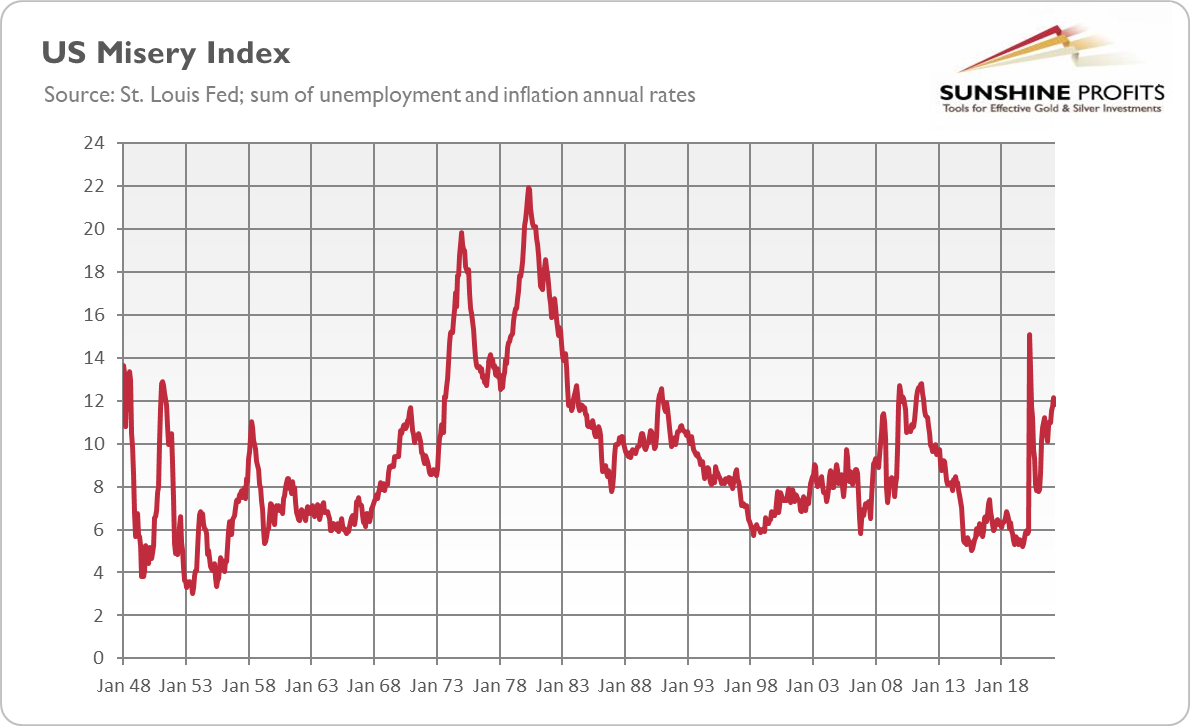
So, it seems that the consensus view is that stagflation is likely, but the key question is how bad it will be, or how similar it will be to the stagflation of the 1970s. As the chart below shows, that period was pretty bad. The inflation rate stayed above 5% for a decade, reaching almost 15% in early 1980. Meanwhile, there was a long and deep recession in 1973-1975 and the subsequent two in the 1980s, triggered by Volcker’s monetary tightening that was necessary to curb high inflation.
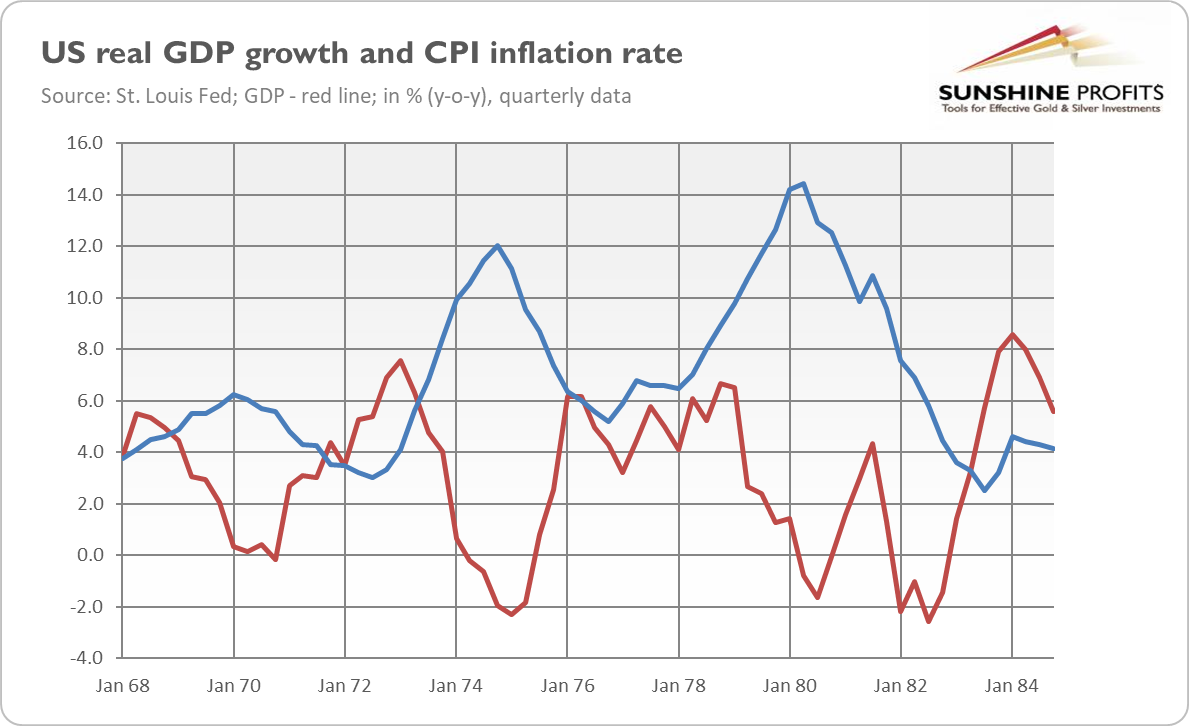
Similarities are quite obvious. First, the economic slowdown came after the previous recession and rebound. Second, supply shocks. Supply disruptions caused by the pandemic and by Russia’s invasion of Ukraine resemble the oil shocks of the 1970s. Third, the burst of inflation comes after prolonged period of easy monetary policy and negative real interest rates. According to the World Bank, “global real interest rates averaged -0.5 percent over both the 1970-1980 and the 2010-2021 periods”. Fourth, consumer inflation expectations are rising significantly, which increases the risk of their de-anchoring, as in the 1970s. As the chart below shows, consumers now expect inflation to run at 5.4% over the next twelve months, according to the University of Michigan survey, the highest level since 1981.
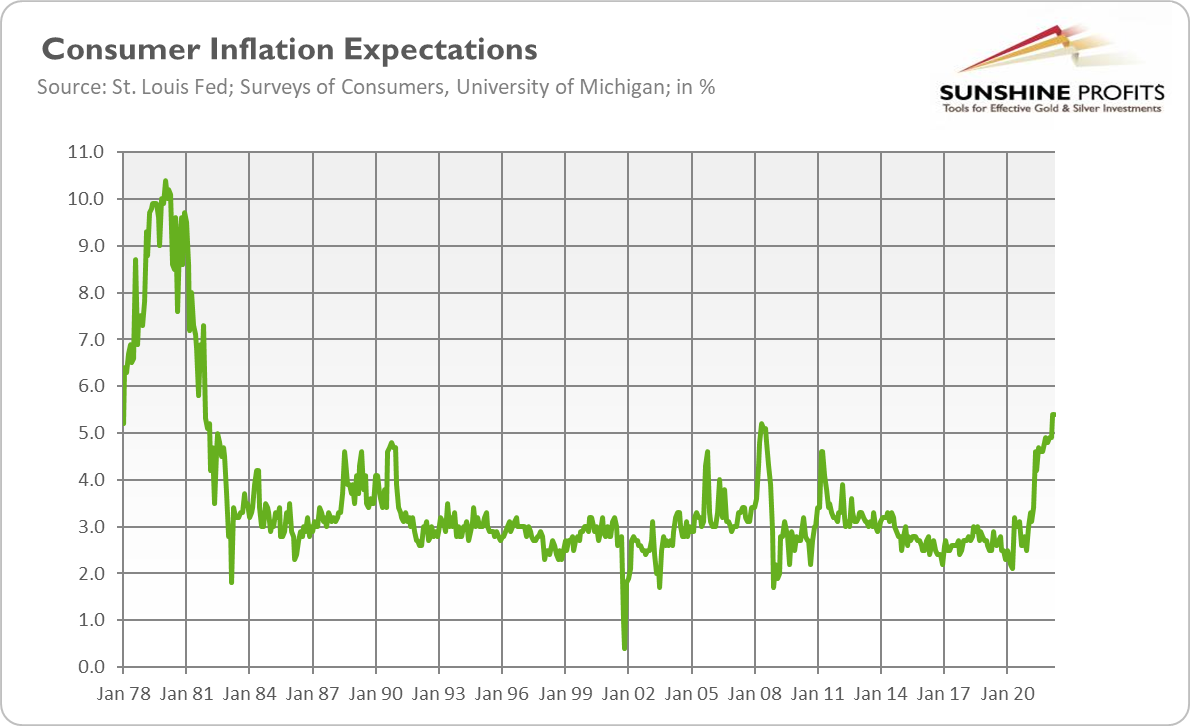
However, the World Bank also points out important differences. First, the magnitude of commodity price jumps has been smaller than in the 1970s. Oil prices are still below the peaks from those years, especially in real terms, while the economy is much more energy-dependent. Second, the fiscal stance is tighter now. In the 1970s, fiscal policy was very easy, while now it’s expected to tighten, which could help to curb inflation. According to the CBO, the federal budget deficit will shrink to $1.0 trillion in 2022 from $2.8 trillion last year.
Third, the M2 money stock M2 ballooned after the pandemic by 40% in just two years. So, the increase in the money supply was much more abrupt, although it was rather a one-time outburst than a constant fast pace of money supply growth as it was in the 1970s (see the chart below). Thus, the pattern of inflation could be similar.
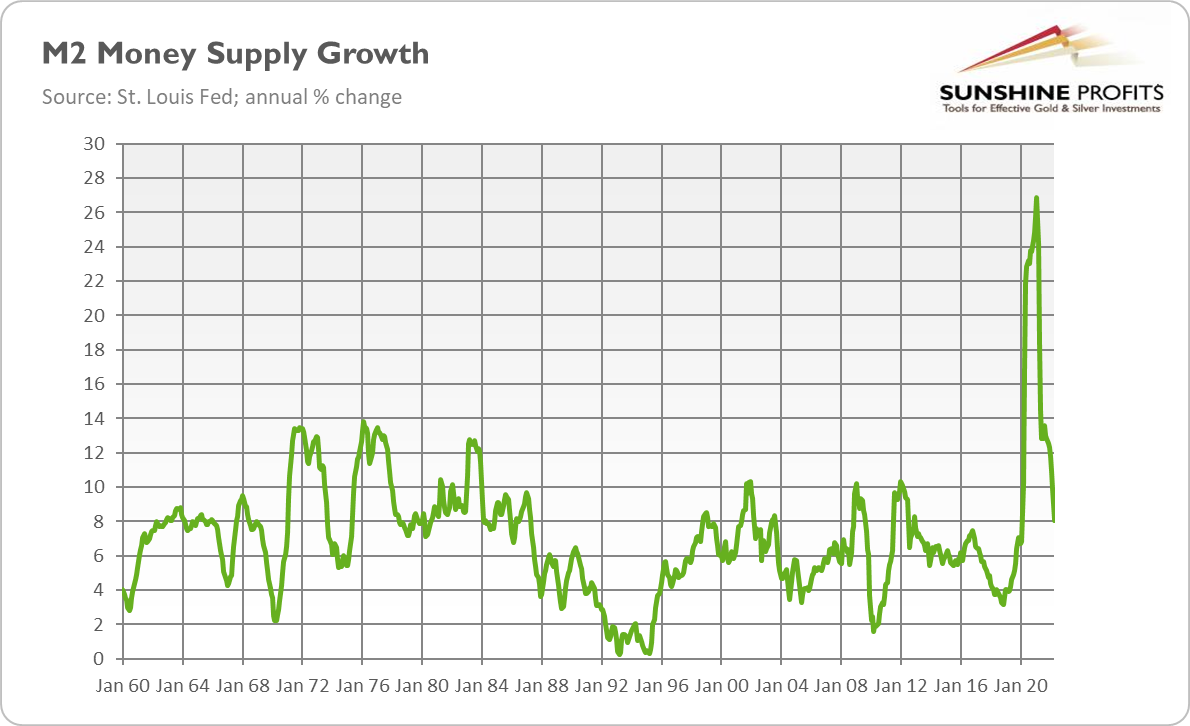
Fourth, contemporary economies are much more flexible with the weaker position of trade unions, and income and price policies (like interest or price controls) are not popular today. It allows a faster response of supply to rising prices and reduces the likelihood of price-wage spirals. The fifth difference mentioned by the World Bank is more credible monetary policy frameworks and better-anchored inflation expectations. Although true, I would be cautious here, as the Fed remains behind the curve and people could quickly lose confidence in the central bank while inflation expectations could easily de-anchor.
For me, the two crucial differences are the much higher levels of both private and public debt today compared to the 1970s (see the chart below) and less political willingness to combat inflation. Yes, Powell could have a laser focus on addressing inflation right now, but I seriously doubt whether he will stick with significantly raising interest rates, especially when the economy starts to falter.
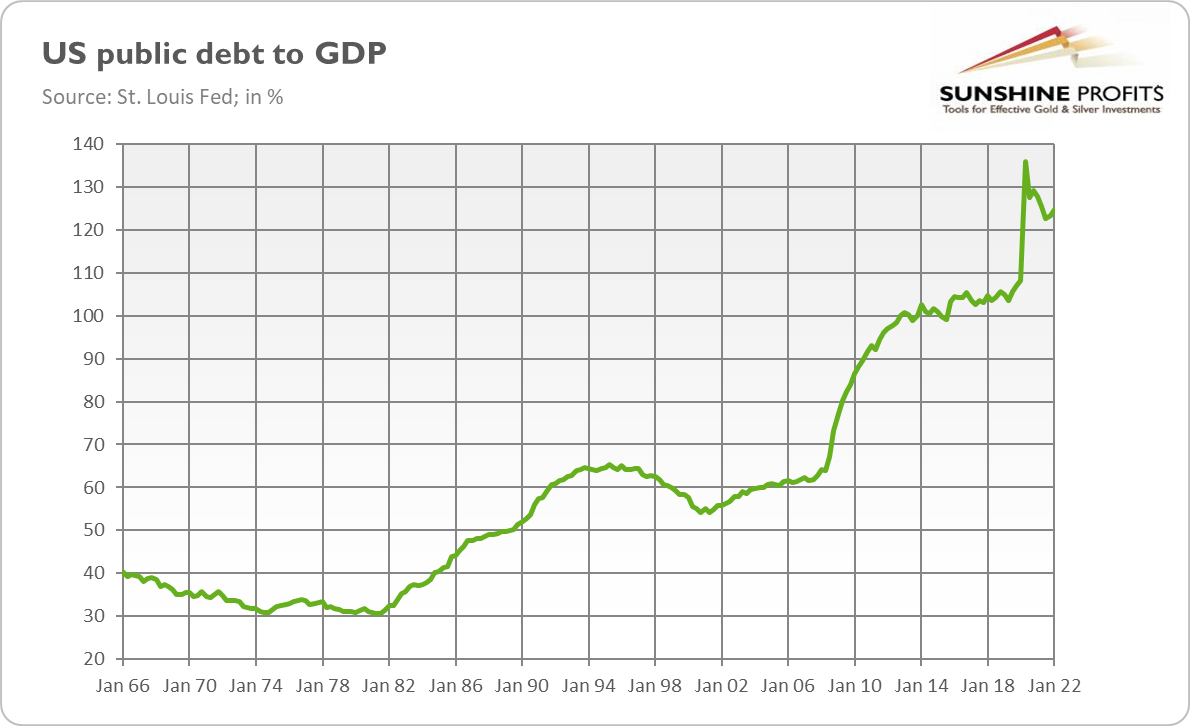
So, what are the conclusions and implications for the gold market? Well, stagflation is indeed likely, as I expect a further economic slowdown next year, which will be accompanied by stubbornly elevated inflation, although rather lower than this year, thanks to normalization in the pace of money supply growth and tightening of both monetary and fiscal policies. Hence, the upcoming stagflation could be less severe than in the 1970s.
The Fed’s response will also be less aggressive. Luckily for the yellow metal, Powell is not Volcker, so he won’t raise the federal funds rate so decisively. Hence, the current Fed’s tightening cycle could continue to exert downward pressure on gold. However, when the Fed chickens out and deviates from its hawkish plan when faced with recessionary winds, gold should rally again.
Thank you for reading today’s free analysis. If you enjoyed it, and would you like to know more about the links between the economic outlook, and the gold market, we invite you to read the July Gold Market Overview report. Please note that in addition to the above-mentioned free fundamental gold reports, and we provide premium daily Gold & Silver Trading Alerts with clear buy and sell signals. We provide these premium analyses also on a weekly basis in the form of Gold Investment Updates. In order to enjoy our gold analyses in their full scope, we invite you to subscribe today. If you’re not ready to subscribe yet though and are not on our gold mailing list yet, we urge you to sign up. It’s free and if you don’t like it, you can easily unsubscribe. Sign up today!
Arkadiusz Sieron, PhD
Sunshine Profits: Effective Investment through Diligence & Care.-----
Disclaimer: Please note that the aim of the above analysis is to discuss the likely long-term impact of the featured phenomenon on the price of gold and this analysis does not indicate (nor does it aim to do so) whether gold is likely to move higher or lower in the short- or medium term. In order to determine the latter, many additional factors need to be considered (i.e. sentiment, chart patterns, cycles, indicators, ratios, self-similar patterns and more) and we are taking them into account (and discussing the short- and medium-term outlook) in our Gold & Silver Trading Alerts.
-
Recession Is Coming. Should You Be Concerned?
June 24, 2022, 10:27 AMIt’s certain that the recession will come eventually. The questions are: when, how will it impact the market, and are there any reasons to be afraid?
Is a recession coming? Yes, it is! Recession is a normal part of a business cycle, so, yes, the current phase of economic boom will eventually turn into recession. That’s for sure.
The more tricky question is about timing: is a recession just around the corner, as more and more economists and analysts worry? Well, there are some disturbing economic signals worth looking at. First, in the first quarter of 2022, the real US GDP decreased 0.4% compared to the Q4 of 2021 (see the chart below), or 1.4% at an annualized rate, according to the advance estimates by the Bureau of Economic Analysis. The decline in GDP is always scary, but this time it shouldn’t be, as it resulted mainly from an increase in the trade deficit, i.e., the widening difference between exports and imports.
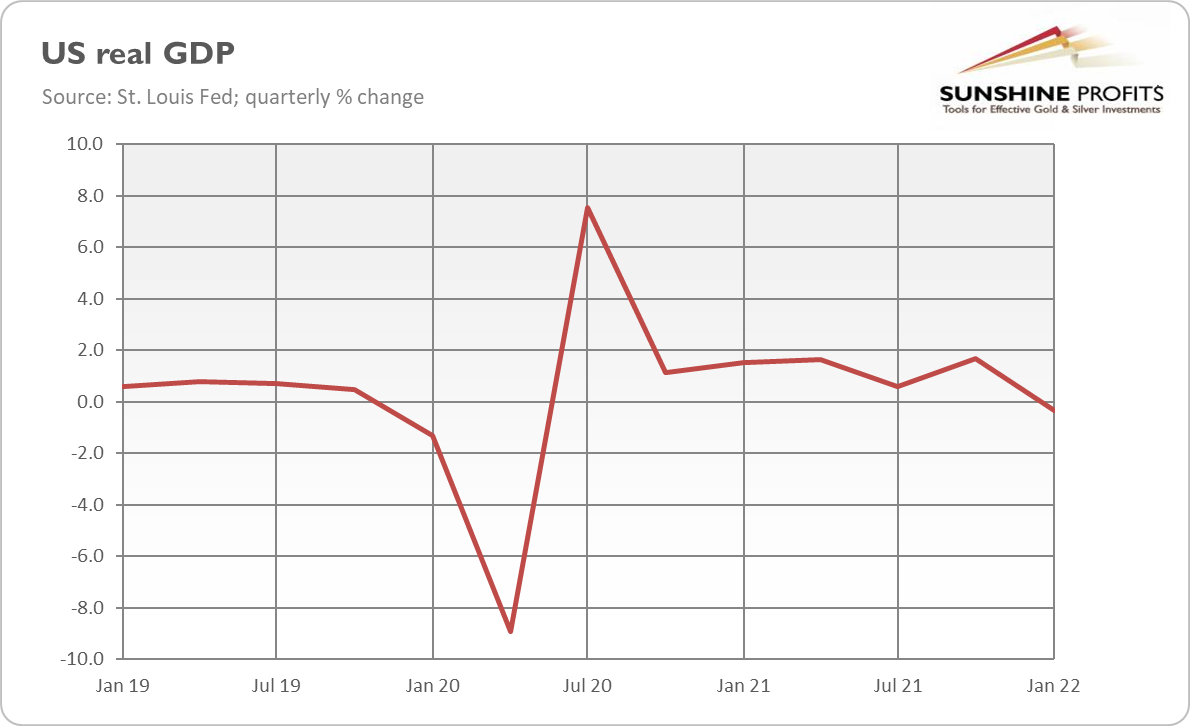
What happened is that supply chains improved, so imports of goods surged, causing the GDP to drop, as exports are added to the GDP while imports are subtracted from it. However, this is likely to reverse, as businesses won’t build inventories all the time. Moreover, consumers are switching their spending from goods to services, while China’s new lockdowns will cause fresh distortions in the supply chains, which will also reduce imports. Thus, the recent decline in GDP doesn’t signal a recession.
Second, the yield curve has inverted. As the chart below shows, the spread between 10-year and 2-year Treasuries turned briefly negative at the turn of March and April. The inversion of the yield curve is probably the strongest recessionary indicator, so it should be taken seriously.
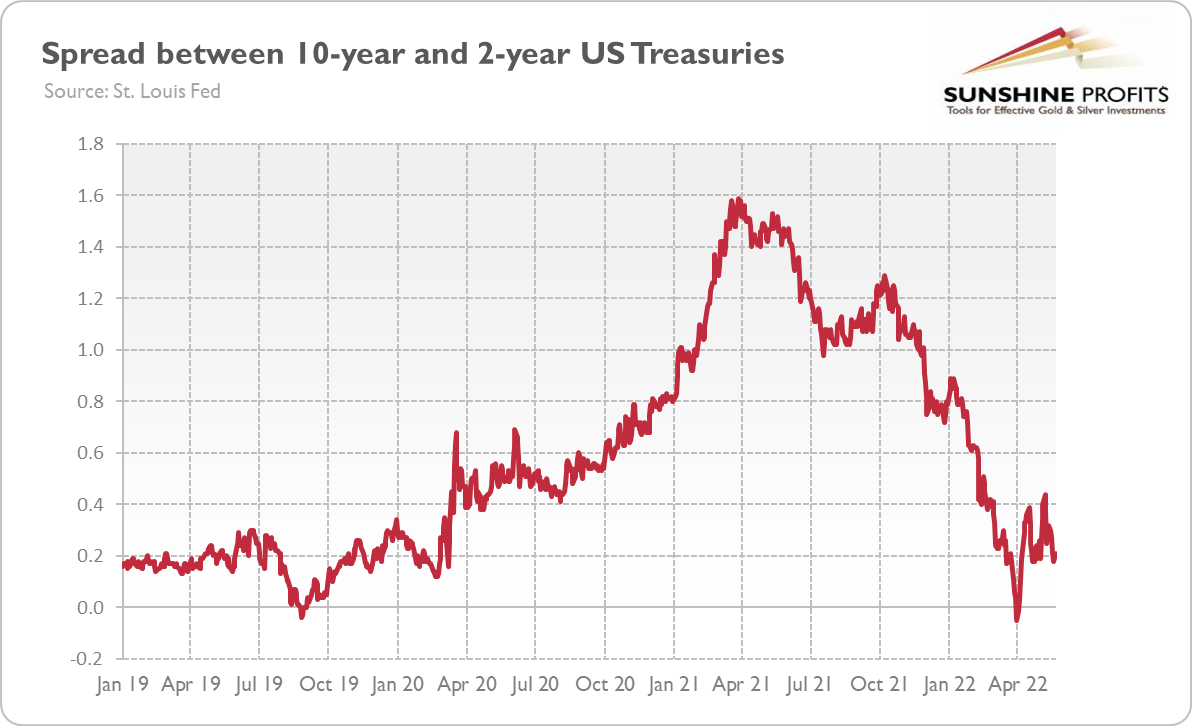
However, the spread between 10-year and 3-month Treasuries didn’t invert (neither the difference between 10-year yields and the federal fund rate). Actually, this spread became steeper in April, and is well above the negative territory, as the chart below.

This is very important as this maturity combination is believed to be the most accurate recessionary indicator, better than the use of 10-year and 2-year yields. In 2019, both curves inverted, which provided a much stronger recessionary signal. Hence, I wouldn’t use the recent brief inversion as a justification for strong recessionary calls, at least not yet, and I would wait for other confirming signals.
Third, there is a big correction in the US stock market. As the chart below shows, the S&P 500 Index plunged 18.7% from its all-time high in January, while Dow Jones sank 15%. Many people define a bear market as a situation when prices fall 20% or more from their recent highs. So, although we haven’t reached the bear market, we are very close to it.
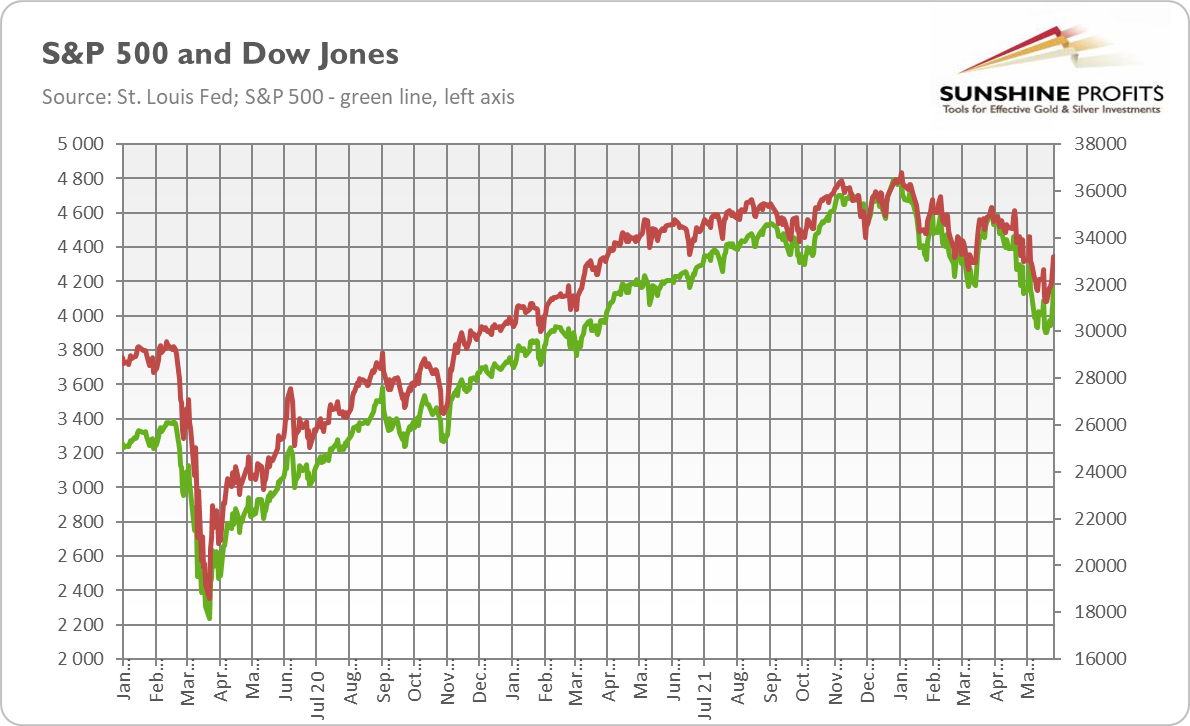
However, even if there is a technical bear market in stocks, it doesn’t have to imply an imminent recession. As the old joke goes, “the stock market has predicted nine of the past five recessions”. Bear markets are a normal part of the stock market’s functioning, and they don’t have to indicate economy-wide recessions.
Last but not definitely least, high inflation reduces real wages for most workers, negatively affecting spending and market sentiment. To combat such a high inflation, the Fed would have to hike the interest rates to a level that risks triggering a recession.
What does it all mean for the precious metals market? Well, gold generally shines during periods of economic crisis, so the upcoming recession would be great news for the yellow metal. But I don’t see it in the data yet, so, we will have to wait a little longer for the next rally in the gold market.
However, gold bulls shouldn’t feel disappointed. The economic outlook is generally gloomy. Economic growth has slowed down – the IMF cut its forecast for global growth this year to 3.6% from 4.4% expected in January and from 6.1% in 2021 – while inflation is still above 8%. There is a war in Europe, and the Fed is tightening its monetary policy and financial conditions. Such a mixture won’t end well, and – given how high is inflation already – I don’t believe that the Fed will engineer a soft landing.
Actually, I would say that a recession is almost certain within a few years – what is unsure is its reason. There are two options. The first is that the Fed will bring inflation under control. However, to do this now – when inflation is already high – it would have to raise interest rates and tighten monetary conditions in an aggressive manner that would likely cause a recession. The second scenario is that inflation remains unchecked and would produce sufficient economic distortions to lead to the recession on its own. One way or another, an economic downturn is coming!
Hence, my bet is that the next year – when the Fed’s tightening cycle will be much more advanced or even already ending, and we will be closer to recession – will be better for gold than 2022.
Thank you for reading today’s free analysis. If you enjoyed it, and would you like to know more about the links between the economic outlook, and the gold market, we invite you to read the June Gold Market Overview report. Please note that in addition to the above-mentioned free fundamental gold reports, and we provide premium daily Gold & Silver Trading Alerts with clear buy and sell signals. We provide these premium analyses also on a weekly basis in the form of Gold Investment Updates. In order to enjoy our gold analyses in their full scope, we invite you to subscribe today. If you’re not ready to subscribe yet though and are not on our gold mailing list yet, we urge you to sign up. It’s free and if you don’t like it, you can easily unsubscribe. Sign up today!
Arkadiusz Sieron, PhD
Sunshine Profits: Effective Investment through Diligence & Care.-----
Disclaimer: Please note that the aim of the above analysis is to discuss the likely long-term impact of the featured phenomenon on the price of gold and this analysis does not indicate (nor does it aim to do so) whether gold is likely to move higher or lower in the short- or medium term. In order to determine the latter, many additional factors need to be considered (i.e. sentiment, chart patterns, cycles, indicators, ratios, self-similar patterns and more) and we are taking them into account (and discussing the short- and medium-term outlook) in our Gold & Silver Trading Alerts.
-
Will Gold Save Souls During the Inflationary Apocalypse?
June 17, 2022, 10:06 AMWhile inflation continues to wreak havoc, gold is reluctant to respond. Will it finally change and the price of the yellow metal rise?
The Fourth Horseman of the Apocalypse
The end is nigh! There should be no doubt about it now, as more horsemen of the Apocalypse are coming (see the painting below). The first was Pestilence. Two years ago, the COVID-19 pandemic plunged the world into a Great Lockdown and the deepest recession since the Great Depression. At the end of February 2022, the Russian troops brought War and Death to the Ukraine. Also, say hello to Famine, another horseman. To be clear, I don’t mean ‘hunger’ in the United States or other developed countries (although people in besieged Mariupol are running out of drinking water and food), but rather dearth and dearness. In other words: inflation.
It doesn’t look very optimistic, indeed. As you can see in the chart below, the annual CPI rate has accelerated from 0.2% in May 2020 to over 8.0% in March and April 2022. Importantly, the core CPI, which excludes food and energy prices, has also surged recently, rallying from 1.25% two years ago to above 6.0% now.
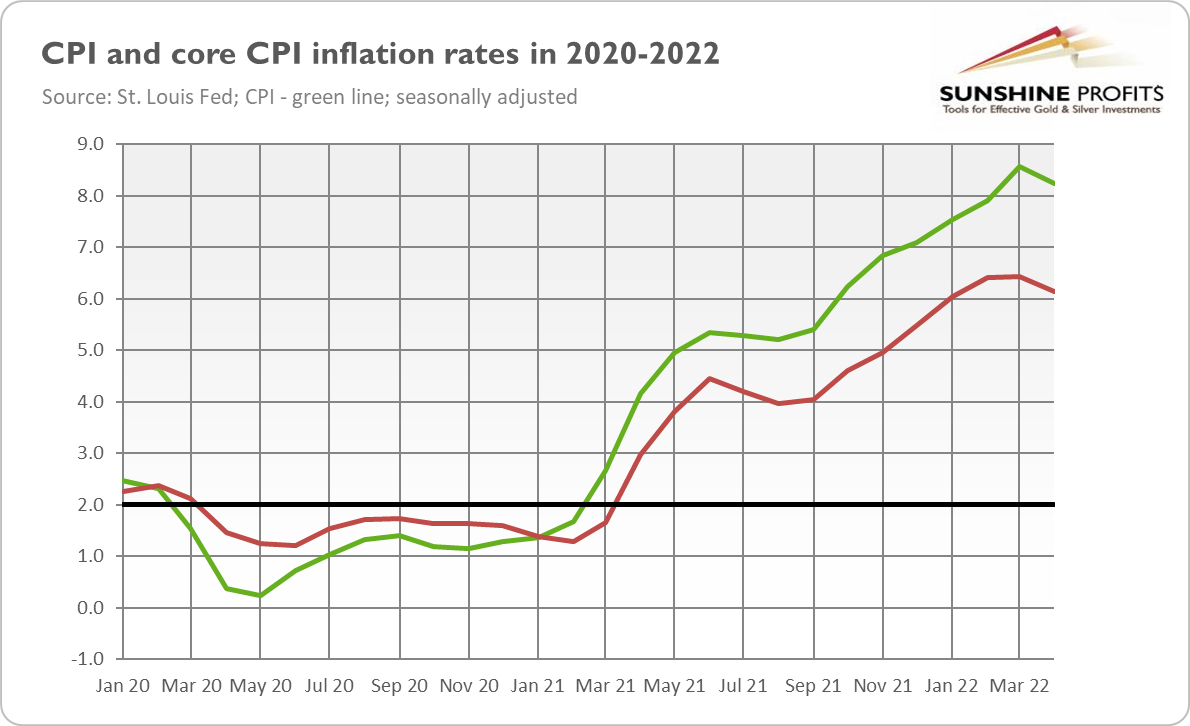
That’s a really high increase in the cost of living that hit society, especially the poor. There are already reports that people are skipping meals or taking desperate measures to save on heating costs (e.g., they are making fires in houses or, in the UK, pensioners are riding buses to keep warm and save on heating). As the chart below shows, March’s reading was the largest since December 1981 for the overall CPI and since August 1982 for the core CPI, as the chart below shows. And inflation rates were already retreating then, while today they are still on a rise.. Inflation rates were already retreating then, while today they are still on the rise.
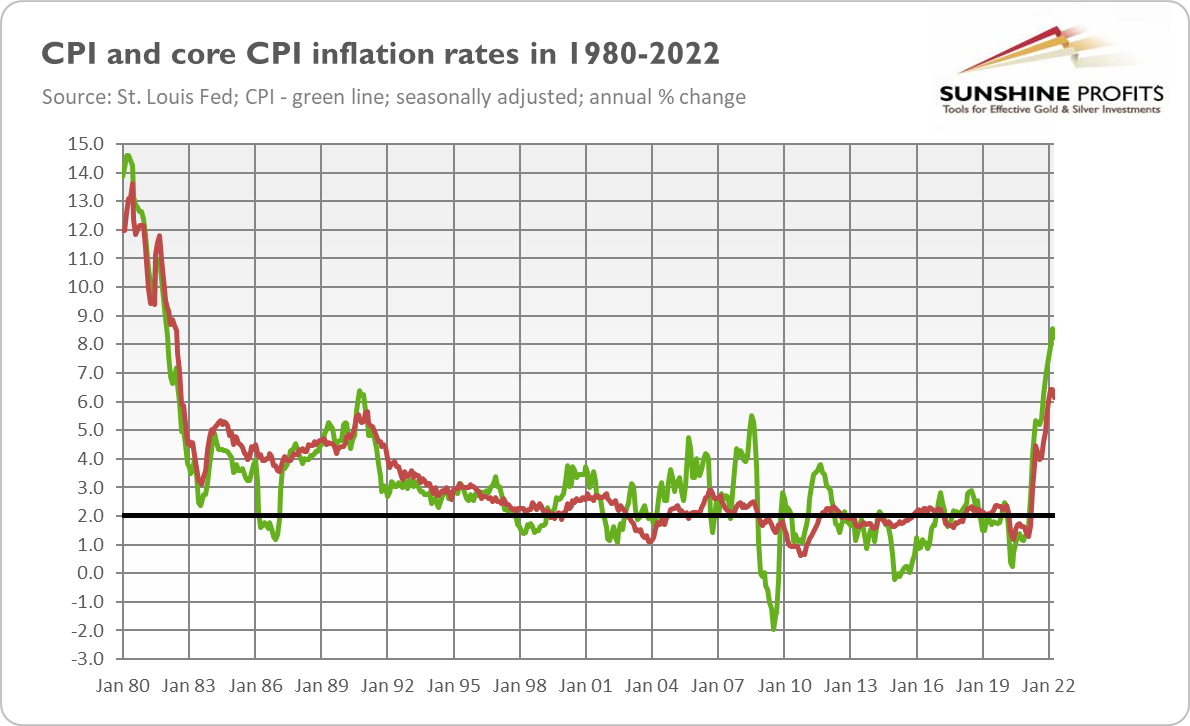
Are they? Well, inflation numbers in April came in slightly lower than in March, so it’s possible that inflation has already peaked. However, the rate was still higher than the consensus estimate of 8.1%, and it may be just a temporary pullback, similar to the one we saw in the summer of 2021. Inflation was less red-hot because gasoline prices declined 6.1% in April, but they spiked again in May (see the chart below), which will contribute to the upcoming inflationary reading.
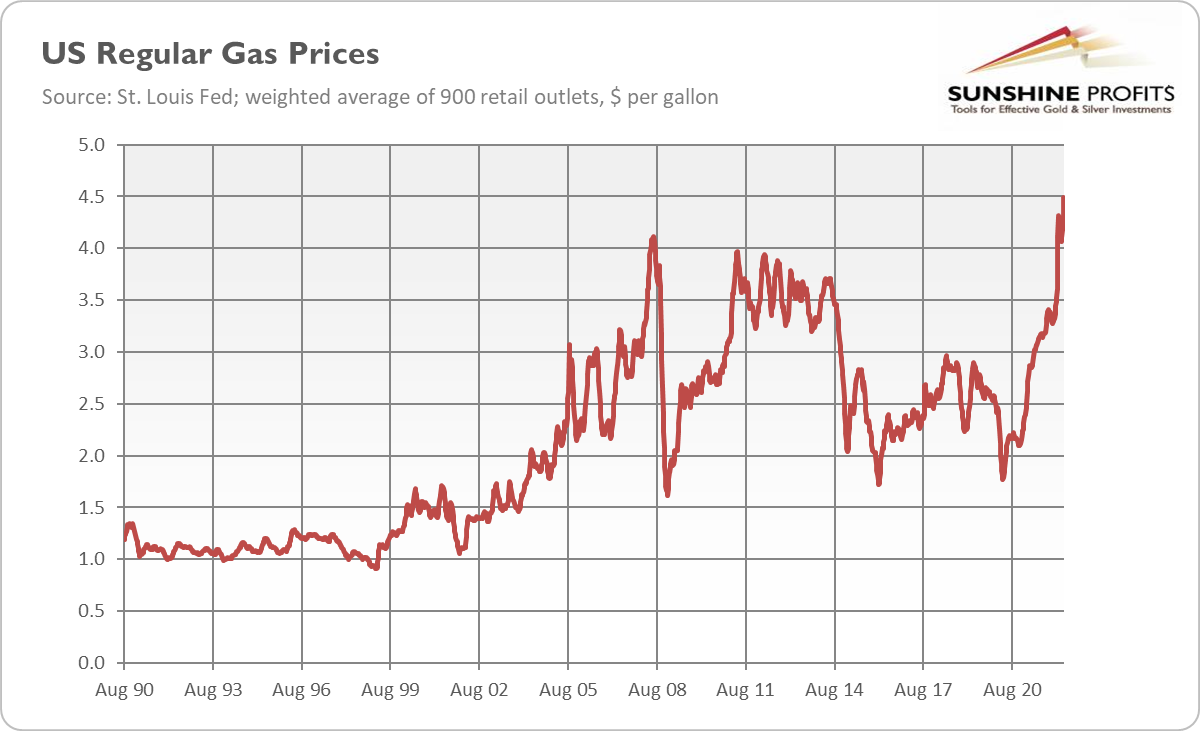
Moreover, as the chart below shows, the shelter index, which is the largest component of the CPI, has been constantly rising (as well as the producer price index), so there is an ongoing upward pressure on prices. Additionally, widespread lockdowns and an economic slowdown in China would hit the global supply chains again, strengthening the inflationary forces. Last but not least, the private savings boosted by the pandemic are still elevated, so consumers have resources they can tap. Hence, high inflation is likely to stay with us for some time.
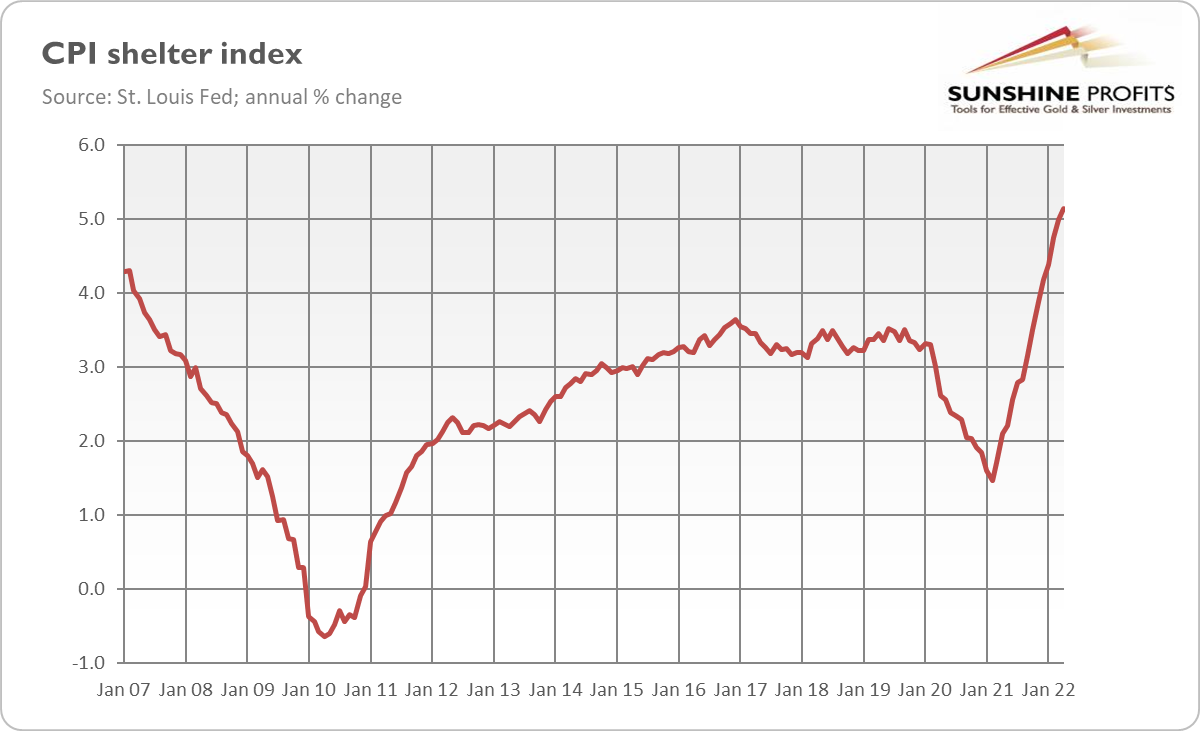
For how long? This is a great question that everyone is asking right now. On the one hand, the pace of growth in the money supply has recently slowed down, as the chart below shows, which gives us some hope for normalization in inflation in the future.
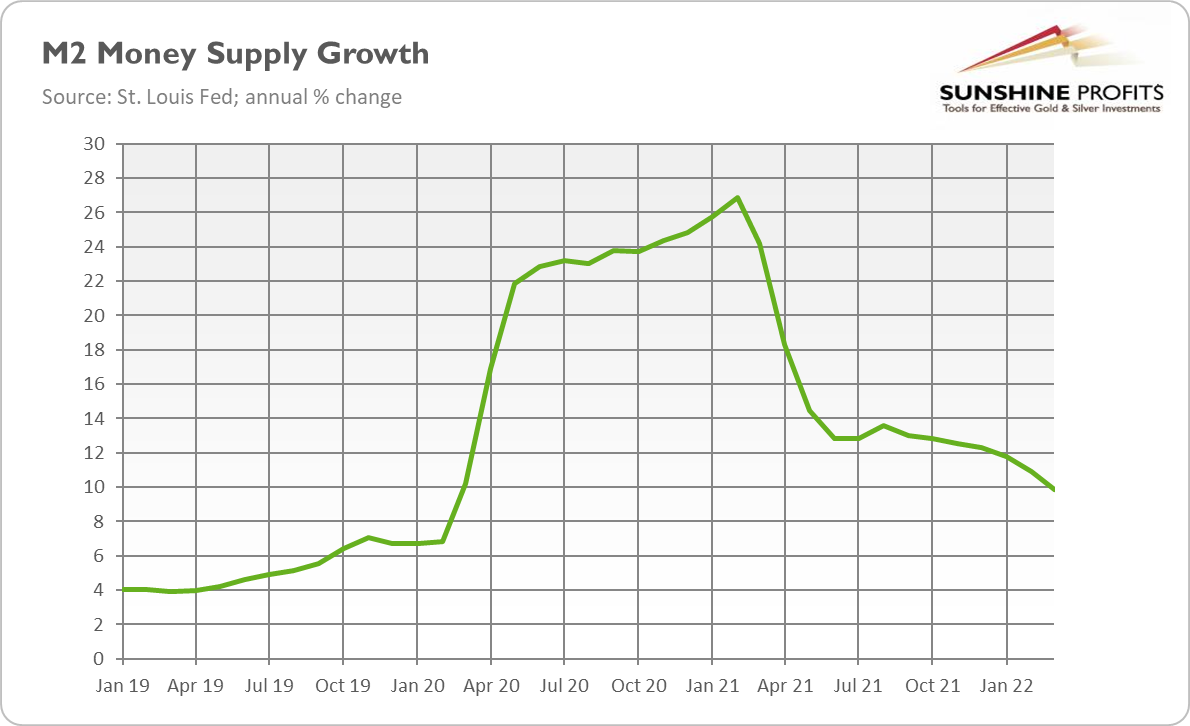
On the other hand, the pace still hasn’t returned to the pre-pandemic levels, so inflation won’t simply disappear. What’s more, there is still a huge overhang in the monetary ‘bathtub’ waiting to come out through the pipeline as inflation. You see, the broad money supply increased by about $6.4 trillion between February 2020 and March 2022, while the real GDP rose by just $2.5 trillion. In other words, the money supply surged far more that what could be absorbed by economic growth, and the rest of the newly created money must be accumulated by higher prices (and increased demand for money, but let’s not complicate things here). Hence, the decline in the inflation rate in April shouldn’t be viewed as the beginning of disinflation. Elevated inflation is likely to remain with us this year, and possibly also in 2023.
Good News for Gold?
What does it imply for the gold market? Theoretically, it should be great news, as gold usually shines during periods of high and accelerating inflation. However, “usually” does not mean “always”. As we all know, gold has failed to rise in tandem with the current inflation so far and has been unable to break free from the $2,000 level. As the chart below shows, the yellow metal has remained in a downward trend since March 2022, if not August 2020.
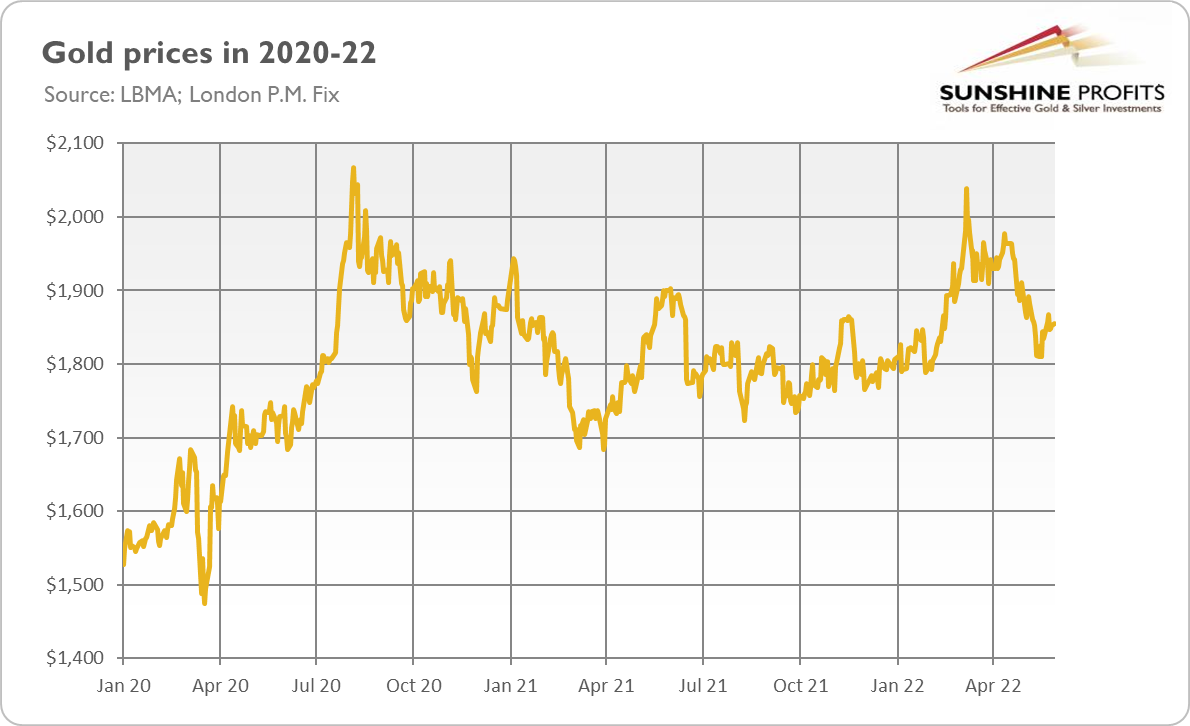
One of the reasons for gold’s disappointing behavior is that rising inflation was accompanied by expectations of higher interest rates. Given the already hawkish stance of the Fed, prolonged inflation could only increase the Fed’s tightening cycle even more.. This is why the real interest rates have surged recently despite rising inflation, which is clearly not good news for the yellow metal.
The only hope for gold is that either inflation or the US central bank’s response to it will eventually trigger a recession. Well, it will occur one day, but not yet – with all that money still in the bathtub and generating overflow in the form of price inflation, the economy still seems overheated. This is probably another reason why gold didn’t rally like it did in the 1970s. To be clear, the economic outlook has darkened recently and the risk of stagflation has increased. However, the end is not nigh – unless it is…
Thank you for reading today’s free analysis. If you enjoyed it, and would you like to know more about the links between the economic outlook, and the gold market, we invite you to read the June Gold Market Overview report. Please note that in addition to the above-mentioned free fundamental gold reports, and we provide premium daily Gold & Silver Trading Alerts with clear buy and sell signals. We provide these premium analyses also on a weekly basis in the form of Gold Investment Updates. In order to enjoy our gold analyses in their full scope, we invite you to subscribe today. If you’re not ready to subscribe yet though and are not on our gold mailing list yet, we urge you to sign up. It’s free and if you don’t like it, you can easily unsubscribe. Sign up today!
Arkadiusz Sieron, PhD
Sunshine Profits: Effective Investment through Diligence & Care.-----
Disclaimer: Please note that the aim of the above analysis is to discuss the likely long-term impact of the featured phenomenon on the price of gold and this analysis does not indicate (nor does it aim to do so) whether gold is likely to move higher or lower in the short- or medium term. In order to determine the latter, many additional factors need to be considered (i.e. sentiment, chart patterns, cycles, indicators, ratios, self-similar patterns and more) and we are taking them into account (and discussing the short- and medium-term outlook) in our Gold & Silver Trading Alerts.
-
Real Interest Rates Turn Positive, but It’s Negative for Gold
June 6, 2022, 12:15 PMThe recipe for happiness is to see the bright side of even negative situations. Positive interest rates are rather bad news for gold. Here’s why.
This is a huge change, perhaps a game-changer! What do I mean? The chart below – which is one of the most important charts about the current US economy and the gold market – tells the whole story.
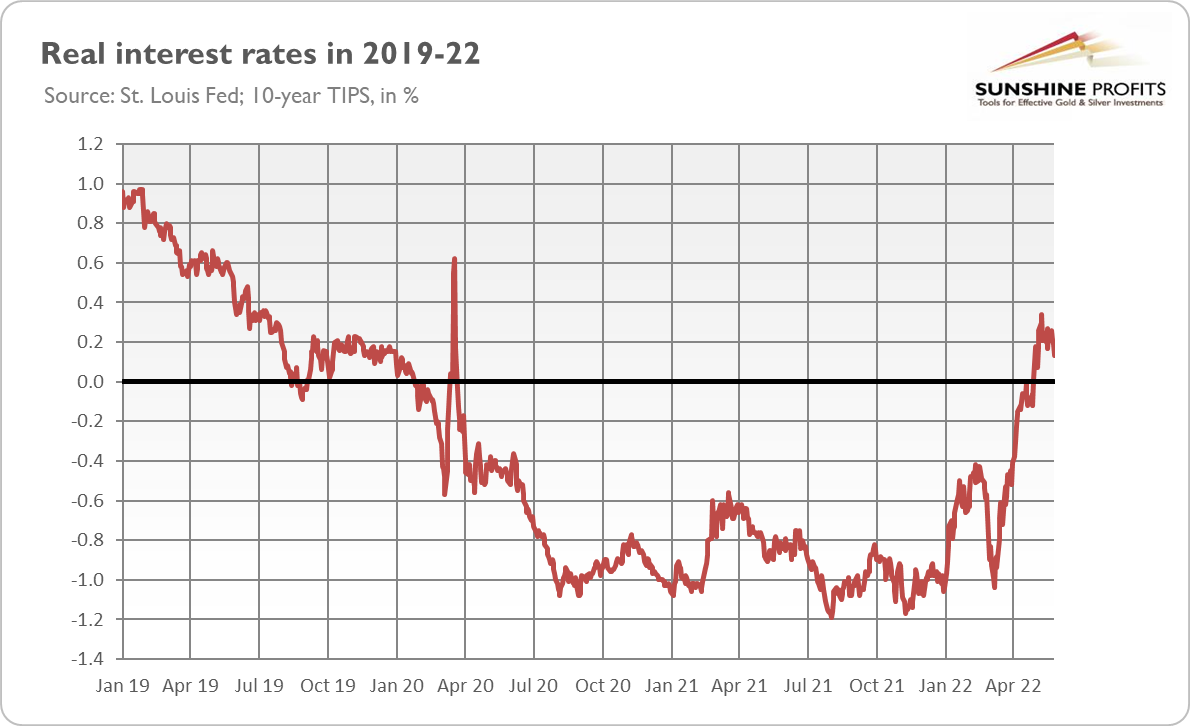
Do you see what I see? The US real interest rates – measured here by 10-year inflation-indexed Treasury yields – have finally returned above zero. It means that the real interest rates are no longer negative. This is a big story!
Why? Because gold performs much better during periods of negative real interest rates than positive ones. This is because gold is a non-interest-bearing asset, so the higher interest rates, the higher the opportunity cost of holding gold, and vice versa. In other words, when real rates are negative, owning the yellow metal is more attractive, but when rates are positive, holding gold becomes less alluring.
To be sure, the real interest rates remain very low, and at levels close to zero, they don’t have to strongly hit the yellow metal. However, gold is usually strongly correlated to the real interest rates (please see the chart below), so their further rise could be detrimental to gold.
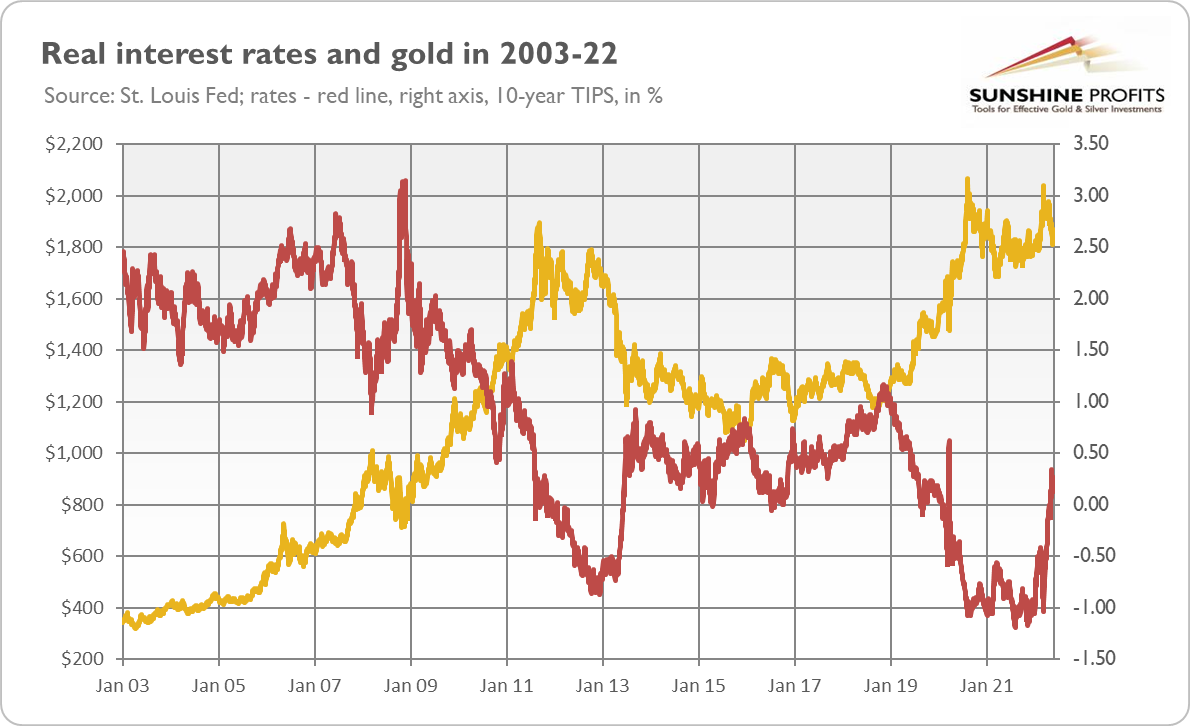
Indeed, if history is any guide, dark clouds may lie ahead for gold. The previous case of normalization of interest rates in 2012-2013 pushed the yellow metal into the bear market. The surge in the real interest rates from -0.87% to 0.92% was accompanied by a plunge in gold prices by 18.2%, from around $1,700 to around $1,390, and even lower later.
This time, the real interest rates have soared from around -1.0% to around 0.25% by the end of May. So far, gold’s response was rather limited, i.e., it declined from $2,039 to $1,810, or 11%. However, if we see further increases in the real rates, gold may continue its downward move. Given how high inflation is, the upswing in real interest rates has much further to go, and this is also what some Fed officials suggest. For example, Fed Governor Christopher Waller said at the end of May:
If inflation doesn't go away, that (...) rate is going a lot higher, and soon (…). We are not going to sit there and wait six months (...). I am advocating 50 on the table every meeting until we see substantial reductions in inflation. Until we get that, I don’t see the point of stopping.
However, every cloud has a silver lining. A large part of the upward move in the real interest rates is probably already behind us. I think that the bond yields may increase further, as both inflation and the Fed didn’t say the last word, but the move should be limited. The key difference between 2012-2013 and now is that the taper tantrum was accompanied by moderation of inflation and expectations of an acceleration in economic growth. Now, the Fed’s tightening cycle is occurring amid high inflation but also collapsing economic growth expectations and a slowdown in GDP growth. This is also what markets are betting on right now. They dialed back interest rate expectations, assuming that the worsening economic data might force the Fed to adopt a less aggressive stance.
Moreover, the level of both private and public debt is much higher, which makes the economy more sensitive to interest rate hikes. Positive real interest rates imply the end of the era of ultra-low rates and ultra-easy money. All debtors, including the Treasury, will now have to pay more in interest. The tightening of financial conditions could put many borrowers in trouble. Hence, the macroeconomic environment is more supportive of gold prices than a decade ago.
Indeed, so far we’ve had high inflation accompanied by fast economic growth. However, as I warned many times, the impressive pace of growth resulted simply from the rebound from a deep recession, and it was impossible to maintain. Hence, we are moving closer to stagflation, gold’s favorite macroeconomic conditions. Stagnation has been so far the missing part of the equation, which is why gold didn’t react positively to high inflation, but this may change in the future. In 2022, America should keep its head above water, but 2023 may be a truly challenging year – which bodes well, at least for gold.
However, it may take some time before the new rally in gold starts. Prices should remain in a downward (or sideways) trend until the real interest rates reach a peak, as they did in 2008 (or at the end of 2018). They’ve retreated recently, as investors are focusing more on the risk of recession and less on inflation, but upward move in interest rates can resume after a while, especially if inflation is again above market expectations.
Thank you for reading today’s free analysis. If you enjoyed it, and would you like to know more about the links between the economic outlook, and the gold market, we invite you to read the June Gold Market Overview report. Please note that in addition to the above-mentioned free fundamental gold reports, and we provide premium daily Gold & Silver Trading Alerts with clear buy and sell signals. We provide these premium analyses also on a weekly basis in the form of Gold Investment Updates. In order to enjoy our gold analyses in their full scope, we invite you to subscribe today. If you’re not ready to subscribe yet though and are not on our gold mailing list yet, we urge you to sign up. It’s free and if you don’t like it, you can easily unsubscribe. Sign up today!
Arkadiusz Sieron, PhD
Sunshine Profits: Effective Investment through Diligence & Care.-----
Disclaimer: Please note that the aim of the above analysis is to discuss the likely long-term impact of the featured phenomenon on the price of gold and this analysis does not indicate (nor does it aim to do so) whether gold is likely to move higher or lower in the short- or medium term. In order to determine the latter, many additional factors need to be considered (i.e. sentiment, chart patterns, cycles, indicators, ratios, self-similar patterns and more) and we are taking them into account (and discussing the short- and medium-term outlook) in our Gold & Silver Trading Alerts.
-
Is There Any Gold in Virtual Worlds Like Metaverse?
March 25, 2022, 6:47 AMImagine all the people… living life in the Metaverse. Once we immerse ourselves in the digital sphere, gold may go out of fashion. Or maybe not?
Do you already have your avatar? If not, maybe you should consider creating one, as the Metaverse is coming! What is the Metaverse? It is a digital, three-dimensional world where people are represented by avatars, a network of 3D virtual worlds focused on social connection, the next evolution of the internet, “extended reality,” and the latest buzzword in the marketplace since Facebook changed its name to Meta. If you still have no idea what I’m talking about, you can watch this educational video or just Spielberg’s Ready Player One.
The idea of personalities being uploaded online is an intriguing concept, isn’t it? In this vision, people meet with others, play, and simply hang out in a digital world. Imagine friends turning group chats on Messenger or WhatsApp into group meetups in the Metaverse of family gatherings in virtual homes. Ultimately, people will probably be doing pretty much everything there, except eating, sleeping, and using the restroom.
Sounds scary? For people in their 30s and older who were fascinated by The Matrix, it does. However, this is really happening. The augmented reality technology market is expected to grow from $47 billion in 2019 to $1.5 trillion in 2030, mainly thanks to the development of the Metaverse. China’s virtual goods and services market is expected to be worth almost $250 billion this year and $370 billion in the next four years.
In a sense, it had to happen as the next phase of the digital revolution. You see, we now experience much of life on the two-dimensional screens of our laptops and smartphones. The Metaverse moves us from a flat and boring 2D to a 3D virtual universe, where we can visualize and experience things with a more natural user interface. Let’s take shopping as an example. Instead of purchasing items on Amazon, customers could enter a virtual shop, see and touch all products in 3D, and buy whatever they wanted (actually, Walmart launched its own 3D shopping experience in 2018).
OK, we get the idea, but why does Metaverse matter, putting aside sociological or philosophical issues related to transferring our minds into the digital world? Well, it might strongly affect every aspect of business and life, just as the internet did earlier. Here are a couple of examples. Famous brands, like Dolce & Gabbana, are designing clothes and jewelry for the digital world. Some artists are giving concerts in virtual reality. You could also visit some museums virtually, and instead of taking a business trip, you can digitally teleport to remote locations to meet with your co-workers’ avatars.
Finally, what does the Metaverse imply for the gold market? Well, it’s difficult to grasp all the possible implications right now. However, the main threat is clear: as people immerse deeper and deeper into the digital world, gold could become obsolete for many users. Please note that cryptocurrencies and non-fungible tokens (NFTs) are and will continue to be widely used as payment methods in the Metaverse.
However, there are some caveats here. First, the invention and spread of the internet didn’t sink gold. Actually, the internet enabled gold to be widely traded by investors all over the world. Just take a look at the chart below. Although gold was in a bear market in the 1990s and struggled during the dot-com bubble, it rallied after the bubble burst.
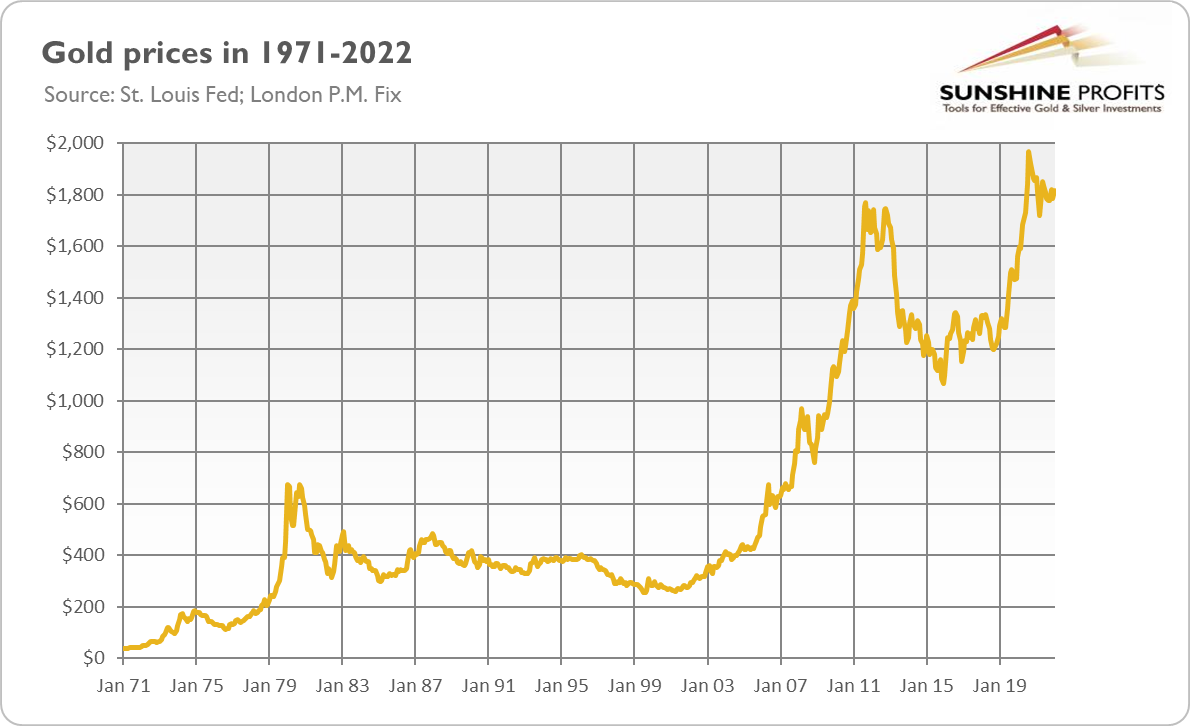
Second, the digital world didn’t kill the analog reality. Despite digital streaming of music, vinyl record sales soared last year, reaching a record high in a few decades. The development of the Metaverse could trigger a similar backlash and a return to tangible goods like gold.
Third, some segments of the Metaverse look like bubbles. Maybe I’m just too old, but why the heck would anybody spend hundreds of thousands, or even millions of dollars to buy items in the virtual world? These items include virtual real estates (CNBC says that sales of real estate in the metaverse topped $500 million last year and could double this year), digital pieces of art or even tweets (yup, the founder of Twitter sold the first tweet ever for just under $3 million)! It does not make any sense to me, as I can right-click and download a copy of the same digital files (like a PNG file of a grey pet rock) for which people pay thousands and millions of dollars.
Of course, certain items could increase the utility of the game or virtual experience, but my bet is that at least some buyers simply speculate on prices, expecting that they will be able to resell these items to greater fools. When this digital gold rush ends – and given the Fed’s tightening cycle, it may happen in the not-so-distant future – real gold could laugh last.
Thank you for reading today’s free analysis. If you enjoyed it, and would you like to know more about the links between the economic outlook, and the gold market, we invite you to read the March Gold Market Overview report. Please note that in addition to the above-mentioned free fundamental gold reports, and we provide premium daily Gold & Silver Trading Alerts with clear buy and sell signals. We provide these premium analyses also on a weekly basis in the form of Gold Investment Updates. In order to enjoy our gold analyses in their full scope, we invite you to subscribe today. If you’re not ready to subscribe yet though and are not on our gold mailing list yet, we urge you to sign up. It’s free and if you don’t like it, you can easily unsubscribe. Sign up today!
Arkadiusz Sieron, PhD
Sunshine Profits: Effective Investment through Diligence & Care.-----
Disclaimer: Please note that the aim of the above analysis is to discuss the likely long-term impact of the featured phenomenon on the price of gold and this analysis does not indicate (nor does it aim to do so) whether gold is likely to move higher or lower in the short- or medium term. In order to determine the latter, many additional factors need to be considered (i.e. sentiment, chart patterns, cycles, indicators, ratios, self-similar patterns and more) and we are taking them into account (and discussing the short- and medium-term outlook) in our Gold & Silver Trading Alerts.
-
Inflation Will Settle Gold’s Future - Better Watch It Closely
March 18, 2022, 9:35 AMInflation continues to rise but may soon reach its peak. After that, its fate will be sealed: a gradual decline. Does the same await gold?If you like inviting people over, you’ve probably figured out that some guests just don’t want to leave, even when you’re showing subtle signs of fatigue. They don’t seem to care and keep telling you the same not-so-funny jokes. Even in the hall, they talk lively and tell stories for long minutes because they remembered something very important. Inflation is like that kind of guest – still sitting in your living room, even after you turned off the music and went to wash the dishes, yawning loudly.
Indeed, high inflation simply does not want to leave. Actually, it’s gaining momentum. As the chart below shows, core inflation, which excludes food and energy, rose 6.0% over the past 12 months, speeding up from 5.5% in the previous month. Meanwhile, the overall CPI annual rate accelerated from 7.1% in December to 7.5% in January.
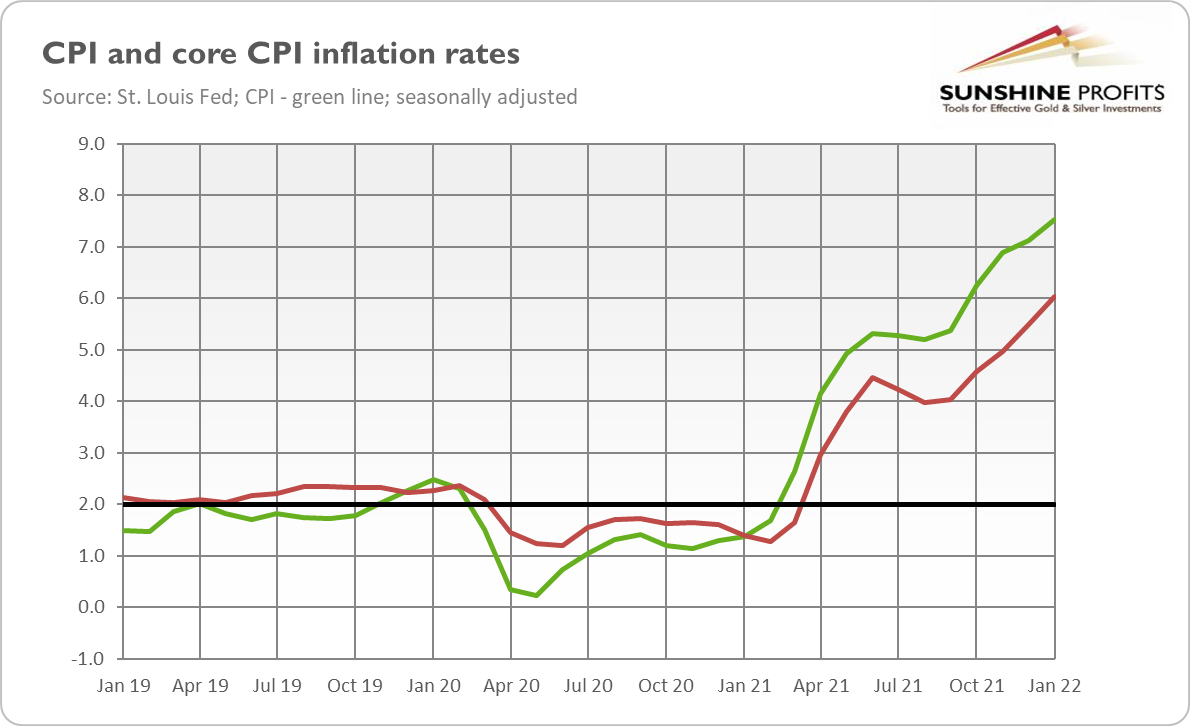
It’s been the largest 12-month increase since the period ending February 1982. However, at the time, Paul Volcker raised interest rates to double digits and inflation was easing. Today, inflation continues to rise, but the Fed is only starting its tightening cycle. The Fed’s strategy to deal with inflation is presented in the meme below.
What is important here is that the recent surge in inflation is broad-based, with virtually all index components showing increases over the past 12 months. The share of items with price rises of over 2% increased from less than 60% before the pandemic to just under 90% in January 2022.
As the chart below shows, the index for shelter is constantly rising and – given the recent spike in “asking rents” – is likely to continue its upward move for some time, adding to the overall CPI. What’s more, the Producer Price Index is still red-hot, which suggests that more inflation is in the pipeline, as companies will likely pass on the increased costs to consumers.
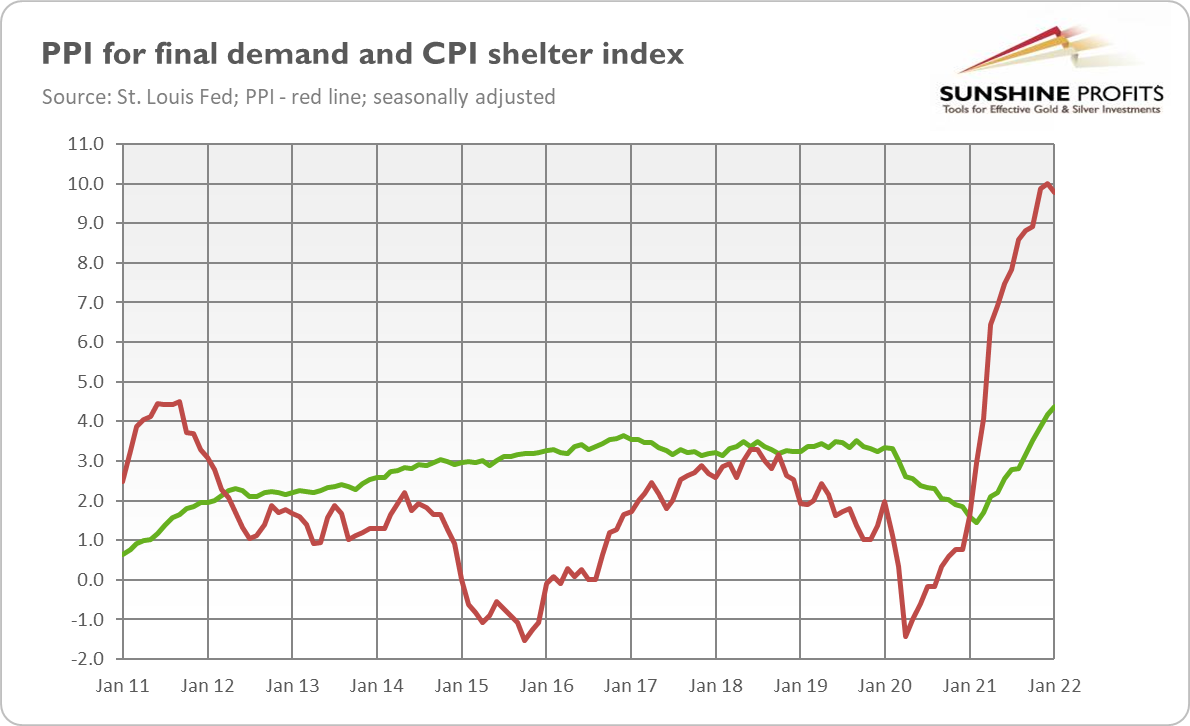
So, will inflation peak anytime soon or will it become embedded? There are voices that – given the huge monetary expansion conducted in response to the epidemic – high inflation will be with us for the next two or three years, especially when inflationary expectations have risen noticeably. I totally agree that high inflation won’t go away this year.
Please just take a look at the chart below, which shows that the pandemic brought huge jumps in the ratio of broad money to GDP. This ratio has increased by 23%, from Q1 2020 to Q4 2021, while the CPI has risen only 7.7% in the same period. It suggests that the CPI has room for a further increase.
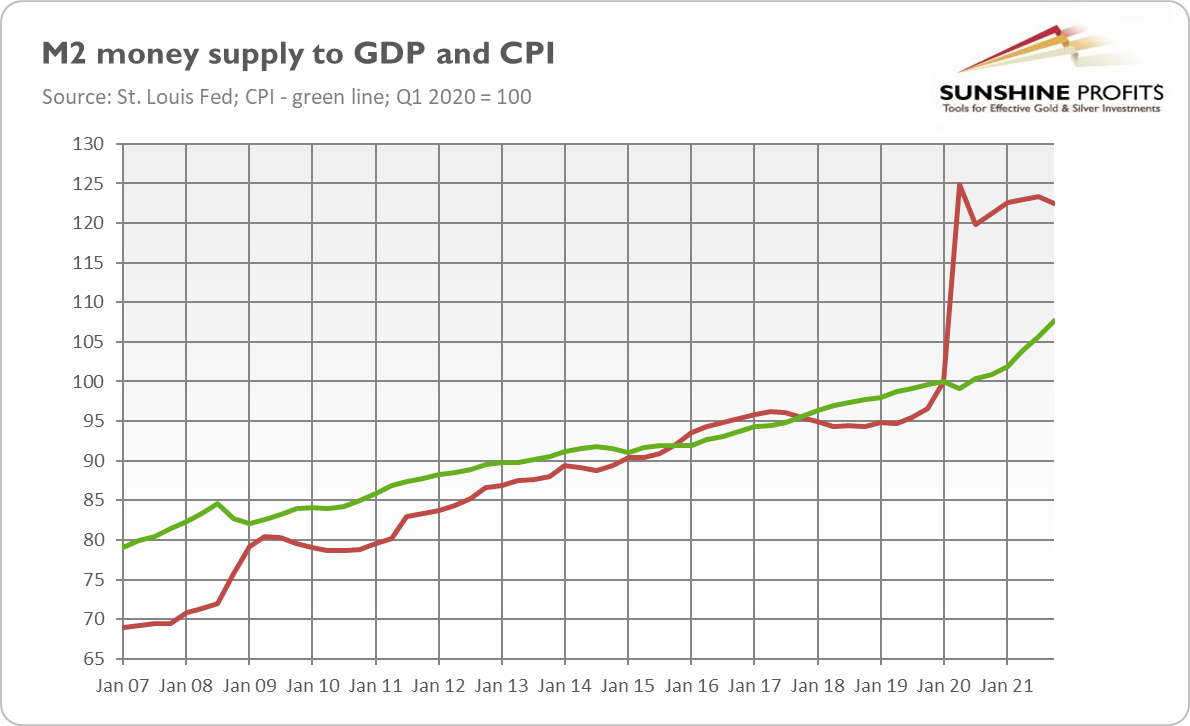
What’s more, the pace of growth in money supply is still far above the pre-pandemic level, as the chart below shows. To curb inflation, the Fed would have to more decisively turn off the tap with liquidity and hike the federal funds rate more aggressively.
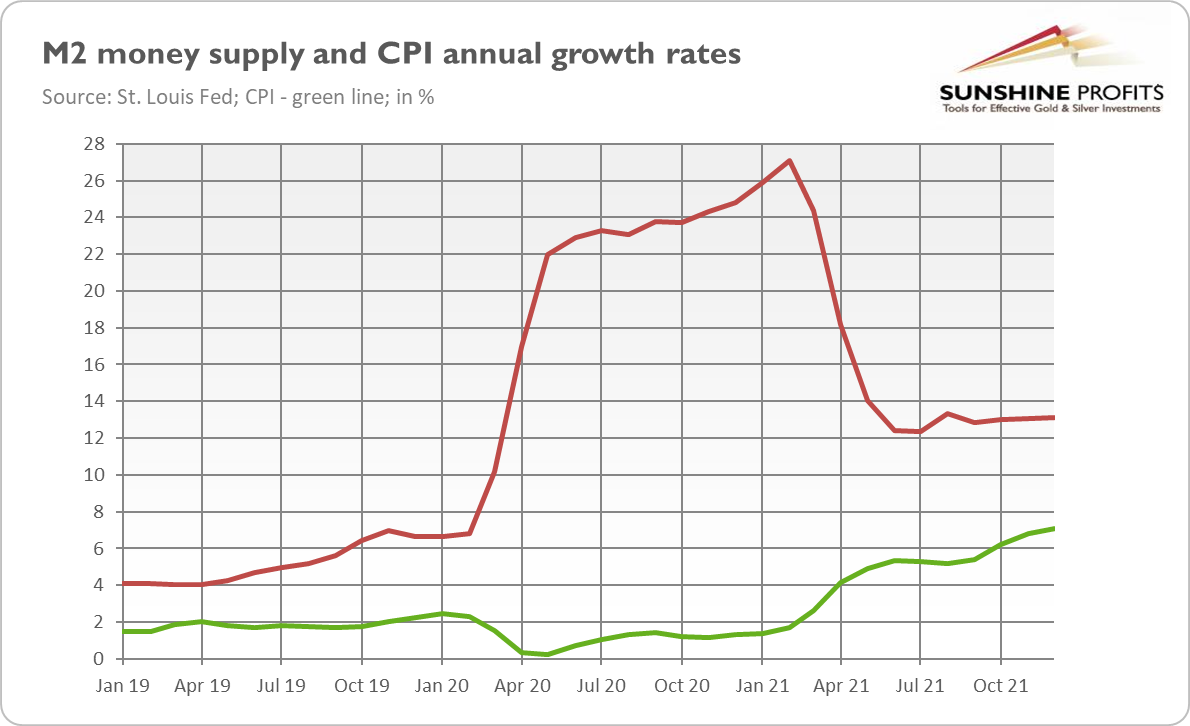
However, as shown in the chart above, money supply growth peaked in February 2021. Thus, after a certain lag, the inflation rate should also reach a certain height. It usually takes about a year or a year and a half for any excess money to show up as inflation, so the peak could arrive within a few months, especially since some of the supply disruptions should start to ease in the near future.
What does this intrusive inflation imply for the precious metals market? Well, the elevated inflationary pressure should be supportive of gold prices. However, I’m afraid that when disinflation starts, the yellow metal could suffer. The decline in inflation rates implies weaker demand for gold as an inflation hedge and also higher real interest rates.
The key question is, of course, what exactly will be the path of inflation. Will it normalize quickly or gradually, or even stay at a high plateau after reaching a peak? I don’t expect a sharp disinflation, so gold may not enter a 1980-like bear market.
Another question of the hour is whether inflation will turn into stagflation. So far, the economy is growing, so there is no stagnation. However, growth is likely to slow down, and I wouldn’t be surprised by seeing some recessionary trends in 2023-2024. Inflation should still be elevated then, creating a perfect environment for the yellow metal. Hence, the inflationary genie is out of the bottle and it could be difficult to push it back, even if inflation peaks in the near future.
Thank you for reading today’s free analysis. If you enjoyed it, and would you like to know more about the links between the economic outlook, and the gold market, we invite you to read the March Gold Market Overview report. Please note that in addition to the above-mentioned free fundamental gold reports, and we provide premium daily Gold & Silver Trading Alerts with clear buy and sell signals. We provide these premium analyses also on a weekly basis in the form of Gold Investment Updates. In order to enjoy our gold analyses in their full scope, we invite you to subscribe today. If you’re not ready to subscribe yet though and are not on our gold mailing list yet, we urge you to sign up. It’s free and if you don’t like it, you can easily unsubscribe. Sign up today!
Arkadiusz Sieron, PhD
Sunshine Profits: Effective Investment through Diligence & Care.-----
Disclaimer: Please note that the aim of the above analysis is to discuss the likely long-term impact of the featured phenomenon on the price of gold and this analysis does not indicate (nor does it aim to do so) whether gold is likely to move higher or lower in the short- or medium term. In order to determine the latter, many additional factors need to be considered (i.e. sentiment, chart patterns, cycles, indicators, ratios, self-similar patterns and more) and we are taking them into account (and discussing the short- and medium-term outlook) in our Gold & Silver Trading Alerts.
-
Gold Likes Recessions - Could High Interest Rates Lead to One?
March 11, 2022, 10:22 AMWe live in uncertain times, but one thing is (almost) certain: the Fed’s tightening cycle will be followed by an economic slowdown – if not worse.
There are many regularities in nature. After winter comes spring. After night comes day. After the Fed’s tightening cycle comes a recession. This month, the Fed will probably end quantitative easing and lift the federal funds rate. Will it trigger the next economic crisis?
It’s, of course, more nuanced, but the basic mechanism remains quite simple. Cuts in interest rates, maintaining them at very low levels for a prolonged time, and asset purchases – in other words, easy monetary policy and cheap money – lead to excessive risk-taking, investors’ complacency, periods of booms, and price bubbles. On the contrary, interest rate hikes and withdrawal of liquidity from the markets – i.e., tightening of monetary policy – tend to trigger economic busts, bursts of asset bubbles, and recessions. This happens because the amount of risk, debt, and bad investments becomes simply too high.
Historians lie, but history – never does. The chart below clearly confirms the relationship between the Fed’s tightening cycle and the state of the US economy. As one can see, generally, all recessions were preceded by interest rate hikes. For instance, in 1999-2000, the Fed lifted the interest rates by 175 basis points, causing the burst of the dot-com bubble. Another example: in the period between 2004 and 2006, the US central bank raised rates by 425 basis points, which led to the burst of the housing bubble and the Great Recession.
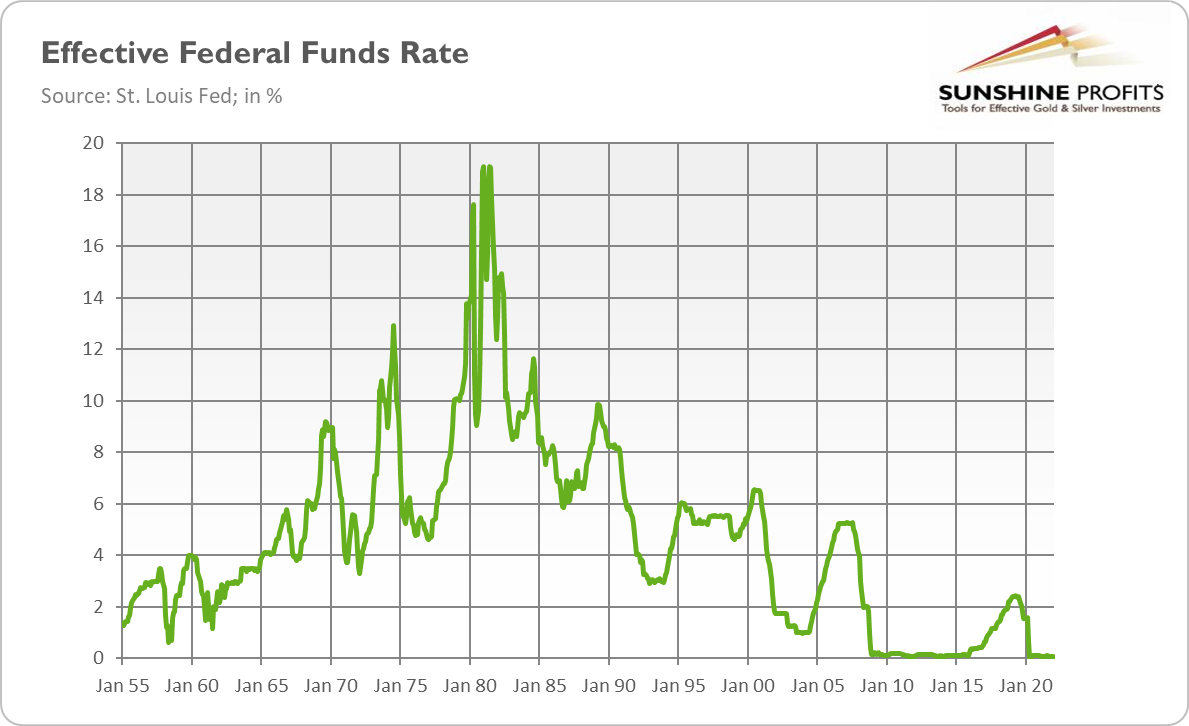
One could argue that the 2020 economic plunge was caused not by US monetary policy but by the pandemic. However, the yield curve inverted in 2019 and the repo crisis forced the Fed to cut interest rates. Thus, the recession would probably have occurred anyway, although without the Great Lockdown, it wouldn’t be so deep.
However, not all tightening cycles lead to recessions. For example, interest rate hikes in the first half of the 1960s, 1983-1984, or 1994-1995 didn’t cause economic slumps. Hence, a soft landing is theoretically possible, although it has previously proved hard to achieve. The last three cases of monetary policy tightening did lead to economic havoc.
It goes without saying that high inflation won’t help the Fed engineer a soft landing. The key problem here is that the US central bank is between an inflationary rock and a hard landing. The Fed has to fight inflation, but it would require aggressive hikes that could slow down the economy or even trigger a recession. Another issue is that high inflation wreaks havoc on its own. Thus, even if untamed, it would lead to a recession anyway, putting the economy into stagflation. Please take a look at the chart below, which shows the history of US inflation.
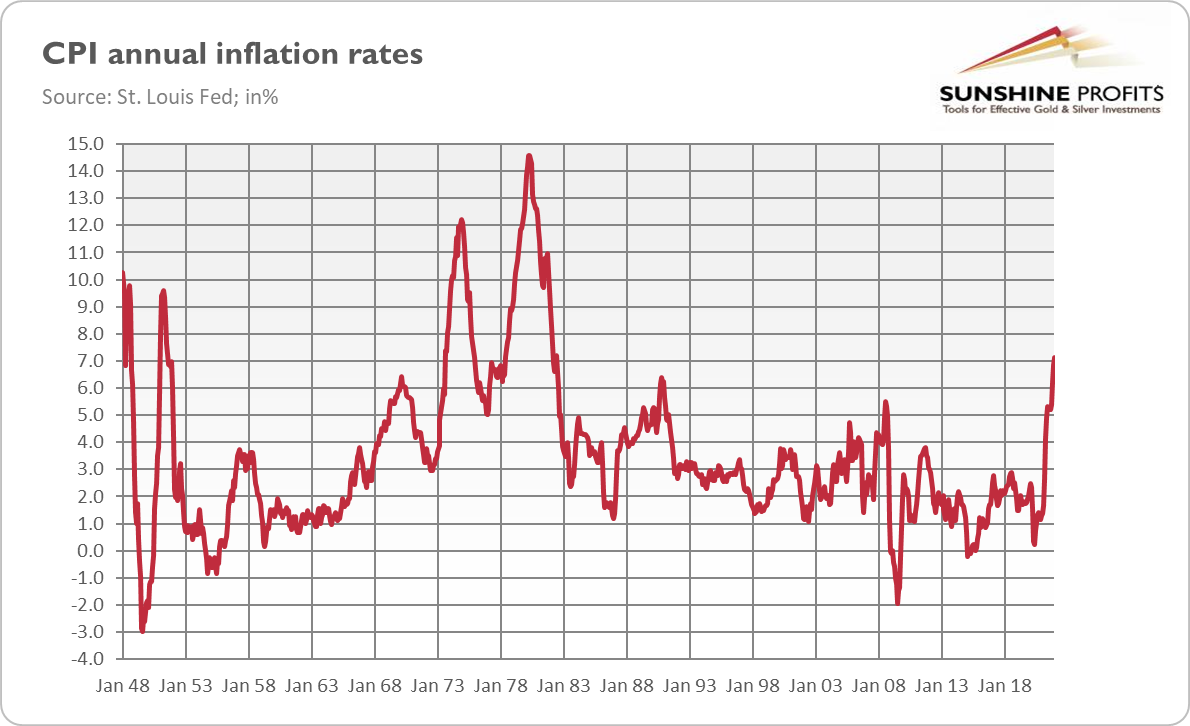
As one can see, each time the CPI annul rate peaked above 5%, it was either accompanied by or followed by a recession. The last such case was in 2008 during the global financial crisis, but the same happened in 1990, 1980, 1974, and 1970. It doesn’t bode well for the upcoming years.
Some analysts argue that we are not experiencing a normal business cycle right now. In this view, the recovery from a pandemic crisis is rather similar to the postwar demobilization, so high inflation doesn’t necessarily imply overheating of the economy and could subsidy without an immediate recession. Of course, supply shortages and pent-up demand contributed to the current inflationary episode, but we shouldn’t forget about the role of the money supply. Given its surge, the Fed has to tighten monetary policy to curb inflation. However, this is exactly what can trigger a recession, given the high indebtedness and Wall Street’s addiction to cheap liquidity.
What does it mean for the gold market? Well, the possibility that the Fed’s tightening cycle will lead to a recession is good news for the yellow metal, which shines the most during economic crises. Actually, recent gold’s resilience to rising bond yields may be explained by demand for gold as a hedge against the Fed’s mistake or failure to engineer a soft landing.
Another bullish implication is that the Fed will have to ease its stance at some point in time when the hikes in interest rates bring an economic slowdown or stock market turbulence. If history teaches us anything, it is that the Fed always chickens out and ends up less hawkish than it promised. In other words, the US central bank cares much more about Wall Street than it’s ready to admit and probably much more than it cares about inflation.
Having said that, the recession won’t start the next day after the rate liftoff. Economic indicators don’t signal an economic slump. The yield curve has been flattening, but it’s comfortably above negative territory. I know that the pandemic has condensed the last recession and economic rebound, but I don’t expect it anytime soon (at least rather not in 2022). It implies that gold will have to live this year without the support of the recession or strong expectations of it.
Thank you for reading today’s free analysis. If you enjoyed it, and would you like to know more about the links between the economic outlook, and the gold market, we invite you to read the March Gold Market Overview report. Please note that in addition to the above-mentioned free fundamental gold reports, and we provide premium daily Gold & Silver Trading Alerts with clear buy and sell signals. We provide these premium analyses also on a weekly basis in the form of Gold Investment Updates. In order to enjoy our gold analyses in their full scope, we invite you to subscribe today. If you’re not ready to subscribe yet though and are not on our gold mailing list yet, we urge you to sign up. It’s free and if you don’t like it, you can easily unsubscribe. Sign up today!
Arkadiusz Sieron, PhD
Sunshine Profits: Effective Investment through Diligence & Care.-----
Disclaimer: Please note that the aim of the above analysis is to discuss the likely long-term impact of the featured phenomenon on the price of gold and this analysis does not indicate (nor does it aim to do so) whether gold is likely to move higher or lower in the short- or medium term. In order to determine the latter, many additional factors need to be considered (i.e. sentiment, chart patterns, cycles, indicators, ratios, self-similar patterns and more) and we are taking them into account (and discussing the short- and medium-term outlook) in our Gold & Silver Trading Alerts.


Gold Market
Free Newsletter
with details not available
to 99% investors
+ 7 days of Gold Alerts
Gold Alerts
More-
Status
New 2024 Lows in Miners, New Highs in The USD Index
January 17, 2024, 12:19 PM -
Status
Soaring USD is SO Unsurprising – And SO Full of Implications
January 16, 2024, 8:40 AM -
Status
Rare Opportunity in Rare Earth Minerals?
January 15, 2024, 2:06 PM

