
tools spotlight

-
Is the USDX Building Strength to Push Gold Prices Down?
January 4, 2023, 7:51 AMThe USD Index is a key driver of gold prices (apart from real interest rates). How much strength has it shown recently?
In yesterday’s analysis, I compared the current situation in the precious metals to the one in stocks that we saw last year. It appears that the similarity remains up-to-date as gold is up in today’s pre-market trading (at the moment of writing these words).
As you may recall, last year, stocks didn’t decline until the second session of the year. Of course, the history doesn’t have repeat itself to the letter, but I wouldn’t make too much of the upswing in the first few days of the year. Here’s what we wrote about this matter yesterday:
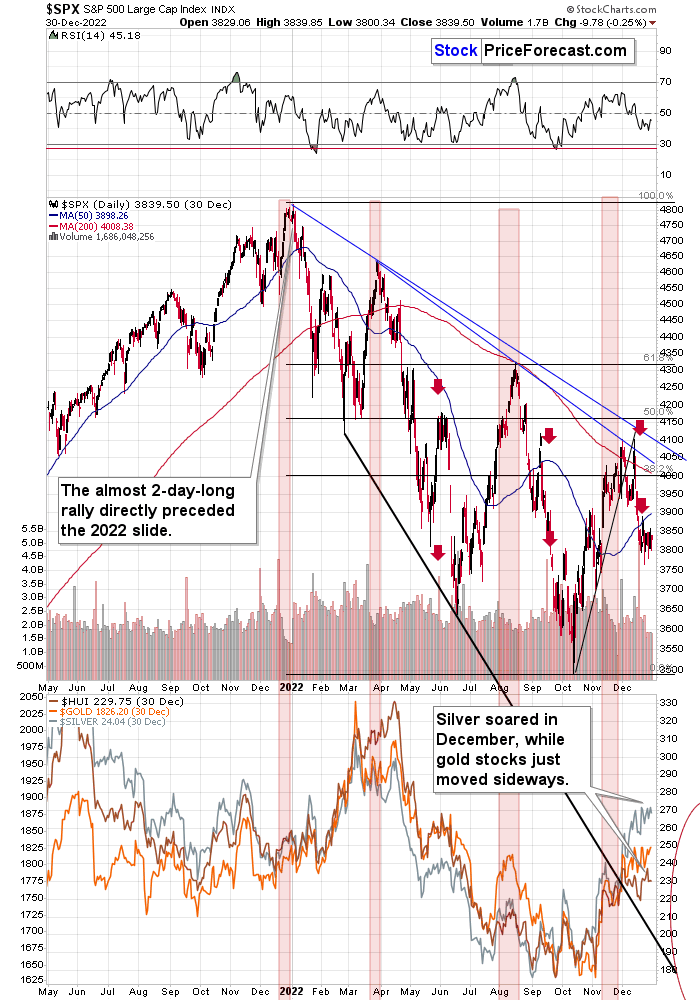
Do you remember the “January rally” that we saw in early 2022? It lasted less than two days. Stocks moved higher in the first session of the year, and they formed an intraday top during the second session of the year.

And then, the S&P 500 moved from about 4,800 to levels below 3,600.
So, looking at the early-January performance might be misleading.
The lower part of the above chart features gold, silver, and the HUI Index (proxy for gold stocks). As you can see, silver outperformed gold strongly in December, while gold stocks did almost nothing, greatly underperforming gold. That’s a very powerful bearish indication for the following weeks. After all, that’s exactly what tends to happen close to market tops – silver outperforms, while gold stocks lag.
Interestingly, stocks started this year with a bearish reversal.
Of course, these are not the reasons for the decline per se – I listed multiple thereof (e.g., rising real interest rates) in my previous analyses.
The other key driver of gold prices (besides real interest rates) is the USD Index, and it just showed strength.
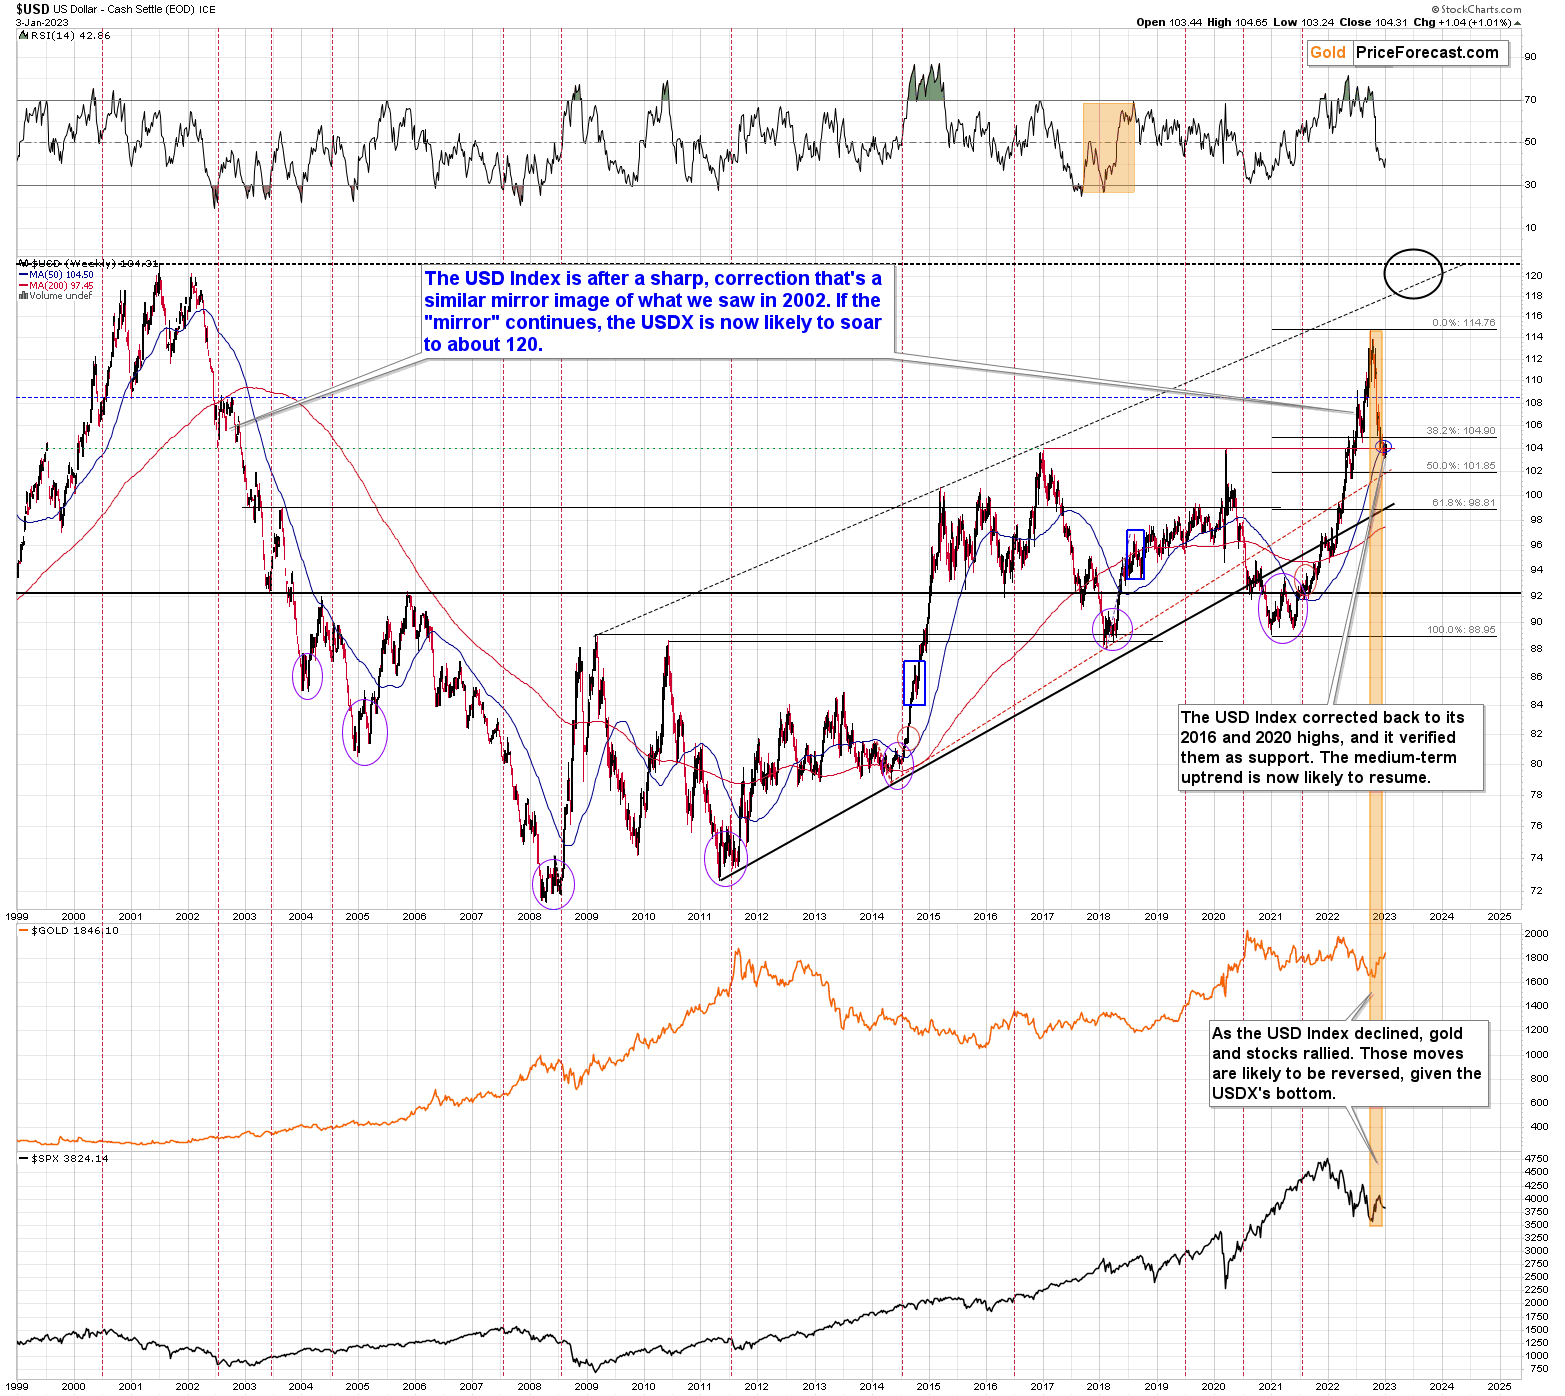
The USDX is down in today’s pre-market trading, but it moved substantially higher yesterday. High enough to make it clear that the very strong support provided by the 2016 and 2020 highs held.
This, in turn, means that another medium-term rally in the USDX is likely to begin any day now – and perhaps it’s already underway.
From the short-term point of view, we only saw a daily rally so far, and this rally is being corrected right now, which means that the USDX is still in preparation mode.
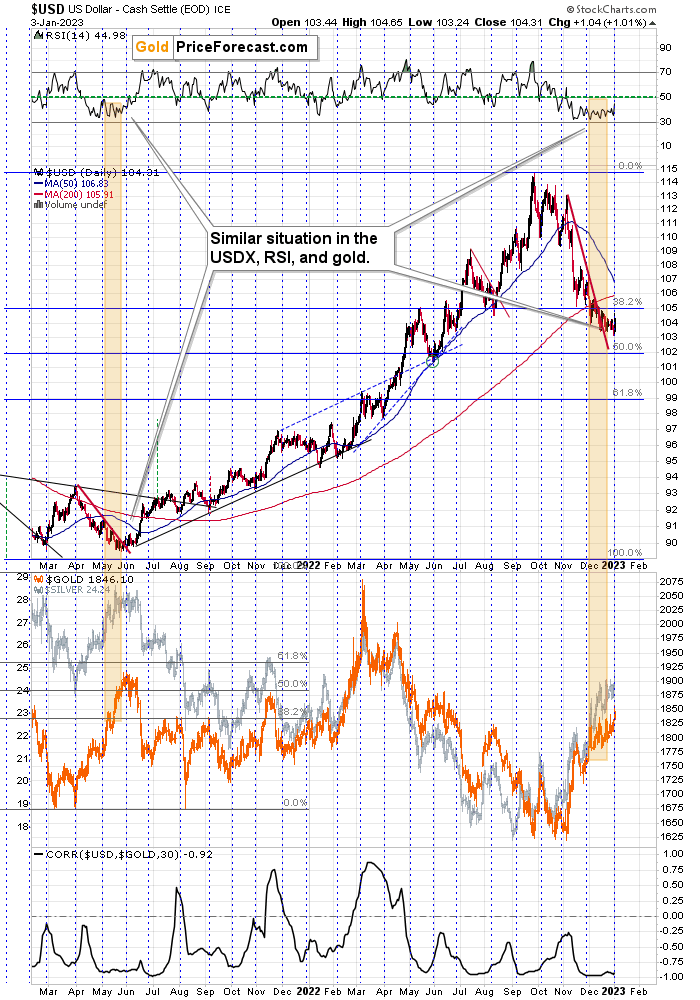
Still, the above short-term chart continues to provide us with bullish implications because of the great similarity between the recent action in the USDX itself and the RSI based on it (not to mention the correlation with gold that you can see on the bottom of the above chart) and what happened in mid-2021.
The lengthy bottom was followed by a small breakout at first, and then by a bigger rally. Both gold and silver fell substantially at that time, and it was the start of an even bigger decline in junior mining stocks.
What we saw yesterday was perhaps analogous to that small breakout that started it all previously.
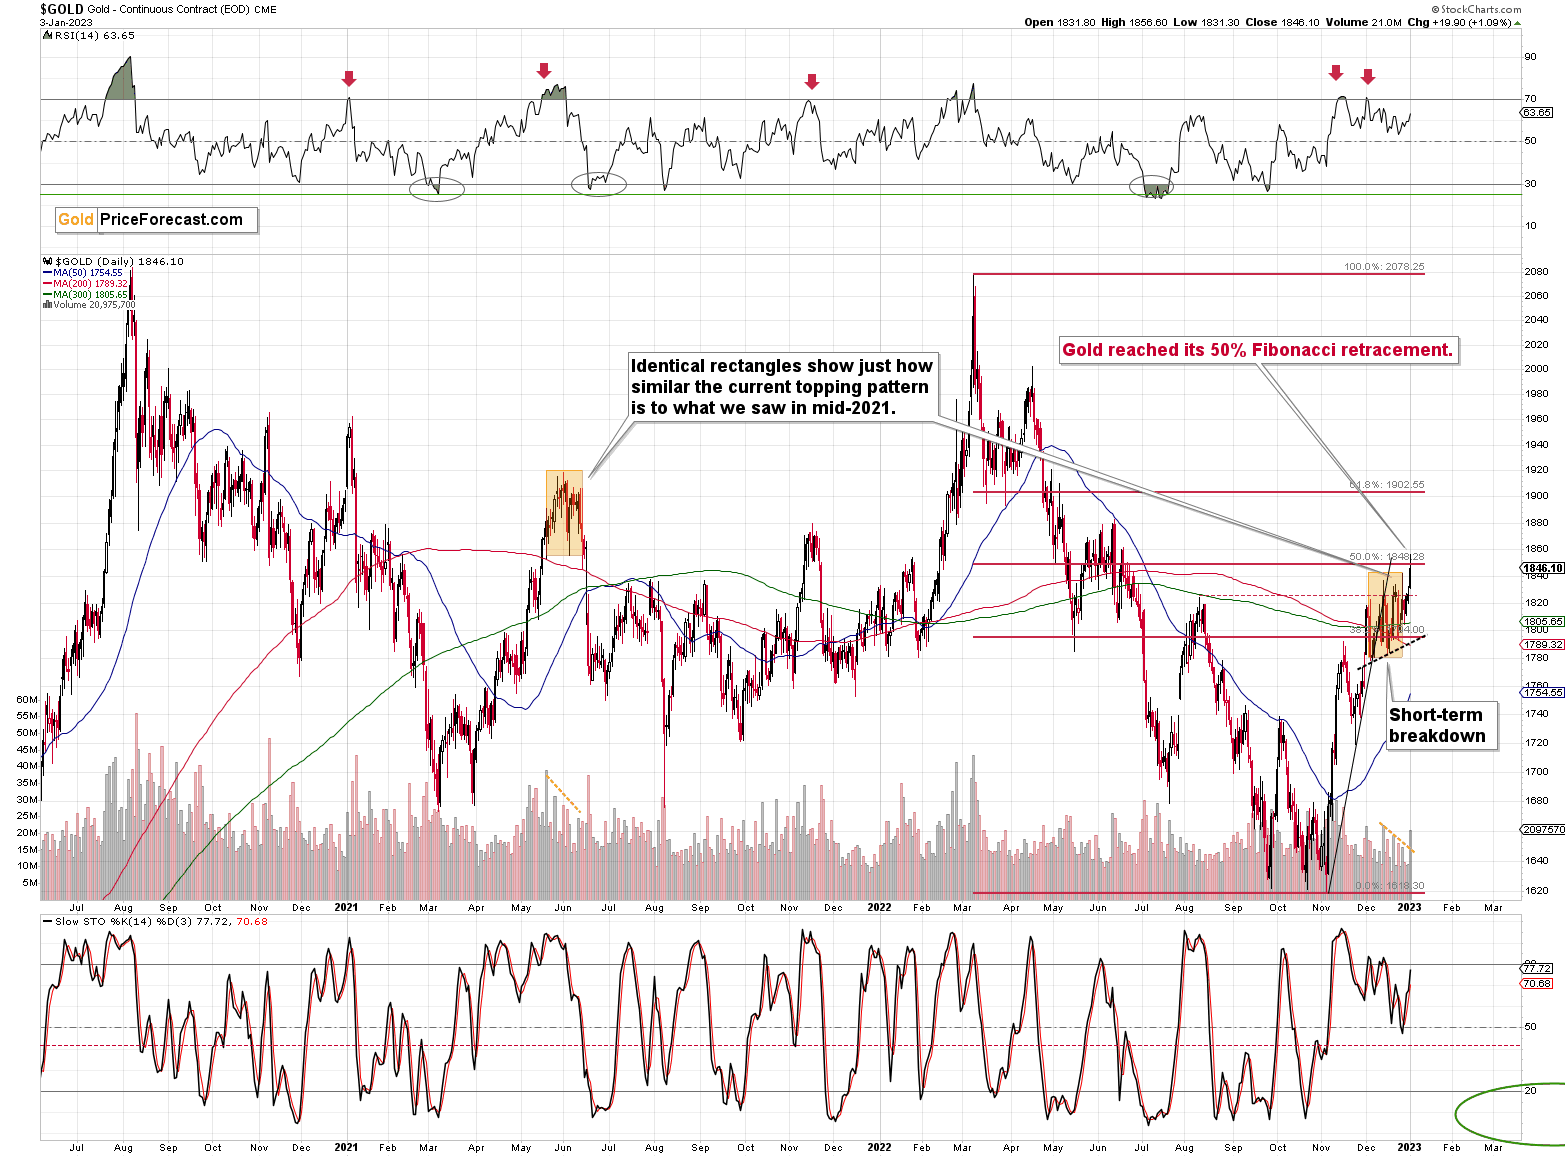
The gold price itself moved to its 50% Fibonacci retracement level, and then moved back down. It reversed on an intraday basis on relatively big volume. It didn’t erase most of the rally, so the bearish indications from the reversal candlestick are not strong. However, the fact that gold moved to one of its key retracements is notable.
In today’s pre-market trading, gold futures moved a bit above that level, but the breakout is not yet confirmed.
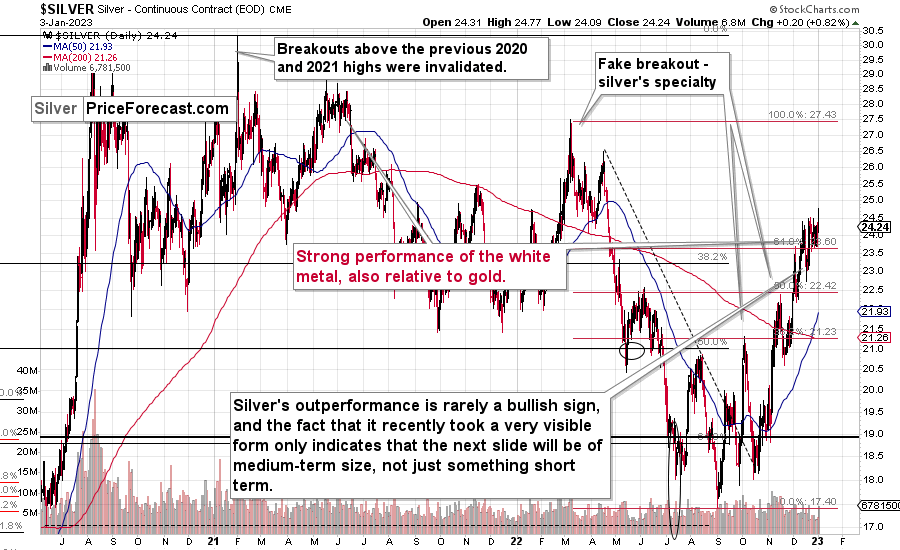
Silver reversed in a much more profound and clear manner. In silver’s case, the reversal was clear, and it was confirmed by relatively big volume. This is a bearish indication for the short term.
In today’s pre-market trading silver moved a bit higher, but it didn’t manage to move above yesterday’s intraday highs.

Junior miners moved very close to their previous highs, but then reversed and ended the day visibly below them.
Consequently, nothing really changed, and the overall shape of yesterday’s session was bearish – as it’s the case with daily reversals.
All in all, the short-term outlook for the precious metals didn’t really improve and it remains bearish for the following weeks.
Thank you for reading our free analysis today. Please note that the above is just a small fraction of the full analyses that our subscribers enjoy on a regular basis. They include multiple premium details such as the interim targets for gold and mining stocks that could be reached in the next few weeks. We invite you to subscribe now and read today’s issue right away.
Sincerely,
Przemyslaw Radomski, CFA
Founder, Editor-in-chief -
Happy New Year: Is This a Gold Rally or a USDX Rally?
January 3, 2023, 8:05 AMGold welcomed the first day of 2023 with a rally, but is it just a side show, with the USDX being the one to watch for strength?
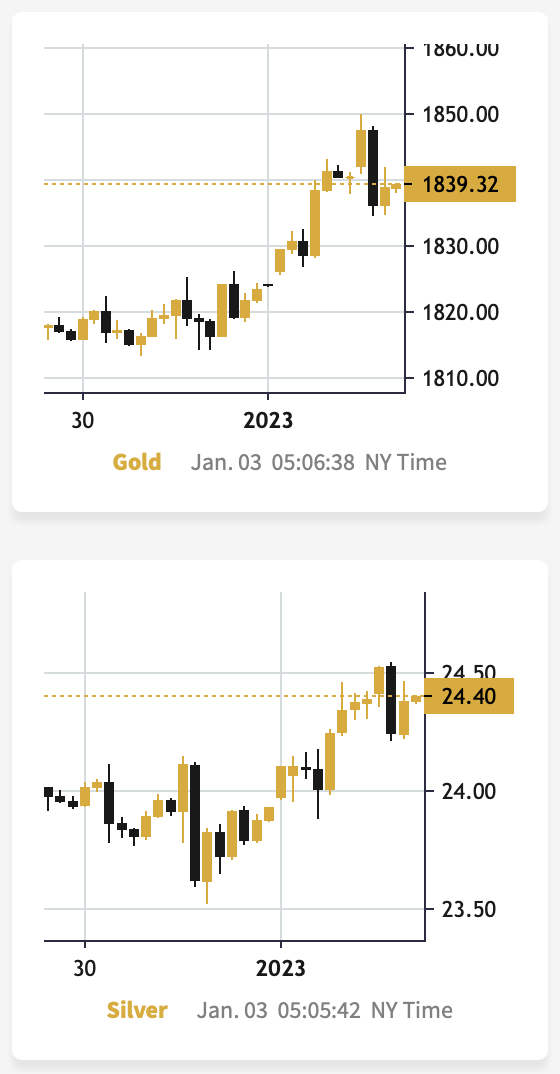
This gold rally is not that odd given that gold was declining most of the year, and some buyers probably wanted to harvest the tax savings by cashing in losses and they are buying back today (chart courtesy of https://GoldPriceForecast.com).
It doesn’t mean that the rally is here to stay. No, quite the opposite is likely.
Do you remember the “January rally” that we saw in early 2022? It lasted less than two days. Stocks moved higher on the first session of the year, and they formed an intraday top during the second session of the year.
And then, the S&P 500 moved from about 4,800 to levels below 3,600.
So, looking at the early-January performance might be misleading.
The lower part of the above chart features gold, silver, and the HUI Index (proxy for gold stocks). As you can see, silver outperformed gold strongly in December, while gold stocks did almost nothing, greatly underperforming gold. That’s a very powerful bearish indication for the following weeks. After all, that’s exactly what tends to happen close to market tops – silver outperforms, while gold stocks lag.
Speaking of mining stocks, did anything change in the case of junior mining stocks so far today?
No.
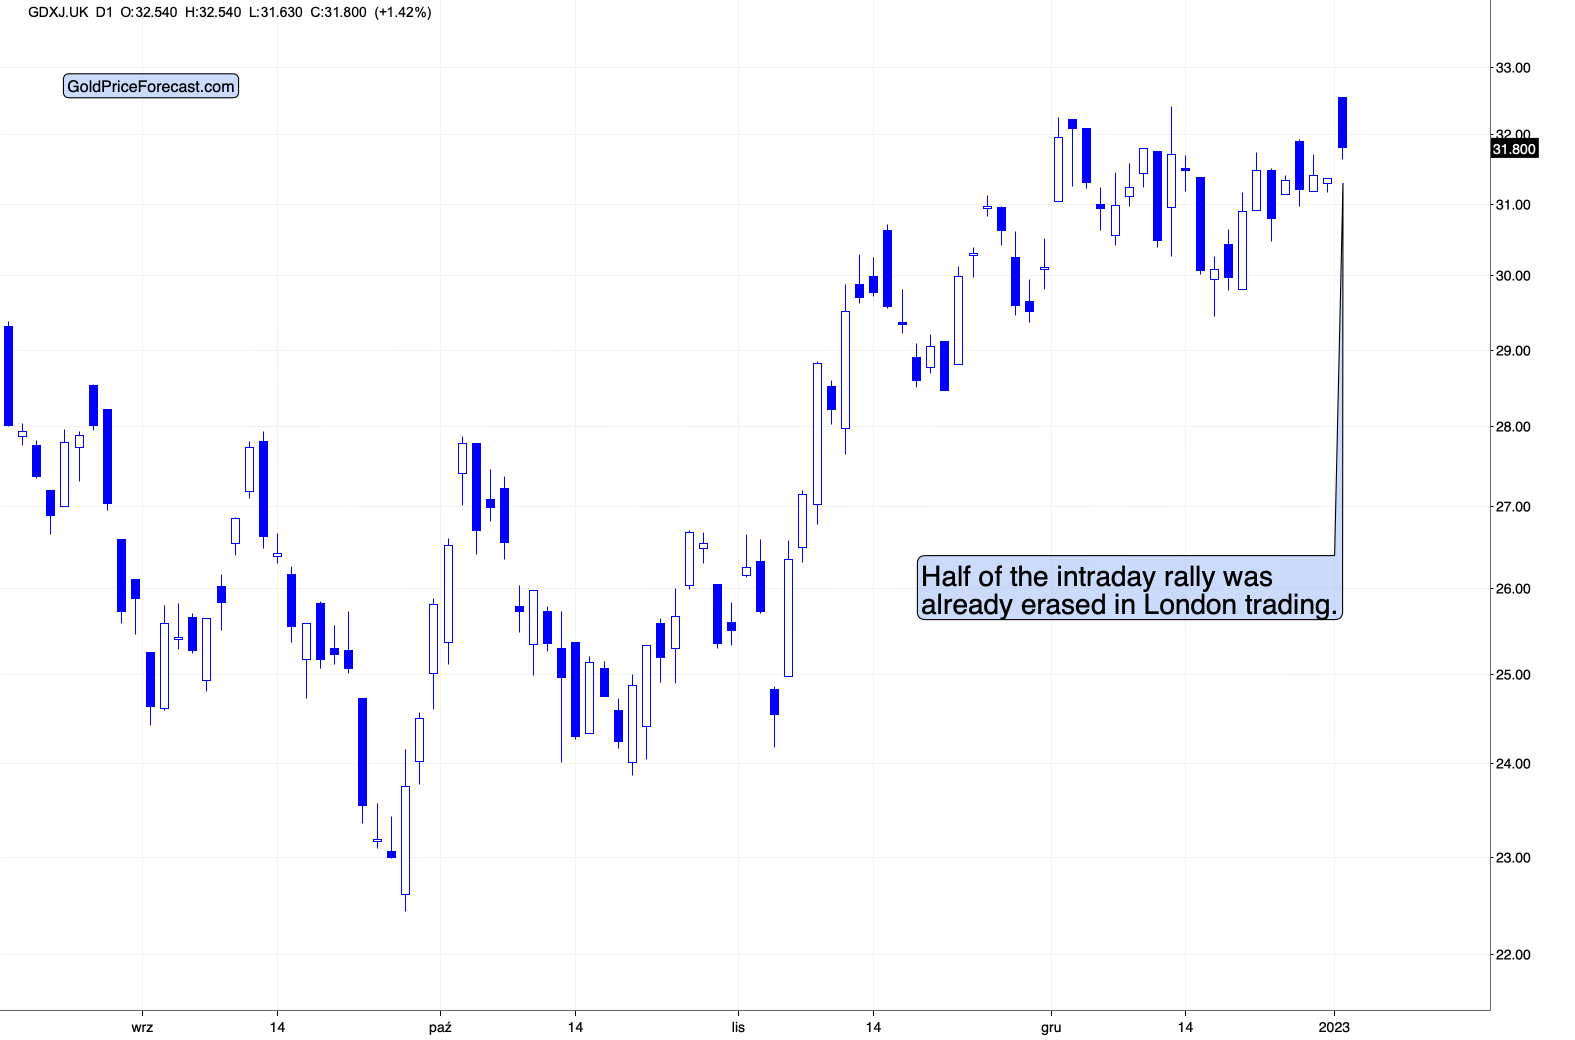
In today’s London trading (the U.S. markets are still closed while I’m writing this), the GDXJ opened relatively high, but it quickly erased about half of the upswing.
Is the 2023 top in junior mining stocks already in? It could be the case, especially if we focus on the first half of 2023. We might see a powerful rally in juniors in the second half of the year, but seeing a huge decline in the first half of the year is even more likely.
Of course, these are not the reasons for the decline per se – I listed multiple thereof (e.g., rising real interest rates) in my previous analyses.
The other key driver of gold prices (besides real interest rates) is the USD Index, and it just showed substantial strength today.
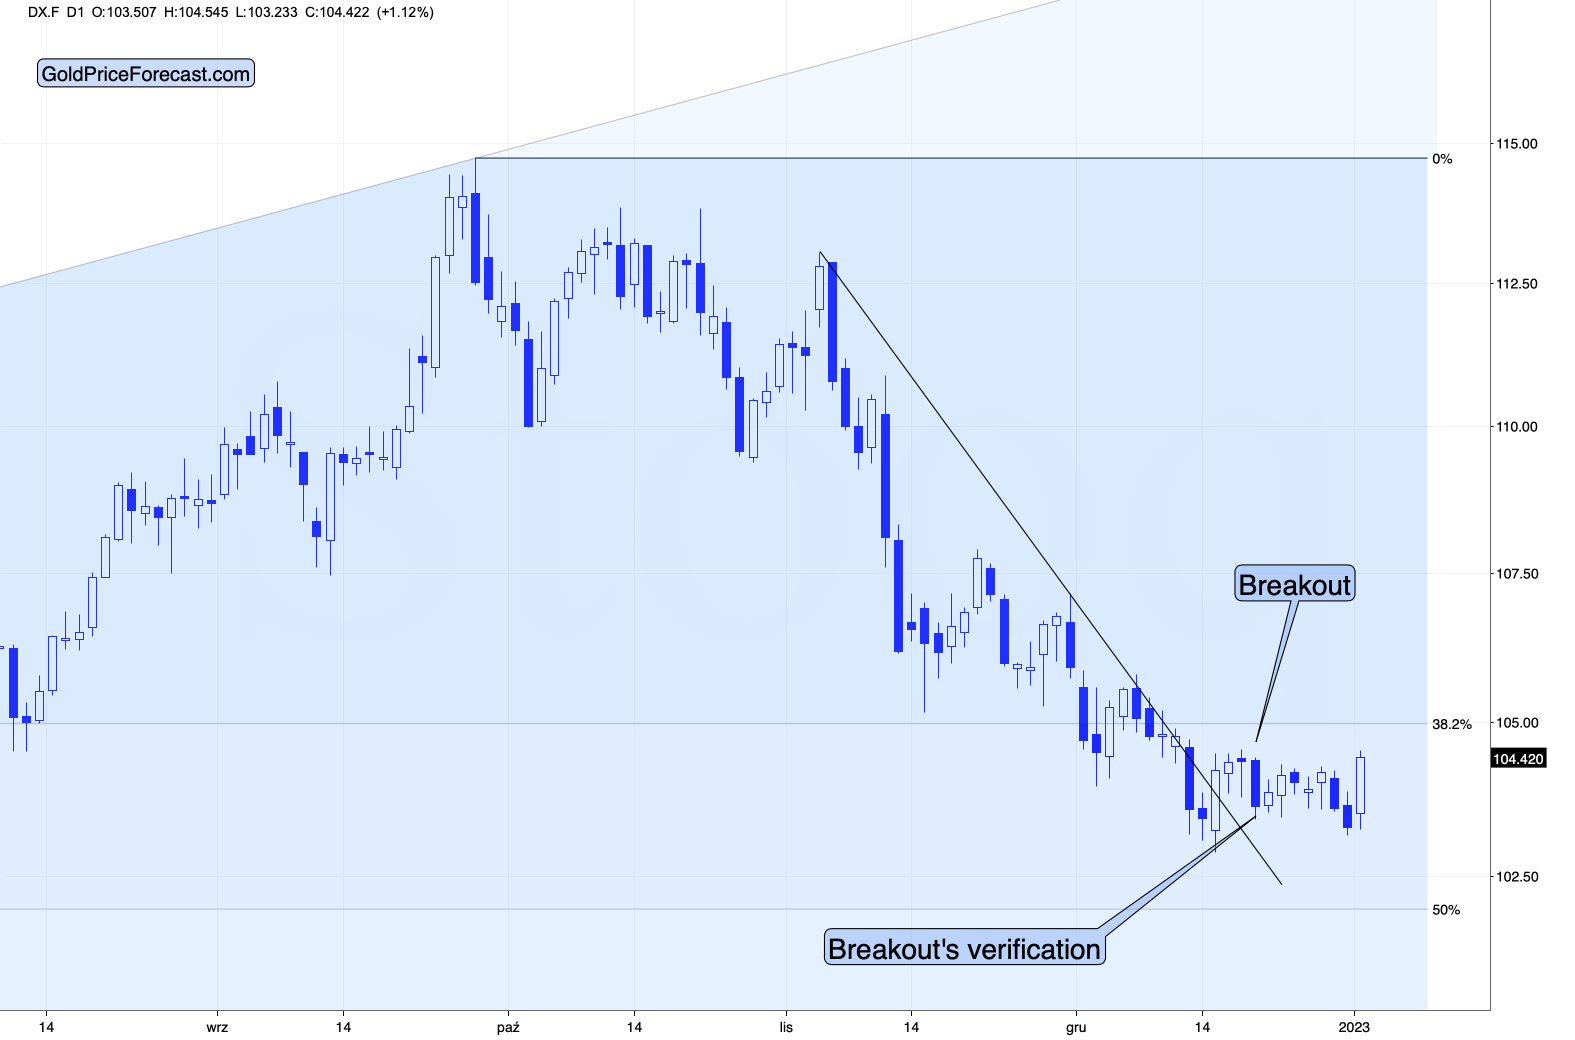
This comes after a breakout and a rather lengthy confirmation thereof. Therefore, this could be the start of another powerful rally.
Why doesn’t the “tax loss buyback” mechanism apply to the USD Index (as it does to gold or stocks)?
Because the USD Index is ultimately an index not an asset per se, and the index consists of individual currency exchange rates, most important of them being EUR/USD and JPY/USD. So, it’s the relative valuation of two currencies, not a single asset. If the above-mentioned mechanism applied to the U.S. dollar, it might as well apply to the euro, and to the Japanese yen. And in this case, the effects would cancel each other out in the case of the exchange rates.
Consequently, the rally in the USD Index might be the thing that is really happening today, while action in gold and the stock market might be just something temporary and of little meaning.
Thank you for reading our free analysis today. Please note that the above is just a small fraction of the full analyses that our subscribers enjoy on a regular basis. They include multiple premium details such as the interim targets for gold and mining stocks that could be reached in the next few weeks. We invite you to subscribe now and read today’s issue right away.
Sincerely,
Przemyslaw Radomski, CFA
Founder, Editor-in-chief -
The Gold Market: Is It Weird to Have Two Corrective Upswings Instead of One?
December 30, 2022, 11:06 AMHere's how history rhymes in the precious metals market and what we can glean from recent movements in gold, silver, and mining stocks.
History tends to repeat itself. Not to the letter, but in general. The reason is that while economic circumstances change and technology advances, the decisions to buy and sell are still mostly based on two key emotions: fear and greed. They don’t change, and once similar things happen, people’s emotions emerge in similar ways, thus making specific historical events repeat themselves to a certain extent.
For example, right now, gold stocks are declining similarly to how they did in 2008 and in 2012-2013.
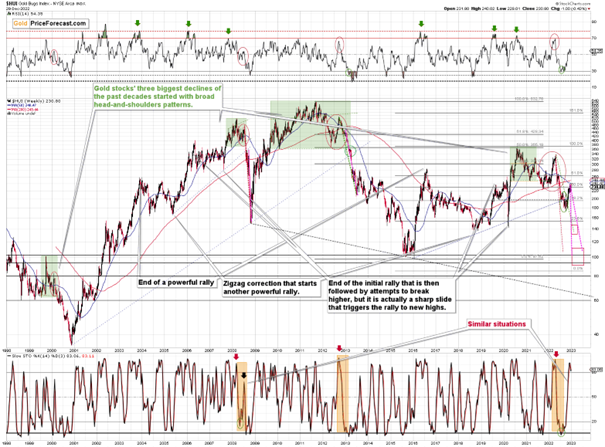
This is an extreme underperformance of gold stocks, similar to what we saw in 2013 before the worst of the slide. This is an extreme underperformance of gold stocks – something that we’ve also seen in 2013 before the biggest part of the slide.
For many months, I’ve been writing that the situation in the HUI Index is analogous to what we saw in 2008 and in 2013. Those declines were somewhat similar, yet different, and what we see now is indeed somewhere between of those declines – in terms of the shape of the decline.
At first, the HUI Index declined just like it did in 2013, and the early 2022 rally appears to be similar to the late-2012 rally. However, the correction that we saw recently is also similar to the late-2012 rally.
Is it really that strange that we now have two corrective upswings instead of one, given that history does not repeat itself to the letter but rather rhymes? Not necessarily.
This is especially the case given that the 2008 decline had one sizable correction during the big decline. It’s not clearly visible on the above chart due to the pace of the 2008 slide, but it’s definitely there. You can see it more clearly in one of the below charts.
So, no, the recent rally is not an invalidation of the analogies to the previous patterns, it continues to rhyme with them in its own way. And the extremely bearish implications for the following months remain intact.
How low can the HUI Index fall during the next big downswing?
As is the case with gold and silver, a move back to the 2020 lows is definitely in the cards. Please note that this level is also strengthened (as support) by other major lows: the 2019, 2014, and 2008 ones.
However, I wouldn’t rule out a move even lower on a temporary basis. If gold were to decline to about $1,450-1,500, it would mean that it would double its current 2022 decline. If the HUI Index does that, it will move below 150.
So, all in all, 100-150 is my current target area for the upcoming slide in the HUI Index.
All right, let’s zoom in and see how mining stocks declined in 2008.
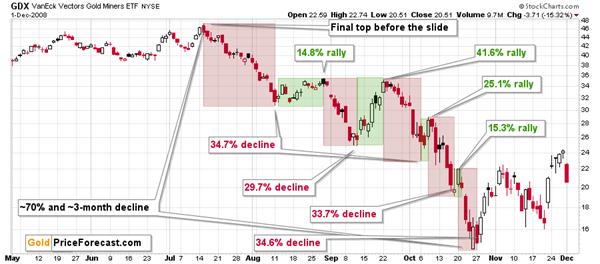
Back then, the GDXJ ETF was not yet trading, so I’m using the GDX ETF as a short-term proxy here.
The decline took about 3 months, and it erased about 70% of the miners’ value. The biggest part of the decline happened in the final month, though.
However, the really interesting thing about that decline – that might also be very useful this time – is that there were five very short-term declines that took the GDX about 30% lower.
I marked those declines with red rectangles. After that, a corrective upswing started. During those corrective upswings, the GDX rallied by 14.8-41.6%.
Do you know now how much the GDX ETF has rallied from its September 2022 bottom? It moved up by 41.7%. This means that the move higher now is practically identical with the corrective (!) upswing that we saw in September 2008. The analogy was not broken – it remains intact, and it points to much lower prices in the future.
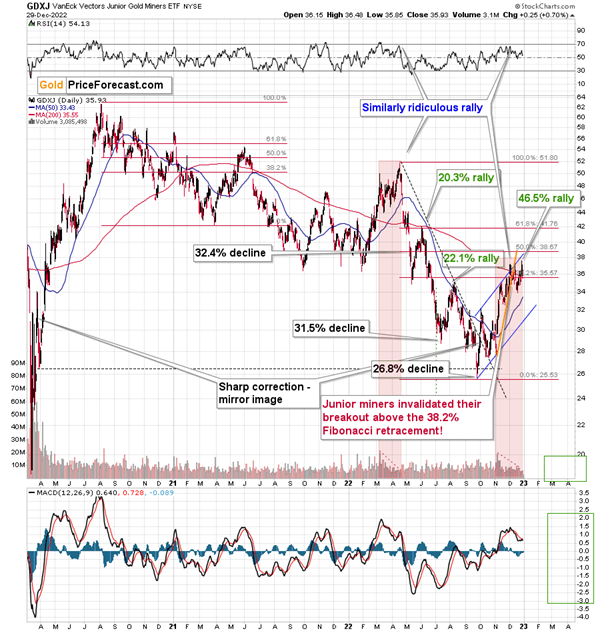
Just like gold, the GDXJ invalidated the breakout above its 38.2% Fibonacci retracement a few times, and now it also broke below the rising, short-term support line (marked with orange).
This is a powerful, bearish combination of factors, especially that miners were the first to decline – gold followed, while silver was still showing strength.
Yes, miners are now once again slightly above the 38.2% Fibonacci retracement, but since the previous attempt was invalidated shortly and miners are now practically ignoring gold’s rallies, it’s extremely likely that this small breakout will be invalidated as well.
Please keep in mind that the above comes on top of the analogy that I marked with red rectangles, and my previous description thereof remains up-to-date:
The current upswing continues to be similar to what we saw in March and April earlier this year. On the above chart I named both rallies “ridiculous” – I did so as what we see now is contrary to what’s happening in the real interest rates, and it appears that it’s the general public that’s pushing the prices higher now.
Technically, one could say that the GDXJ formed an inverse head and shoulders pattern (the early September bottom being the left shoulder and the mid-October bottom being the right shoulder), which was just completed.
Just as the March – April rally ran its course on declining volume, we saw the same thing recently. Even the RSI was slightly below 70 at the April top, just like it was recently.
Speaking of analogies, earlier today (and yesterday), I discussed the analogy to mid-2021. The GDXJ’s performance also supports this link. Back then, junior miners had corrected a bit more than half of the preceding decline before sliding again, and this time, they corrected a bit less than half of the preceding decline.
Interestingly, after the mid-2021 correction, the pace of the decline picked up, and miners declined almost twice as fast. And yes, this could happen in the following months as well.
And yes, this means that another decline could take the GDXJ all the way down to its 2020 low, or very close to it.
On the below chart, I marked just how perfectly the recent price moves played out according to the Elliott Wave Theory.
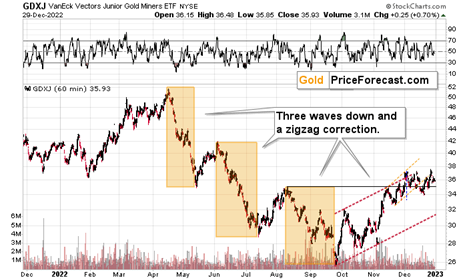
Of course, EWT is not the only tool that one could use, and I find other technical tools more useful, but still, this kind of pattern-following is uncanny.
The classic EWT pattern is three waves down (I marked those with orange rectangles) and then a correction consisting of two smaller waves.
That’s exactly what we have seen in recent months. The September–now pattern appears to be the above-mentioned correction. It didn’t only consist of two smaller waves higher – they were actually almost identical in terms of size and sharpness. This created a classic ABC correction (flag) pattern.
Three weeks ago, I wrote that the Dec. 1 small breakout above the upper red line didn’t have meaningful bullish implications as it hadn’t been confirmed. And indeed, it was invalidated.
Now, since this pattern is complete, another huge 3-stage move lower can – and is likely – to unfold. This is very bearish for junior mining stocks (as well as for gold, silver, and probably other commodities and stocks), and the fact that juniors are already showing weakness relative to gold (the latter was almost flat yesterday, while miners declined) serves as a bearish confirmation. As always, I can’t guarantee anything, but in my view, the profits that can be reaped on this upcoming slide can be enormous.
Thank you for reading our free analysis today. Please note that the above is just a small fraction of the full analyses that our subscribers enjoy on a regular basis. They include multiple premium details such as the interim targets for gold and mining stocks that could be reached in the next few weeks. We invite you to subscribe now and read today’s issue right away.Sincerely,
Przemyslaw Radomski, CFA
Founder, Editor-in-chief -
What Signals Do Gold, Silver, and Stocks Send to Investors?
December 29, 2022, 9:17 AMWhile the statistics scream, investors, often blinded by emotions, do not hear them. However, since history seems to rhyme, what do gold, silver, and mining stocks have in store for us?
What a boring month!
At least for those who monitor the performance of junior mining stocks. It’s Dec. 29, and the monthly price change for the GDXJ ETF is $0.15 (0.41%). That’s how much higher the GDXJ is now than it was at the end of November. That’s next to nothing – almost a “statistical error.”
So far today, gold and silver are not doing much (chart courtesy of https://SilverPriceForecast.com), but gold futures rose by $55.90 (3.18%) and silver prices rose by $2.06 (9.45%) in December.
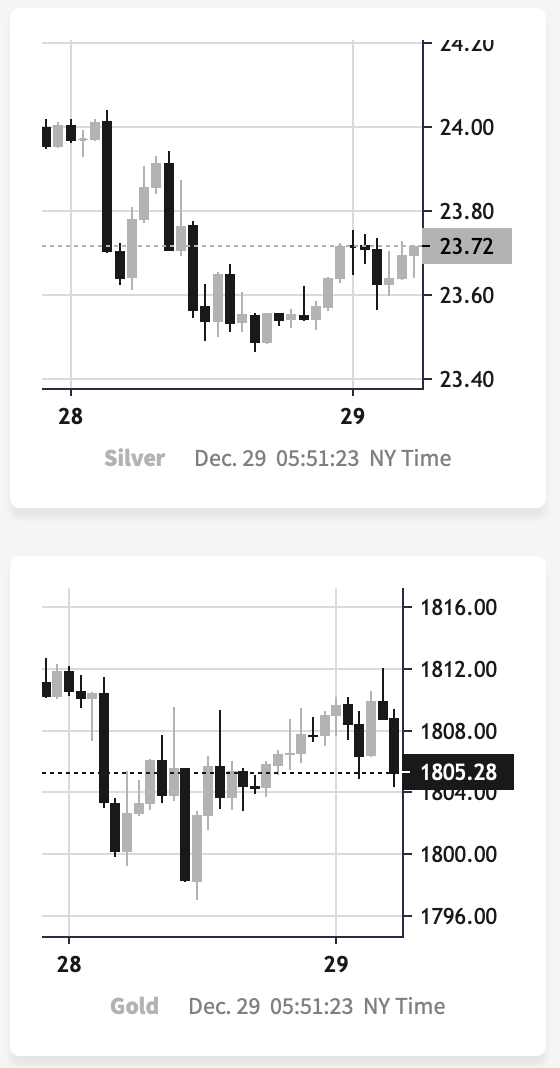
I know that I’ve been writing about this over and over again, but please note how extreme this signal is! It’s crystal-clear even on a monthly basis. The signal, of course, comes from markets’ relative performance.
Miners tend to underperform the gold price close to market tops, and silver tends to outperform close to market tops. The above monthly numbers are practically screaming: “it’s a top!.” As always, very few are listening, as it’s easy to get carried away by the primary emotion that’s out there in the market, and when prices are rallying, people become bullish. They tend to ignore the signs and focus on the feelings.
Even the wording in the messages that we receive changes. The phrases “I feel the market is about to move higher” or “it seems to me that this rally won’t end” are common, but messages with indications and evidence supporting that bullish case are very rare or (usually) absent.
Please note that while I’ve been analyzing the precious metals sector’s outlook recently, my trading focus has been on the junior mining stocks – and indeed, miners have barely moved higher this month, even despite a sizable move lower in the USD Index.
But you said that miners are driven by stocks, and the S&P 500 is down by over 7% this month. Aren’t miners weak just because of the stocks? As a result, there is no underperformance of gold—no bearish indication? No.
While it’s true that stocks’ performance tends to impact juniors’ prices, it’s also true – to a considerable extent – in the case of the silver market.
Silver’s price hasn’t been weak this month. Quite the opposite – silver soared by almost 10%.
If silver soared so much, then apparently the impact the stock market had on the precious metals sector was not as significant. Consequently, it’s very likely that the indications coming from the relative performance of miners and silver are truly bearish for the precious metals sector.
What most people might have missed recently is that what we’ve seen in the past couple of weeks is very similar to what we already saw in mid-2021.
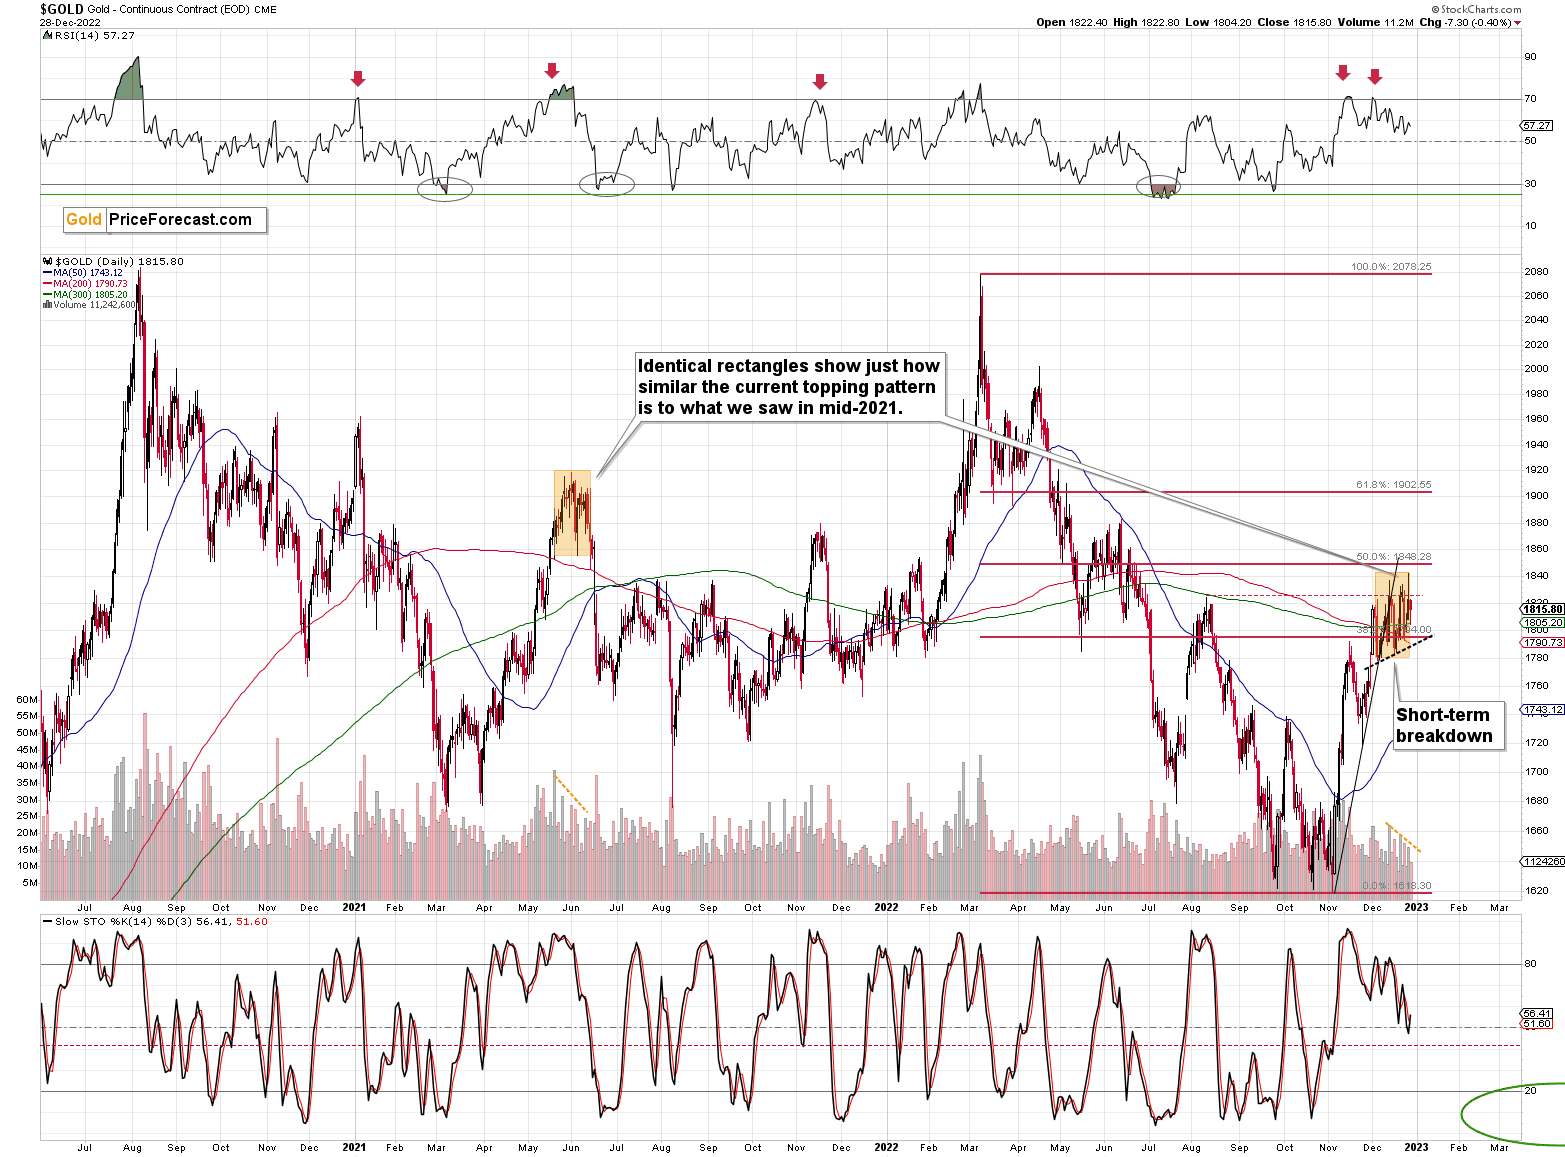
I copied the mid-2021 topping pattern to the current situation. I marked the period from the first intraday high to the start of the decline, and I marked it from the intraday high to the intraday low of the pattern.
Those are surprisingly identical, don’t you think?
Interestingly, both patterns were preceded by similarly sharp rallies, which were preceded by a broad bottom, which in turn were preceded by a decline of about $2,000.
History appears to be rhyming once again, and the implications are bearish – also in the short run.
Also, did I mention that the volume was declining during both patterns? I marked that in the bottom part of the above chart.
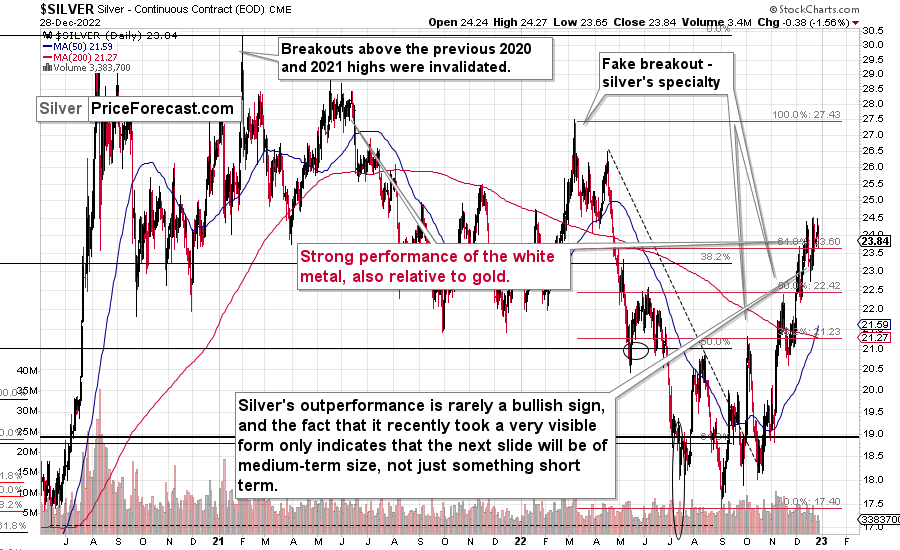
Silver’s strong performance is notable at this time, but please note that we saw the same thing during the mid-2021 top.
And junior miners?
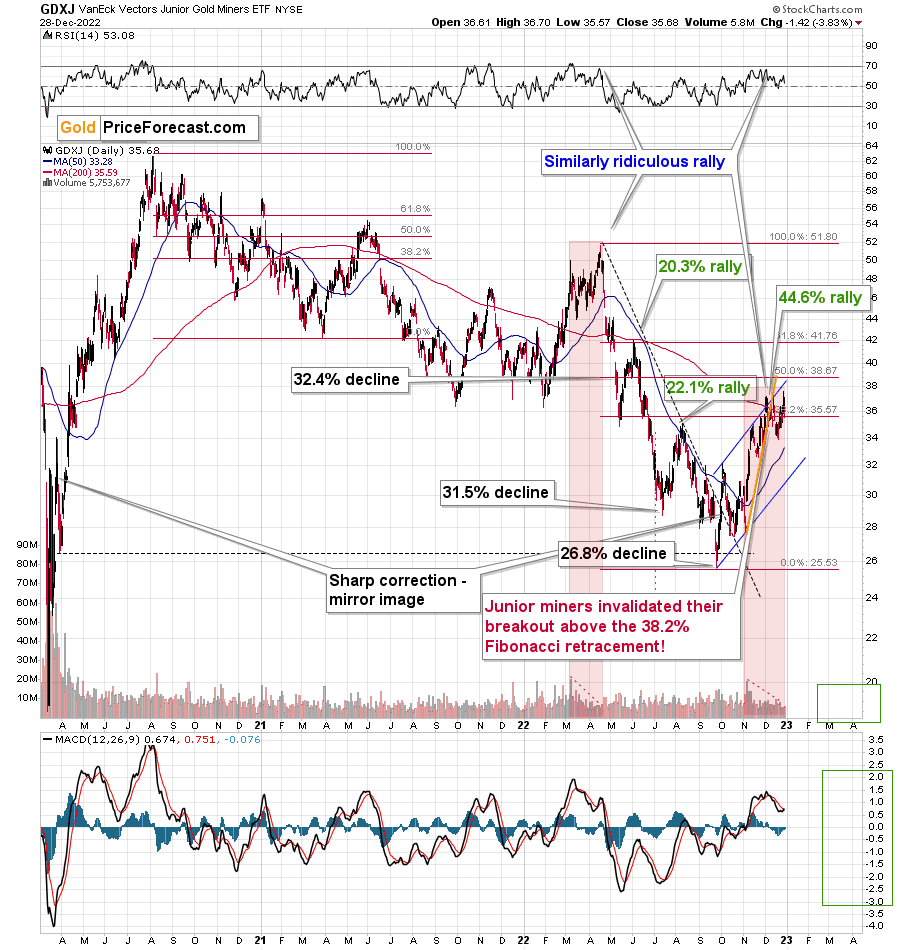
Back in mid-2021, they corrected a bit more than half of their previous decline, and right now they have corrected a bit less than half of their previous decline. The correction is nonetheless similar.
Interestingly, after the correction was over, the pace of the decline picked up, and junior miners moved to new lows, even though gold and silver moved approximately to their previous lows.
The pace of decline that followed the mid-2021 top was almost twice as big as the one of the preceding (2020 – early-2021) decline. As history rhymes, we’re likely to see something similar in the following months (and probably weeks) as well.
If that wasn’t enough, the link between mid-2021 and today is very clear in the case of the USD Index as well. Since the USDX is one of the key drivers for the price of gold, it’s worth paying attention to it.

The RSI is after a lengthy consolidation right above the 30 level, and the USD Index is after a short-term breakout, which has been more than confirmed.
From a long-term point of view, the breakout above the 2016 and 2020 highs in the USDX has been fully verified.
All this means that the USD Index is likely to move higher, which, in turn, is likely to trigger declines in the precious metals sector. The relative performance of gold, silver, and mining stocks indicates that the precious metals sector just can’t wait for a good reason to start its next huge move lower. It looks like they’re about to get it.
Thank you for reading our free analysis today. Please note that the above is just a small fraction of the full analyses that our subscribers enjoy on a regular basis. They include multiple premium details such as the interim targets for gold and mining stocks that could be reached in the next few weeks. We invite you to subscribe now and read today’s issue right away.
Sincerely,
Przemyslaw Radomski, CFA
Founder, Editor-in-chief


Gold Investment News
Delivered To Your Inbox
Free Of Charge
Bonus: A week of free access to Gold & Silver StockPickers.
Gold Alerts
More-
Status
New 2024 Lows in Miners, New Highs in The USD Index
January 17, 2024, 12:19 PM -
Status
Soaring USD is SO Unsurprising – And SO Full of Implications
January 16, 2024, 8:40 AM -
Status
Rare Opportunity in Rare Earth Minerals?
January 15, 2024, 2:06 PM

