
tools spotlight

-
Gold Miners – Biggest Losers? That’s What Oil Says
March 3, 2022, 9:18 AMAfter the war-driven gold rally, oil is starting to outperform. History between these two has already shown that someone may suffer. Many suggest: gold miners.
The precious metals corrected some of their gains yesterday, but overall, not much changed in them. However, quite a lot happened in crude oil, and in today’s analysis we’ll focus on what it implies for the precious metals market and, in particular – for mining stocks.
As you may have noticed, crude oil shot up recently in a spectacular manner. This seems normal, as it’s a market with rather inflexible supply and demand, so disruptions in supply or threats thereof can impact the price in a substantial way. With Russia as one of the biggest crude oil producers, its invasion of Ukraine, and a number of sanctions imposed on the attacking country (some of them involving oil directly), it’s natural that crude oil reacts in a certain manner. The concern-based rally in gold is also understandable.
However, the relationship between wars, concerns, and prices of assets is not as straightforward as “there’s a war, so gold and crude oil will go up.” In order to learn more about this relationship, let’s examine the most similar situation in recent history to the current one, when oil supplies were at stake.
The war that I’m mentioning is the one between Iraq and the U.S. that started almost 20 years ago. Let’s see what happened in gold, oil, and gold stocks at that time.
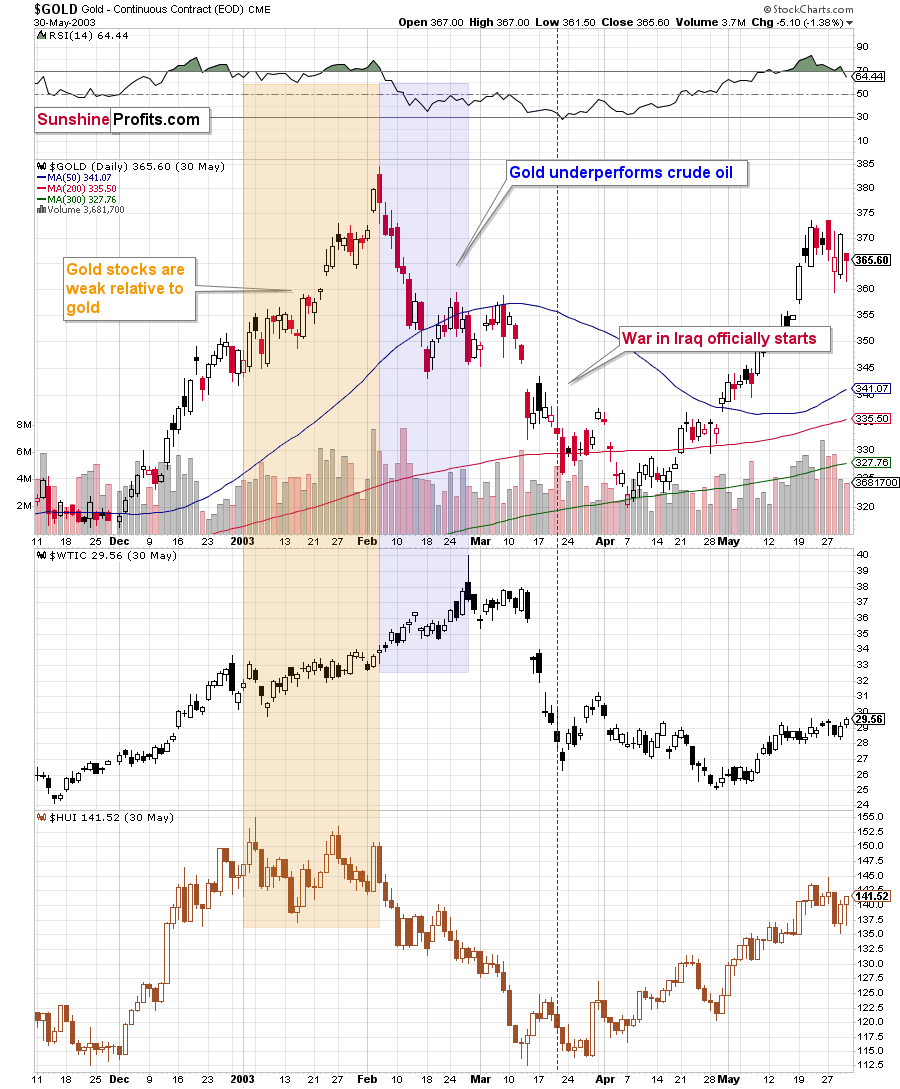
The most interesting thing is that when the war officially started, the above-mentioned markets were already after a decline. However, that’s not that odd, when one considers the fact that back then, the tensions were building for a long time, and it was relatively clear in advance that the U.S. attack was going to happen. This time, Russia claimed that it wouldn’t attack until the very last minute before the invasion.
The point here, however, is that the markets rallied while the uncertainty and concerns were building up, and then declined when the situation was known and “stable.” I don’t mean that “war” was seen as stable, but rather that the outcome and how it affected the markets was rather obvious.
The other point is the specific way in which all three markets reacted to the war and the timing thereof.
Gold stocks rallied initially, but then were not that eager to follow gold higher, but that’s something that’s universal in the final stages of most rallies in the precious metals market. What’s most interesting here is that there was a time when crude oil rallied substantially, while gold was already declining.
Let me emphasize that once again: gold topped first, and then it underperformed while crude oil continued to soar substantially.
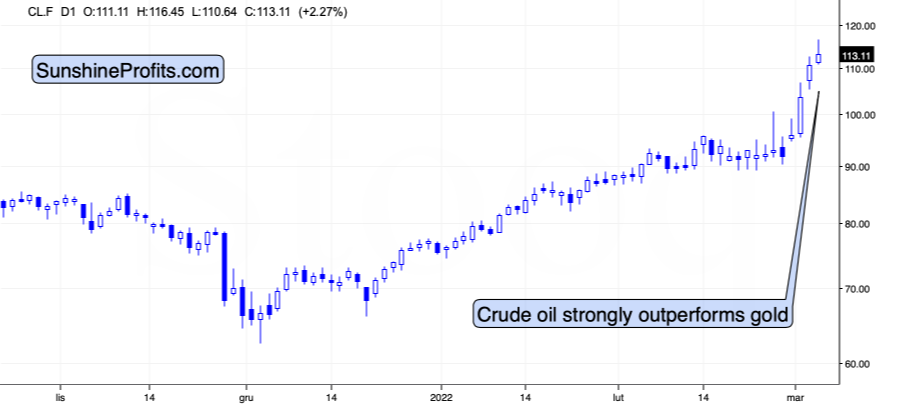
Fast forward to the current situation. What has happened recently?
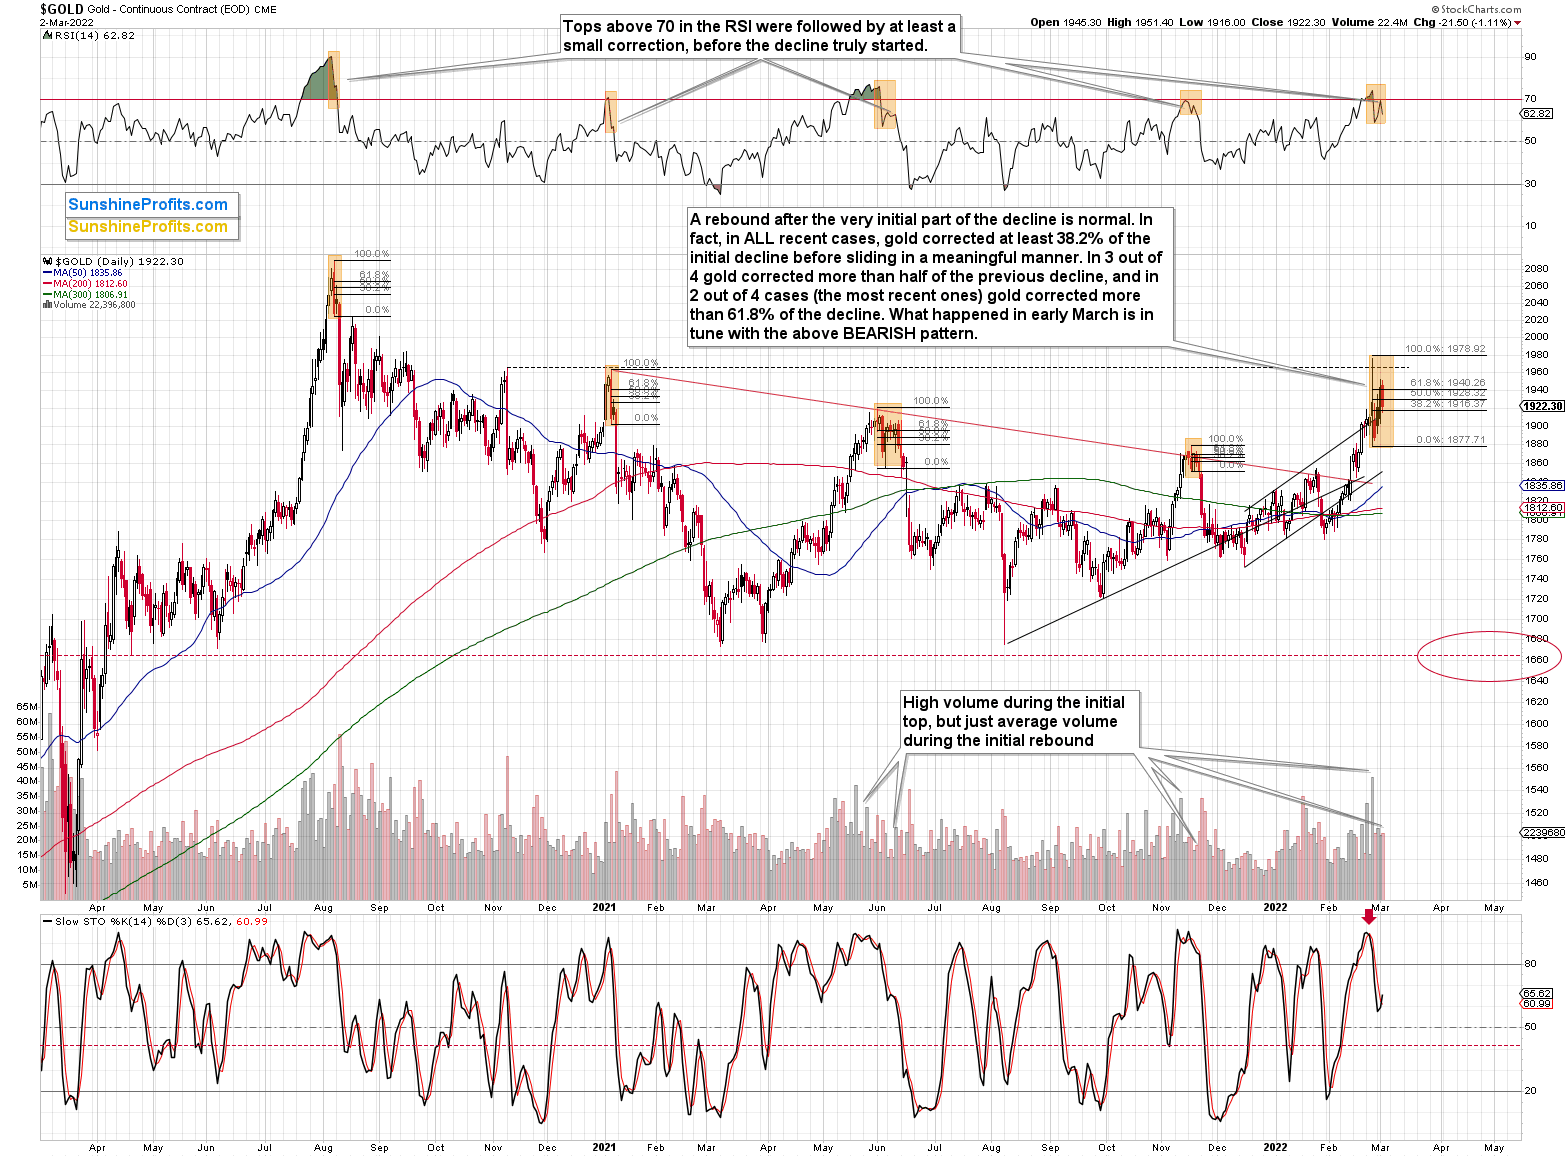
Gold moved above $1,970 (crude oil peaked at $100.54 at that time), and then it declined heavily. It’s now trying to move back to this intraday high, but it was not able to do so. At the moment of writing these words, gold is trading at about $1,930, while crude oil is trading at about $114.
In other words, while gold declined by $30, crude oil rallied by about $14. That’s a repeat of what we saw in 2003!
What happened next in 2003? Gold declined, and the moment when crude oil started to visibly outperform gold was also the beginning of a big decline in gold stocks.
That makes perfect sense on the fundamental level too. Gold miners’ share prices depend on their profits (just like it’s the case with any other company). Crude oil at higher levels means higher costs for the miners (the machinery has to be fueled, the equipment has to be transported, etc.). When costs (crude oil could be viewed as a proxy for them) are rising faster than revenues (gold could be viewed as a proxy for them), miners’ profits appear to be in danger; and investors don’t like this kind of danger, so they sell shares. Of course, there are many more factors that need to be taken into account, but I just wanted to emphasize one way in which the above-mentioned technical phenomenon is justified. The above doesn’t apply to silver as it’s a commodity, but it does apply to silver stocks.
Back in 2004, gold stocks wiped out their entire war-concern-based rally, and the biggest part of the decline took just a bit more than a month. Let’s remember that back then, gold stocks were in a very strong medium- and long-term uptrend. Right now, mining stocks remain in a medium-term downtrend, so their decline could be bigger – they could give away their war-concern-based gains and then decline much more.
Mining stocks are not declining profoundly yet, but let’s keep in mind that history rhymes – it doesn’t repeat to the letter. As I emphasized previously today, back in 2003 and 2002, the tensions were building for a longer time and it was relatively clear in advance that the U.S. attack was going to happen. This time, Russia claimed that it wouldn’t attack until the very last minute before the invasion. Consequently, the “we have to act now” is still likely to be present, and the dust hasn’t settled yet – everything appears to be unclear, and thus the markets are not returning to their previous trends. Yet.
However, as history shows, that is likely to happen. Either immediately, or shortly, as crude oil is already outperforming gold.
Investing and trading are difficult. If it was easy, most people would be making money – and they’re not. Right now, it’s most difficult to ignore the urge to “run for cover” if you physically don’t have to. The markets move on “buy the rumor and sell the fact.” This repeats over and over again in many (all?) markets, and we have direct analogies to similar situations in gold itself. Junior miners are likely to decline the most, also based on the massive declines that are likely to take place (in fact, they have already started) in the stock markets.
Thank you for reading our free analysis today. Please note that the above is just a small fraction of the full analyses that our subscribers enjoy on a regular basis. They include multiple premium details such as the interim targets for gold and mining stocks that could be reached in the next few weeks. We invite you to subscribe now and read today’s issue right away.
Sincerely,
Przemyslaw Radomski, CFA
Founder, Editor-in-chief -
Gold: A Safe-Haven Asset During Wartime. But Is It, Really?
March 2, 2022, 8:45 AMWith more geopolitical-related re-positioning stealing the spotlight on Mar. 1, Brent and WTI surged, and the PMs spiked higher as well. However, while the short-term implications haven’t been beneficial, the recent rallies may be nearing their end.
For example, when crises erupt, investors follow a familiar playbook. With another re-enactment on full display, the unwinding of these positions will likely have a drastic impact over the medium term.
Please see below:
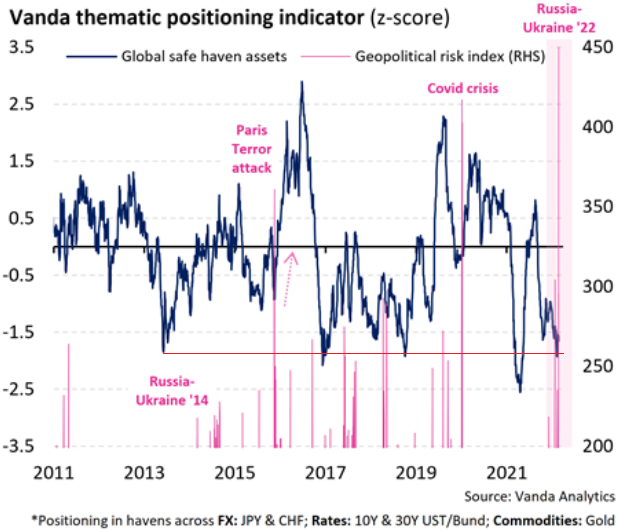
To explain, the blue line above tracks investors’ positioning in global safe-haven assets. For context, the basket includes risk-off currencies, bonds, and, of course, gold. However, if you analyze the right side of the chart, you can see that the dark blue line is roughly two standard deviations from its average. As a result, the implied probability of further bullish positioning is roughly 2.5%. Quite a huge contrast from the “100% certainty” that gold soars during wartime that we see in some internet forums, isn’t it?
Furthermore, if you focus your attention on the low points witnessed over the last ~10 years, investors’ current positioning in safe-haven assets has surpassed the peak that materialized during the Russia-Ukraine conflict in 2014 (follow the horizontal red line above).
On top of that, if you analyze the pink vertical bar on the right side of the chart, you can see that Vanda Research’s geopolitical risk index has hit a roughly 10-year high. As a result, fear is abundant, and investors use safe havens as a short-term hiding spot. However, over-positioning in safe-haven assets nearly always leads to sharp reversions once sentiment shifts. Thus, if history is any indication, we may have already seen peak fear, and a re-allocation away from these assets will likely sink the PMs.
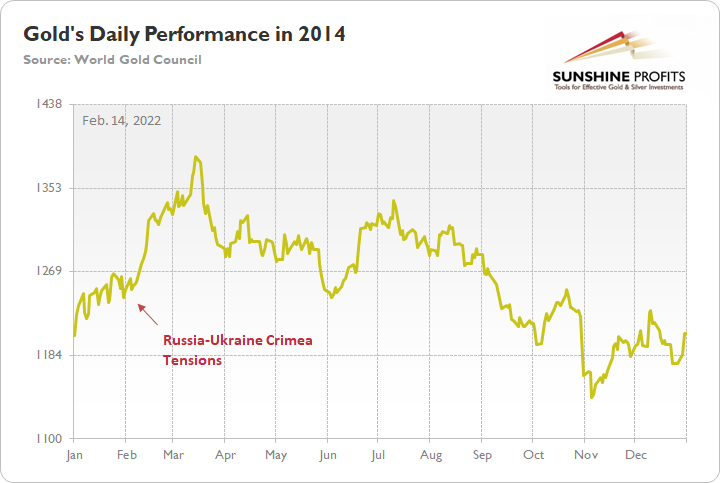
For context, I’ve presented the chart below on numerous occasions. However, if you compare investors’ positioning in global safe-haven assets in 2014 to where we are today (again, follow the horizontal red line above), you can see that the current reading has surpassed the peak from when Russia annexed Crimea in 2014.
Furthermore, if you compare the data with the chart below, you can see that peak safe-haven flows in 2014 coincided with peak gold. As investors’ positioning in global safe-haven assets reverted toward neutral from 2014 to 2015, the yellow metal sank like a stone.
As such, considering that the z-score implies a ~2.5% probability of further bullish positioning ahead, it means that there is a ~97.5% chance that safe-haven bets decelerate from here. With gold suffering mightily during the 2014 unwind, is this time really different?
If that wasn't enough, the Fed's next monetary policy meeting is on Mar. 15/16. While investors remain distracted by the Russia-Ukraine conflict, officials aren't backing off their hawkish rhetoric.
For example, Fed Governor Christopher Waller said on Feb. 24 that "it is possible that the state of the world will be different in the wake of the Ukraine attack, and that may mean that a more modest tightening is appropriate."
However, with Russia accounting for less than 2% of global GDP and the U.S. only levered to Russian oil, Waller said: "I believe appropriate interest rate policy brings the target range up to 1% to 1.25% early in the summer," and that selling assets on the Fed's balance sheet should occur "no later than" the July meeting.
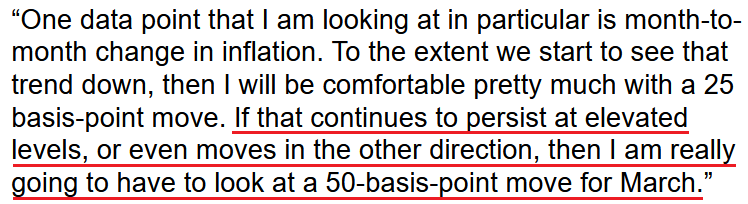
Furthermore, if inflation outperforms when the data is released on Mar. 10, Waller said that a 50 basis point rate hike could be appropriate.
Please see below:
 Source: Bloomberg
Echoing that sentiment, Atlanta Fed President Raphael Bostic said on Feb. 28: “I am still in favor of a 25 basis-point move at the March meeting.”
However, he added: “every meeting is live for us. As data comes in, we will have to make judgments about what happens at every stage of the way.”
“Historically, over the last 10 years or so our moves have been in 25 basis point increments,” he said. “I was hearing and getting a sense that many expected that was the only type of move we could do. I actually think that is wrong. We need to make sure people have different levels of move in mind, and awareness of those are possibilities.”
As a result, if inflation remains elevated, Bostic also said that a 50 basis point rate hike in March is a possibility:
 Source: Bloomberg
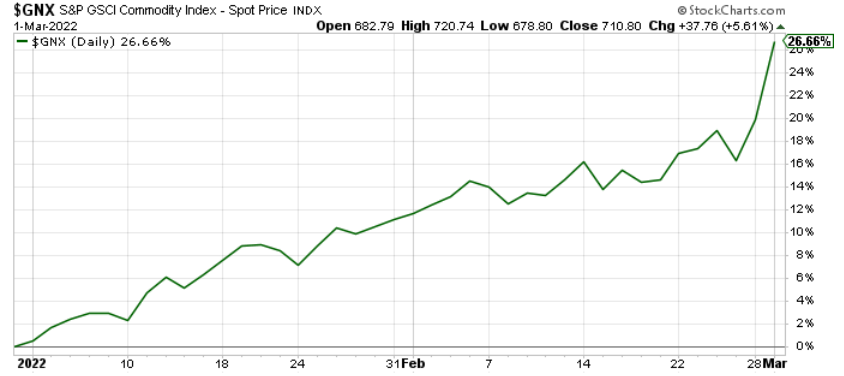
To that point, if the Fed wants inflation, it doesn’t have to look very far. For example, the S&P Goldman Sachs Commodity Index (S&P GSCI) has rallied by nearly 27% year-to-date (YTD). For context, the S&P GSCI contains 24 commodities from all sectors: six energy products, five industrial metals, eight agricultural products, three livestock products and two precious metals. However, energy accounts for roughly 54% of the index’s movement.
Moreover, with the Russia-Ukraine conflict intensifying the supply shortages, the inflationary impact is material.
Please see below:
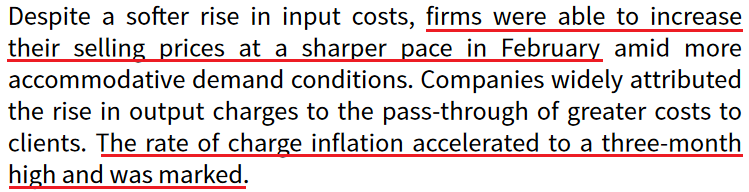
Second, IHS Markit released its U.S. manufacturing PMI on Mar. 1. While the headline index increased from 55.5 in January to 57.3 in February, and “less severe supply disruption was reflected in a slower increase in input prices,” the data was compiled before Russia invaded Ukraine. As a result, with the S&P GSCI going vertical in recent days, input prices will likely accelerate next month.
Furthermore, the short-term slowdown in input prices didn’t stop businesses from raising their output prices.
Please see below:
 Source: IHS Markit
To that point, Chris Williamson, Chief Business Economist at IHS Markit, said:
“Demand is clearly continuing to run well ahead of supply, meaning it is a sellers’ market for a wide variety of goods. Although the survey’s price gauges covering companies’ costs and selling prices are off the peaks seen last year, they remain very high by historical standards and point to persistent elevated inflation in coming months. With rising oil prices adding further to soaring costs, and the Ukraine crisis likely to add to global supply disruptions, the inflation outlook is an increasing concern.”
Speaking of demand, the report revealed:
“Increased new order inflows spurred greater optimism among manufacturing firms in February. Output expectations for the coming year were the strongest since November 2020, as firms were buoyed by hopes of a reduction in supply-chain disruption and a greater ability to retain employees.”
Finally, the Institute for Supply Management (ISM) also released its Manufacturing PMI on Mar. 1. Showcasing similar strength, the headline index increased from 57.6 in January to 58.6 in February. Moreover, while pricing pressures calmed somewhat from last month, Timothy R. Fiore, Chair of the ISM Manufacturing Business Survey Committee, said:
"The U.S. manufacturing sector remains in a demand-driven, supply chain-constrained environment. The COVID-19 omicron variant remained an impact in February; however, there were signs of relief, with recovery expected in March. A higher-than-normal quits rate and early retirements continued. Panel sentiment remained strongly optimistic, with 12 positive growth comments for every cautious comment, up from January's ratio of 7-to-1.”
As a result, U.S. economic growth remains resilient, and all of the metrics tracked by the ISM are pointing in positive directions.
Why is this so important?
Well, because it keeps the pressure on the Fed. With growth and inflation outperforming their pre-COVID trends, the Fed has little reason to perform a dovish 180. Moreover, with the Russia-Ukraine conflict only exacerbating the pricing pressures, the Fed is running out of time to act. In addition, it was only four months ago that the idea of a rate hike in March was ridiculous. Now, some Fed officials are debating whether 25 or 50 basis points are appropriate.
Thus, while the PMs remain distracted from the more important fundamental development, the situation is unfolding exactly like in 2014. As a result, while it’s unclear when sentiment will shift, history implies that when it does, safe-haven positioning and the fundamental backdrop should be extremely unkind to the PMs.
In conclusion, the PMs rallied on Mar. 1, as investors remain sensitive to every Russia-Ukraine headline. However, with one-sided safe-haven bets surpassing the splurge from 2014, the medium-term unwind will likely culminate with crashing precious metals prices. As a result, while the short-term environment remains challenging, sentiment should look a lot different in the coming months.
Thank you for reading our free analysis today. Please note that the above is just a small fraction of the full analyses that our subscribers enjoy on a regular basis. They include multiple premium details such as the interim targets for gold and mining stocks that could be reached in the next few weeks. We invite you to subscribe now and read today’s issue right away.
Sincerely,
Przemyslaw Radomski, CFA
Founder, Editor-in-chief -
Russia’s Financial Troubles: Will They Cast a Shadow on Gold?
March 1, 2022, 9:23 AMSanctions, terminated contracts, and a plummeting currency – Russia is facing the financial crisis specter. Can gold also be affected? In the medium term, even painfully.
While gold continues to ride the bullish wave of geopolitical tensions, confusion has arisen over whether Russia’s financial woes will support or hurt the yellow metal. For context, I wrote on Feb. 28:
Even if the recent escalation uplifts gold in the short term, the fundamental implications of Russia’s financial plight support lower gold prices over the medium term.
Please see below:
To explain, with Russia essentially blacklisted from many influential FX counterparties, the Russian ruble relative to the U.S. dollar was exchanged for a roughly 50% discount on Feb. 27. As a result, Russian's purchasing power is nearly half of what it was before Sunday's developments.
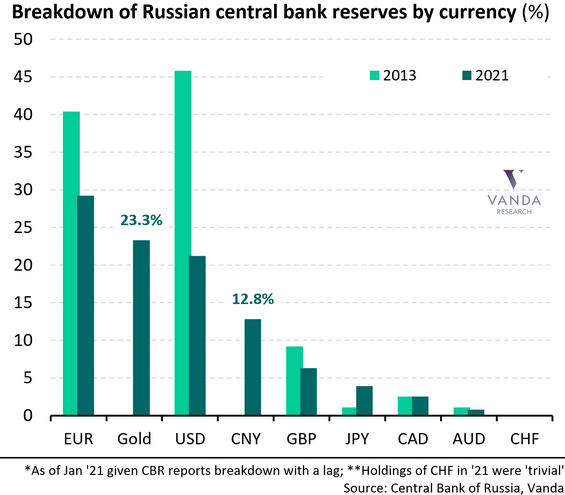
Furthermore, if you analyze the chart above, you can see that euros and U.S. dollars made up a large portion of Russia's monetary base in 2013 (the green bars on the left). Conversely, those holdings dropped dramatically in 2021 (the blue bars on the left).
In addition, if you focus your attention on the column labeled "Gold," you can see that FX has been swapped for gold, and the yellow metal accounts for roughly 23% of Russia's monetary base. Now, with the impaired state of the ruble offering little financial reprieve, Russia may have to sell its gold reserves to alleviate the pressure from NATO's economic sanctions.
As a result, while war is often bullish for gold, the fundamental implications of currency devaluation mean that gold is Russia's only worthwhile asset outside of oil. Thus, with bank runs already unfolding in the region, the yellow metal could be collateral damage.
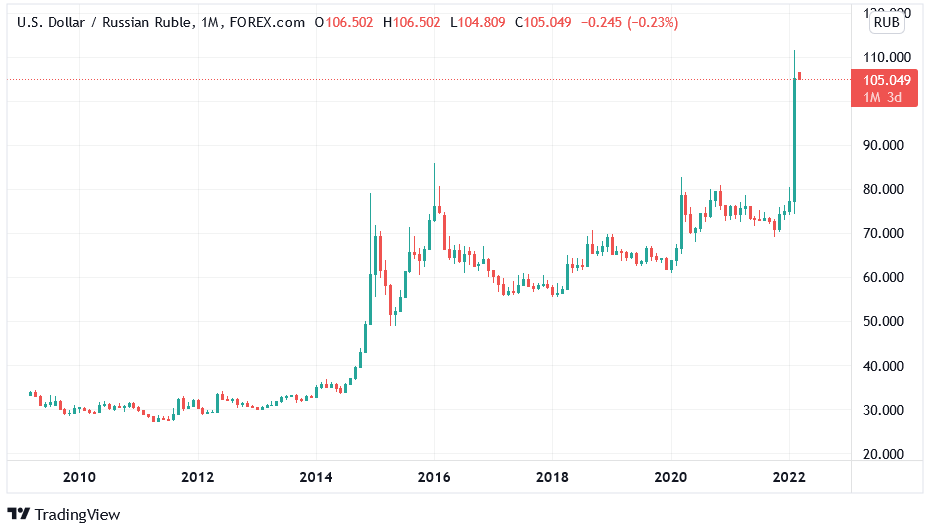
To that point, the USD/RUB closed at roughly 105 on Feb. 28. As a result, it costs 105 Russian rubles to obtain one U.S. dollar. With the spot gold price at around $1,900 per ounce, it costs roughly 199,500 Russian rubles to purchase an ounce of gold.
In stark contrast, the USD/RUB closed at approximately 75 on Feb. 16, which means that less than two weeks ago, it cost 142,500 Russian rubles to purchase an ounce of gold at the current price. As such, in currency-adjusted terms, the cost of an ounce of gold in Russia has increased by roughly 40% in recent days.
However, after Bloomberg posted an article on Feb. 27 titled “Bank of Russia Resumes Gold Buying After Two-Year Pause,” the revelation may have caused some anxiety about our short position (as a reminder, it’s not in gold, but in junior mining stocks). For context, an excerpt from the article read:
“The central bank will begin buying gold again on the domestic precious metals market, it said in a statement. The move comes after the monetary authority and several of the country’s commercial banks were sanctioned in response to Russia’s invasion of Ukraine.”
As a result, if Russia goes on a shopping spree for bullion, could the price skyrocket? Well, the reality is that the fundamentals don’t support the sentiment. As mentioned, the USD/RUB has surged in recent days, and the sharp decline in the value of the Russian currency is extremely bearish for the Russian economy.
Please see below:
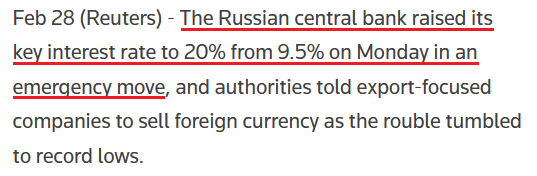
Furthermore, while Russia may want to increase its gold reserves, it’s essential to focus on what Russia does and not what it says. For example, the Russian central bank increased its overnight lending rate from 9.5% to 20% on Feb. 28. While U.S. investors fret over a 25 basis point hike from the Fed (which, as mentioned previously, should occur in March), Russia had to increase interest rates by 10.5% to help stop the ruble’s bleeding.
Please see below:
 Source: Reuters
For context, higher interest rates encourage capital flows, and with the ruble in free-fall, Russia is hoping that investors will buy the currency, invest in Russian bonds, and potentially earn a 20% return. Moreover, if the currency rallies during the holding period, the carry trade would be highly lucrative for an institution willing to incur the risk.
However, the story is only sanguine in theory. In reality, though, crippling sanctions from NATO and private companies divesting their Russian assets mean that buying the ruble and other Russian securities requires a gambler’s mentality. For example, Viraj Patel, FX and Macro Strategist at Vanda Research, summed up the dynamic in a few simple words on Feb. 28:
 Source: Viraj Patel Twitter
Thus, while Russia may claim it's buying gold, and who knows, maybe it will, the financial destruction plaguing the region will likely make Russia a net-seller over the medium term. To that point, if we circle back to the Bloomberg article referenced above, Nicky Shiels, head of metals strategy at MKS PAMP SA, said in the same piece that investors would interpret the actions as short-term bullish.
However, aligning with our expectations, she noted that investors have misjudged the medium-term impact of Russia's currency crisis.
Please see below:
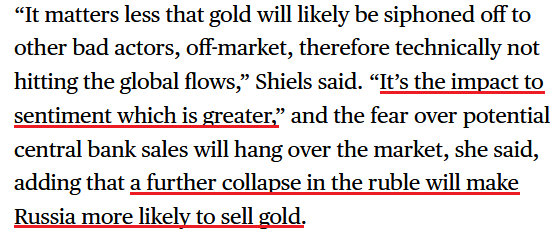 Source: Bloomberg
As a result, that’s why I wrote on Feb. 28 that while volatility may be the name of the game this week as investors struggle to digest the implications, the geopolitical risk premium that often supports gold may prove counterintuitive this time around.
Furthermore, we shouldn't ignore the potential impact on the USD Index. For example, while the dollar basket defied expectations and rose materially in 2021, the momentum continued in 2022. However, after a sharp rally in January, investors repositioned their bets, and euro longs were in style once again. However, with the risk-on trade now disrupted by the Russia-Ukraine conflict, more downside for the euro implies more upside for the USD Index.
Please see below:
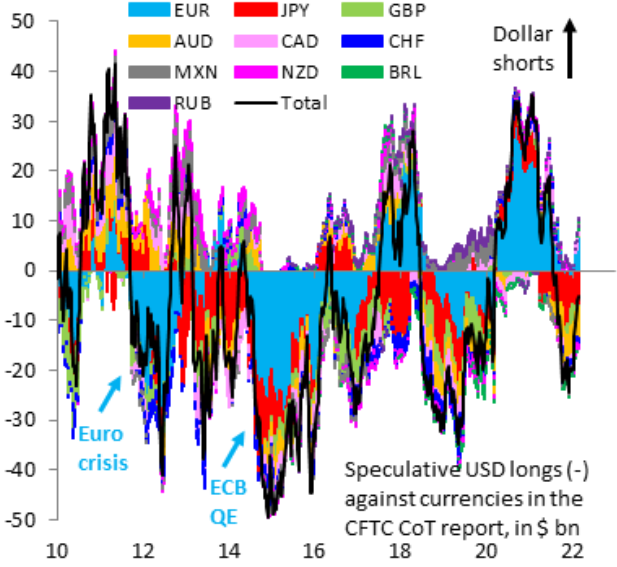 Source: Institute of International Finance (IIF)/Robin Brooks
To explain, the color blocks above track the non-commercial (speculative) futures positioning for various currencies versus the U.S. dollar, while the black line above tracks the consolidated total. If you analyze the right side of the chart, you can see that the black line has moved higher recently, which signals fewer U.S. dollar long positions.
More importantly, though, if you focus your attention on the light blue blocks on the right side of the chart, you can see that speculative euro longs have increased and remain in positive territory. However, with the economic impact of the Russia-Ukraine conflict much more troublesome for the Eurozone than the U.S., speculative EUR/USD positioning still has plenty of room to move lower.
To that point, Mark Sobel, Senior Advisor at the Center for Strategic and International Studies (CSIS), wrote on Feb. 28 that “the overall impact of Russia’s actions on the U.S. economy may not be significant, assuming oil prices don’t soar, though that remains a significant risk.”
“The challenges for the ECB will be much greater in its debates over balancing the stagflationary consequences of the Russian invasion. Europe is a large net energy importer and remains dependent on Russia for oil and natural gas.”
As a result:
“European Central Bank President Christine Lagarde will feel the strain more than Federal Reserve Chair Jerome Powell. Higher oil prices will boost inflation, weaken growth prospects and stoke stagflation fears.”
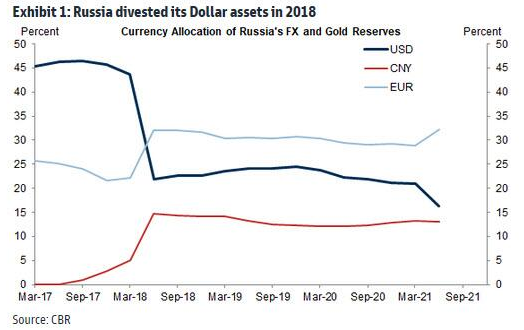
Furthermore, if you analyze the right side of the chart below, you can see that Russia’s monetary base includes more euros (the light blue line) than U.S. dollars (the dark blue line). As a result, if Russia swaps its other FX holdings for rubles (to help stop the decline), the euro has more downside risk than the greenback.
The bottom line? While Russia may put on a brave face and claim that gold purchases are on the horizon, the reality is that its materially weak financial position requires more attention to more pressing matters. With bank runs and a currency crisis already unfolding, combined with NATO sanctions and private companies divesting their Russian assets, the country’s leaders need to stem the tide before a depression unfolds.
As a result, Russia’s oil revenues and the securities it can monetize are more likely to be used to support the Russian economy, rather than to buy gold. Thus, while the yellow metal has enjoyed short-term sentiment high (and so did the silver price), the fundamentals imply a much different outcome over the medium term.
In conclusion, the PMs were mixed on Feb. 28, as the GDX ETF ended the session roughly flat. However, the recent rallies are far from troublesome. For example, I noted previously how gold rallied following the 2001 terrorist attacks and after Russia annexed Crimea in 2014. However, those gains were short-lived, and the latter resulted in lower lows in the months that followed. As a result, while the recent volatility will likely continue, it doesn’t change the bearish medium-term thesis.
Thank you for reading our free analysis today. Please note that the above is just a small fraction of the full analyses that our subscribers enjoy on a regular basis. They include multiple premium details such as the interim targets for gold and mining stocks that could be reached in the next few weeks. We invite you to subscribe now and read today’s issue right away.
Sincerely,
Przemyslaw Radomski, CFA
Founder, Editor-in-chief -
Since There is a War, Gold Will Rise, Right? Wrong.
February 28, 2022, 9:27 AMThe invasion has been priced in and the medium-term remains bearish. Russia may end up selling its gold to remain afloat and the USD is poised to benefit.
As the Russia-Ukraine conflict continues to escalate, responses from NATO allies intensified over the weekend. For example, select Russian commercial banks were sanctioned and cut off from the Society for Worldwide Interbank Financial Telecommunication (SWIFT). In addition, the Russian central bank has been isolated from the global monetary system.
Thus, while volatility may be the name of the game this week as investors struggle to digest the implications, the geopolitical risk premium that often supports gold may prove counterintuitive this time around.
For example, gold rallied hard as the Russia-Ukraine conflict escalated. However, after a ‘buy the rumor, sell the news’ event unfolded on Feb. 25, gold declined by 2.01%. Moreover, even if the recent escalation uplifts gold in the short term, the fundamental implications of Russia’s financial plight don’t support higher gold prices over the medium term. And there are strong technical and other forces (rising long-term rates, rising USD Index) that support gold price’s decline over the medium term.
Please see below:
To explain, with Russia essentially blacklisted from many influential FX counterparties, the Russian ruble relative to the U.S. dollar was exchanged for a roughly 50% discount on Feb. 27. As a result, Russia's purchasing power is nearly half of what it was before Sunday's developments.
Furthermore, if you analyze the chart above, you can see that euros and U.S. dollars made up a large portion of Russia's monetary base in 2013 (the green bars on the left). Conversely, those holdings dropped dramatically in 2021 (the blue bars on the left).
In addition, if you focus your attention on the column labeled "Gold," you can see that FX has been swapped for gold, and the yellow metal accounts for roughly 23% of Russia's monetary base. Now, with the impaired state of the ruble offering little financial reprieve, Russia may have to sell its gold reserves to alleviate the pressure from NATO's economic sanctions.
As a result, while war is often bullish for gold, the fundamental implications of currency devaluation mean that gold is Russia's only worthwhile asset outside of oil. Thus, with bank runs already unfolding in the region, the yellow metal could be collateral damage.
As further evidence, it's important to remember that Russia has plenty of gold stored at foreign central banks. In fact, the aggregate amounts outstrip its foreign FX deposits.
Please see below:
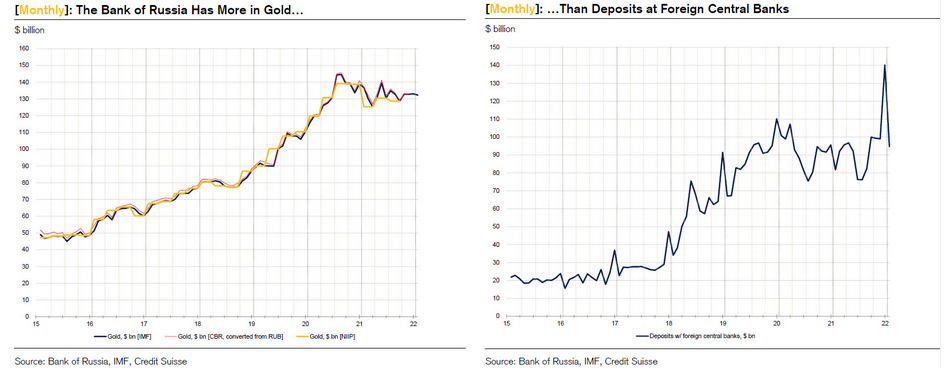
To explain, the chart on the left tracks Russian gold stored at foreign central banks, while the chart on the right tracks deposits other than the yellow metal. If you analyze the trends, the former has remained uplifted, while the latter has declined recently.
However, if NATO countries’ central banks seize these holdings as part of their financial crackdown, it could put more pressure on Russia to liquidate its domestic bullion. As a result, while volatility will likely lead to sharp moves in both directions this week, the often-bullish impact of geopolitical tensions has less fundamental merit this time around.
If that wasn’t enough, you know that I’ve been bearish on the EUR/USD for many months. And since the currency pair accounts for nearly 58% of the USD Index’s movement, its impact is material. To that point, since Eurozone banks have more exposure to Russian debt than their U.S. counterparts, the recent developments are fundamentally bearish for the EUR/USD.
Please see below:
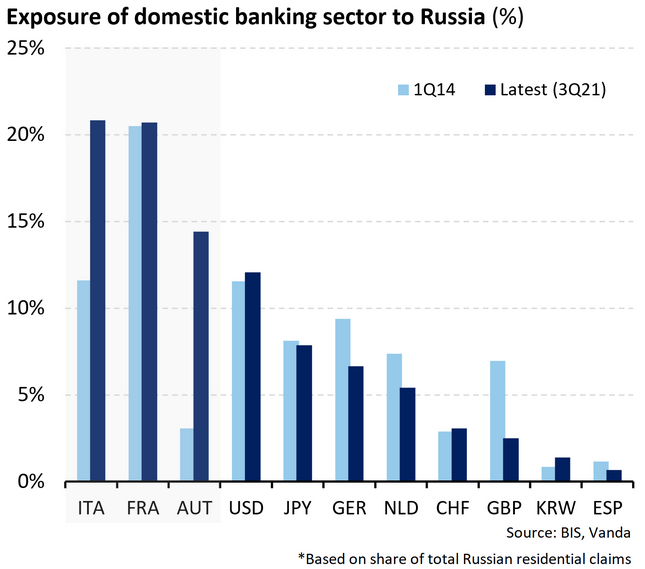
To explain, the light blue bars above depict various countries’ domestic bank exposure to Russian debt in Q1 2014 and the dark blue bars above depict the situation as of Q3 2021. If you analyze the left side of the chart, you can see that Italy, France and Austria are the most exposed to a Russian financial crisis. Moreover, Italy and Austria are much more levered to Russia than in 2014 (compare the light and dark blue bars).
Conversely, while U.S. exposure to Russian debt is material, the share is still lower than its Eurozone counterparts. Furthermore, with Italy’s fiscal health already quite precarious, the impact of potential defaults is much worse than in the U.S. As a result, more pain should confront the euro, which should help uplift the USD Index.
To that point, potential Russian delinquencies aren’t the only problem confronting the Eurozone. For example, Russian imports accounted for 2.8% of the Eurozone’s consolidated average monthly total since December 2020. In contrast, Russian imports only accounted for 1% of the U.S.’ consolidated average monthly total since December 2020.
Thus, while the percentages may seem immaterial, it’s important to remember that it’s all relative. And with the Eurozone under more relative pressure than the U.S., the FX implications support a stronger greenback.
Please see below:
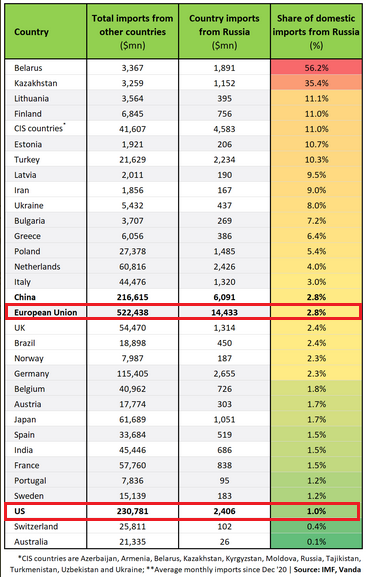
To explain, if you analyze the second column from the right, you can see that Eurozone average monthly imports of Russian goods and services since December 2020 are $14.433 billion. Conversely, the U.S. monthly average stands at $2.406 billion. As a result, the Eurozone economy faces much steeper conflict risks, and the U.S. dollar is a relative beneficiary from the Russia-Ukraine upheaval.
The bottom line? While concerns over World War 3 and anxiety over Russian President Vladimir Putin's nuclear arsenal may elicit a short-term bid for gold, the prospect of a global crisis remains remote at this point. Moreover, with the U.S. dollar a winner, the euro a loser, and Russian isolation likely to result in the selling of its gold reserves, the fundamental implications support lower precious metals prices over the next few months.
To that point, the Fed's stance also remains unchanged, and the Russia-Ukraine drama is unlikely to derail a rate hike in March. Moreover, if the conflict unfolds like 2014, the market impact of each new headline will likely diminish over time. As a result, plenty of bearish fundamental developments should confront the PMs in the coming months.
What if we see these events develop into World War 3? Then gold in the insurance part of one’s portfolio would likely soar, more than making up for any profits not realized in case of short-term trades. That’s unlikely though. What is likely is that we’re already past the peak concern and that gold can now decline along with its medium-term trend. And that junior mining stocks would be affected to the highest degree.
In conclusion, the PMs were mixed on Feb. 25, as the general stock market's risk-on, risk-off behavior continues to pull them in competing directions. However, while the news flow, and investors' reaction to it, remain extremely uncertain in the short term, the bearish medium-term thesis remains intact: technicals, fundamentals and often misguided war premiums support sharp reversals for gold, silver, and mining stocks in the coming months. As a result, while it may be a wild ride this week, ignoring the noise and remaining level-headed is the most prudent course of action.
Thank you for reading our free analysis today. Please note that the above is just a small fraction of the full analyses that our subscribers enjoy on a regular basis. They include multiple premium details such as the interim targets for gold and mining stocks that could be reached in the next few weeks. We invite you to subscribe now and read today’s issue right away.
Sincerely,
Przemyslaw Radomski, CFA
Founder, Editor-in-chief -
Gold: What Should We Expect Given the Ongoing Conflict?
February 25, 2022, 7:40 AMAs history shows, gold and silver rallies based on geopolitical tensions are often short-lived. Yesterday, a hint of a trend reversal appeared.
Don’t stop reading this mining stock analysis until you get to the part about junior mining stocks’ analogy. Something might interest you there.
While the unfortunate conflict confronting Russia and Ukraine has intensified in recent days, gold, silver, and mining stocks have benefited from the crisis. However, since history shows that geopolitical-tension-based rallies often reverse, Feb. 24 was likely a small indication of what should unfold over the next few months.
For example, gold’s sharp rally turned into a sharp intraday reversal on Feb. 24. While the S&P 500, the NASDAQ Composite, the S&P 500, and gold managed to end the session in the green, the GDX ETF declined by 1.93%.
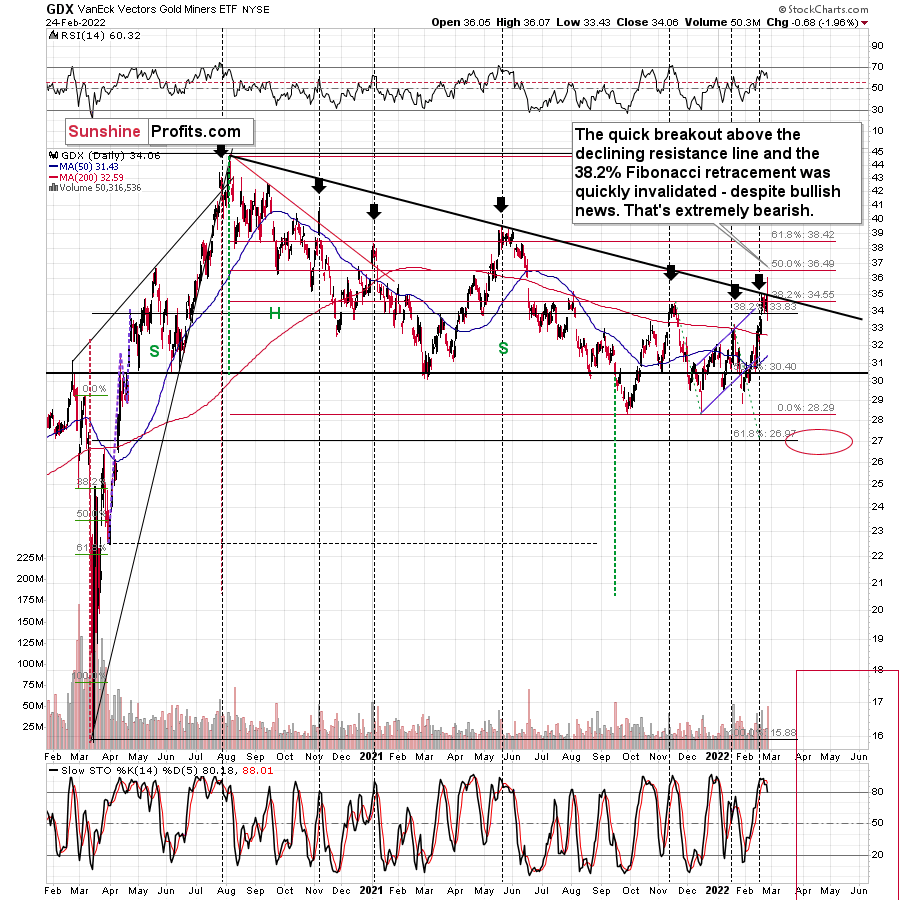
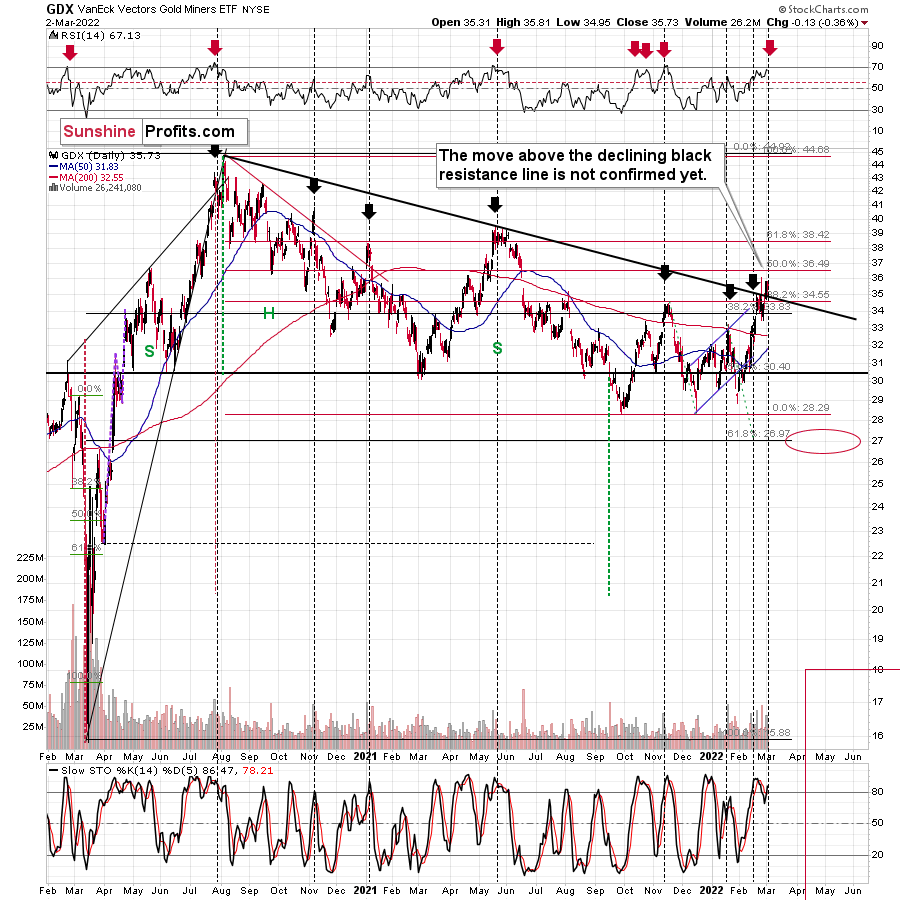
Furthermore, after the gold and silver senior miners rallied above their medium-term declining resistance line (the downward sloping black line in the middle of the chart below), the intraday reversal invalidated the breakout and it occurred on significant volume.
At the same time, senior mining stocks invalidated their attempt to break above their 38.2% Fibonacci retracement. That’s yet another bearish sign.
This means that the GDX ETF’s medium-term downtrend remains intact, and that the short-term concern-based rally may have just ended.
To that point, the HUI Index provides clues from a longer-term perspective. When we analyze the weekly chart, the current short-term move higher is in tune with the previous patterns, but history is not repeating itself to the letter.
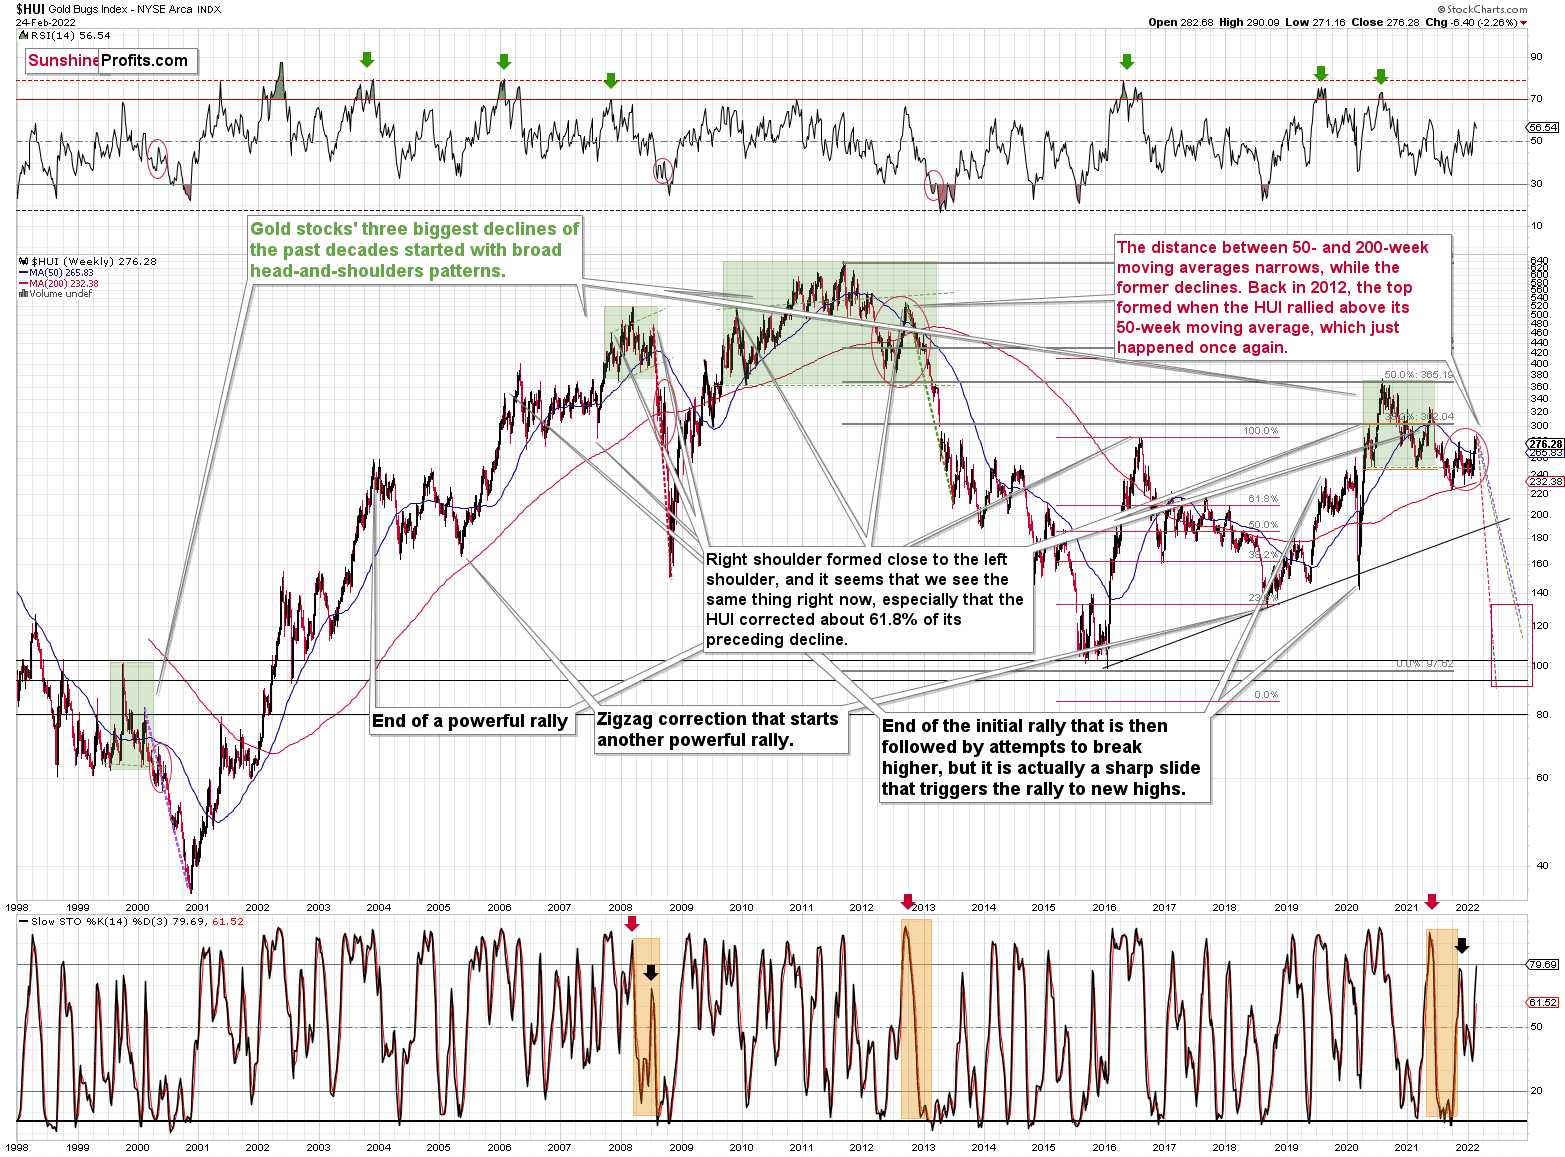
The three previous cases that I marked with green were not identical, but quite similar in terms as they were all some sort of a broad head-and-shoulders pattern.
Now, this pattern can have more than two “shoulders”. It’s not that common, but it happens. It seems that what we saw recently (I mean the late-2021 – Feb. 2022 rally) could be viewed as either a part of a big post-pattern consolidation, or another right shoulder of the pattern.
Based on how broad the pattern is and self-similarity present in gold, it seems that the analogy to what happened in 2012 is most important right now.
Looking at the moving averages, we see that the 50-week moving average (blue) and 200-week moving average (red) performed quite specifically in late 2012, and we see the same thing this year.
The distance between 50- and 200-week moving averages currently narrows, while the former declines. Back in 2012, the top formed when the HUI rallied above its 50-week moving average, which just happened once again.
Still, if the general stock market slides, and that appears likely for the following weeks and months, then we might have a decline that’s actually similar to what happened in 2008. Back then, gold stocks declined profoundly, and they have done so very quickly.
The dashed lines that start from the recent prices are copy-paste versions of the previous declines that started from the final medium-term tops. If the decline is as sharp and as big as what we saw in 2008, gold stocks would be likely to decline sharply, slightly below their 2016 low. If the decline is more moderate, then they could decline “only” to 120 - 140 or so. Either way, the implications are very, very, very bearish for the following weeks.
Turning to the junior miners, the GDXJ ETF tried to break out above a lower declining resistance line (the downward-sloping blue line drawn from the mid-2021 and late-2021 highs below). However, the attempt was rejected and culminated with a sharp intraday reversal. Moreover, the junior miners’ relative weakness was on full display, as despite the green lights flashing for the general stock market, gold, and silver, the GDXJ ETF ended the Feb. 24 session down by 2.28%.
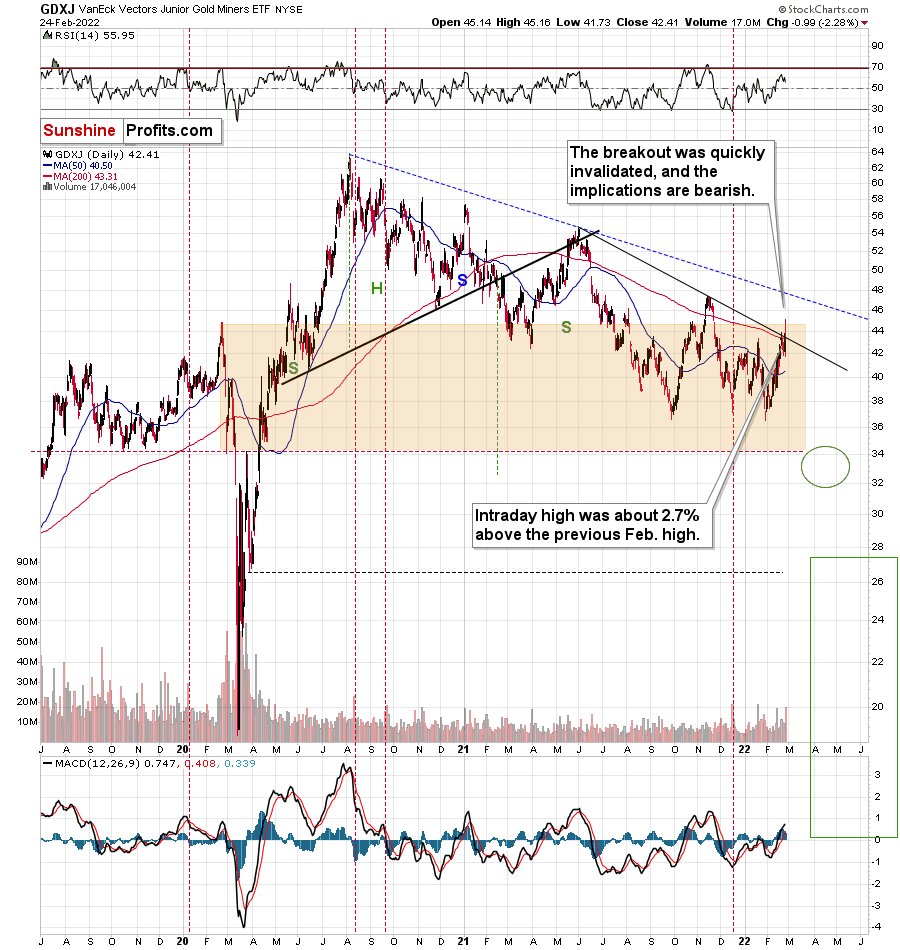
In addition, please note that the bearish about-face occurred on strong volume, and the move mirrored the sharp spike that preceded the March 2020 plunge.
Please note that while junior miners invalidated their breakout above the declining resistance line, similarly to GDX, it was not the analogous line. The line that’s analogous to the one on the previous GDX chart is the blue, dashed line. GDXJ was not even close to it.
In other words, junior miners are underperforming seniors, just like what I’ve been expecting to see for months. The trend in the ratio between them is clear too.
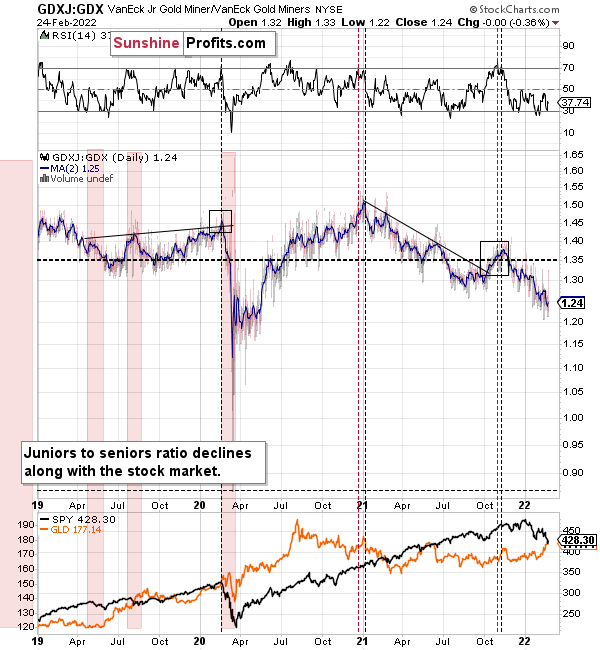
Once again (just like in 2020), junior miners are likely to decline more than seniors, providing a greater shorting opportunity for truly epic profits.
Let’s get back to the previous chart for a moment, and let’s expand on the “just like in 2020” analogy.
Buckle-up, Alice, because the ride down the similarity rabbit hole is going to be a wild one.
Here it goes:
- The early-2020 top in the GDXJ formed after a sharp short-term rally.
- The early-2020 top in the GDXJ formed when GDXJ opened much higher, declined on an intraday basis, and ended the day lower.
- The early-2020 top in the GDXJ formed at $44.85, on significant volume.
- When the GDXJ topped in early-2020, its 50-day moving average was at about $40, and the MACD indicator was at about 1.
Now, let’s consider what happened yesterday.
- This week’s top in the GDXJ formed after a sharp short-term rally.
- This week’s top in the GDXJ formed when GDXJ opened much higher, but declined on the intraday basis, and ended the day lower.
- This week’s top in the GDXJ formed at $45.16 (just 0.7% higher than in early-2020), on significant volume.
- When the GDXJ topped this week, its 50-day moving average was at about $40 ($40.50), the MACD indicator was at about 1 (0.747).
If you think that’s extremely similar, you’re right. However, I saved the best for last:
The early-2020 top formed on February 24.
Yesterday WAS February 24.
Does this guarantee a slide like in 2020 in the junior miners? Of course not, there are no guarantees in any market, but does that make it even more likely? Yes, it does. Is it an epic opportunity for those who position themselves correctly? Again, I can’t make any promises or guarantees, but that’s what seems likely to me.
All in all, a crash below $20 is not out of the question. In the meantime, though, I expect the GDXJ ETF to challenge the $32 to $34 range. However, this is my expectation for a short-term bottom only. While the GDXJ ETF may record a corrective upswing at this level, the downtrend should continue thereafter, and the junior miners should fall further over the medium term.
In conclusion, the unfortunate situation unfolding in Ukraine is important, from a humanitarian perspective, and I hope that a peaceful resolution materializes. Also, it is my responsibility to analyze the situation and report it to you how it’s likely to impact the markets and what it implies for one’s trading positions. What’s justified from the risk-to-reward point of view and what’s not. While gold, silver, and mining stocks benefited from geopolitical tensions, history shows that such gains are short-lived. As a result, I still expect the trio to hit lower lows over the medium term, and I think that the decline will not be subtle.
Thank you for reading our free analysis today. Please note that the above is just a small fraction of the full analyses that our subscribers enjoy on a regular basis. They include multiple premium details such as the interim targets for gold and mining stocks that could be reached in the next few weeks. We invite you to subscribe now and read today’s issue right away.
Sincerely,
Przemyslaw Radomski, CFA
Founder, Editor-in-chief


Gold Investment News
Delivered To Your Inbox
Free Of Charge
Bonus: A week of free access to Gold & Silver StockPickers.
Gold Alerts
More-
Status
New 2024 Lows in Miners, New Highs in The USD Index
January 17, 2024, 12:19 PM -
Status
Soaring USD is SO Unsurprising – And SO Full of Implications
January 16, 2024, 8:40 AM -
Status
Rare Opportunity in Rare Earth Minerals?
January 15, 2024, 2:06 PM

