

Briefly: in our opinion, full (300% of the regular position size) speculative short positions in mining stocks are justified from the risk/reward point of view at the moment of publishing this Alert.
Once again, not much changed in the precious metals market yesterday, and, once again, whatever did happen simply confirmed what I wrote previously.
Gold moved a bit higher, mining stocks generally ignored it, and this was a continuation of the previous underperformance. The USD Index continued to consolidate right below the neck level of a medium-term inverse head-and-shoulders pattern, so the “calm before the storm” mode remains “on”.
In yesterday’s analysis, I wrote the following about the size of gold’s correction:
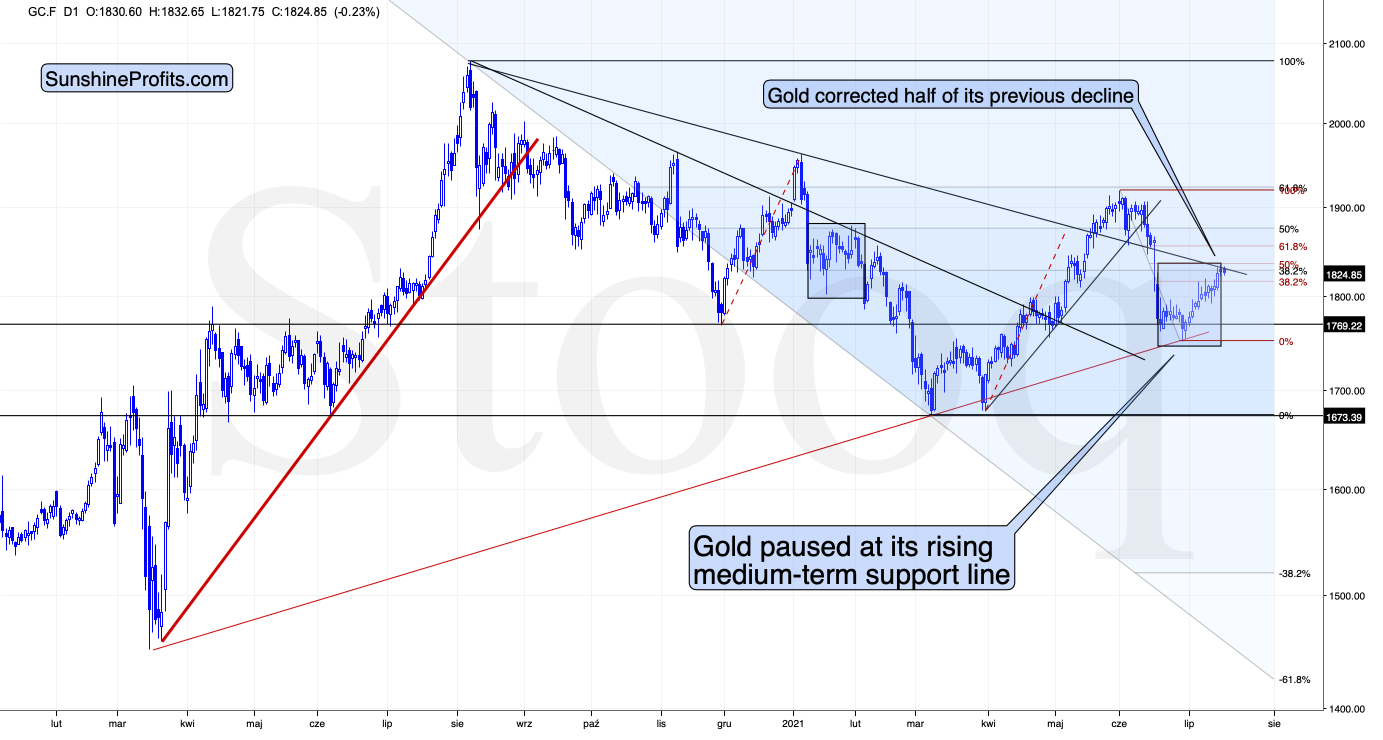
Overall, gold continues to follow a very similar pattern to what it did in January. After a sharp slide, gold then corrected about half of the preceding decline and then declined much more. Based on yesterday’s and today’s pre-market upswings, gold is very close to its 50% Fibonacci retracement, which means that the sizes of corrections are analogous. Consequently, it would be quite natural for the correction to end shortly.
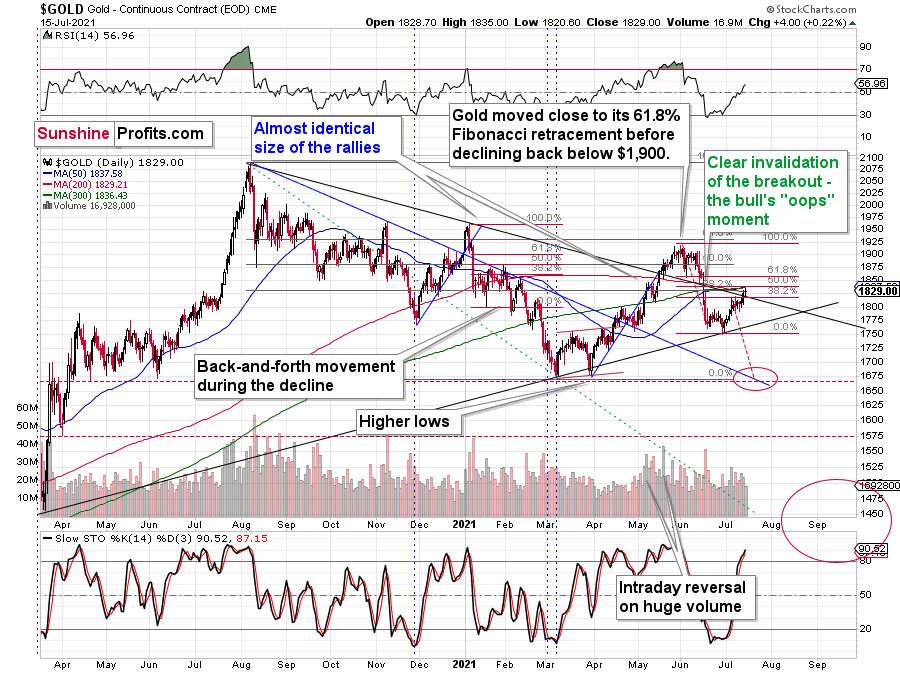
You can see it clearly on the above chart. Gold just moved to the 50% Fibonacci retracement, and when the same happened in January, it meant that the corrective upswing was over.
Today’s pre-market decline (small, but still) seems to confirm that the top might already be in.
The key bearish confirmation doesn’t come from gold itself, but from the very weak performance of mining stocks.
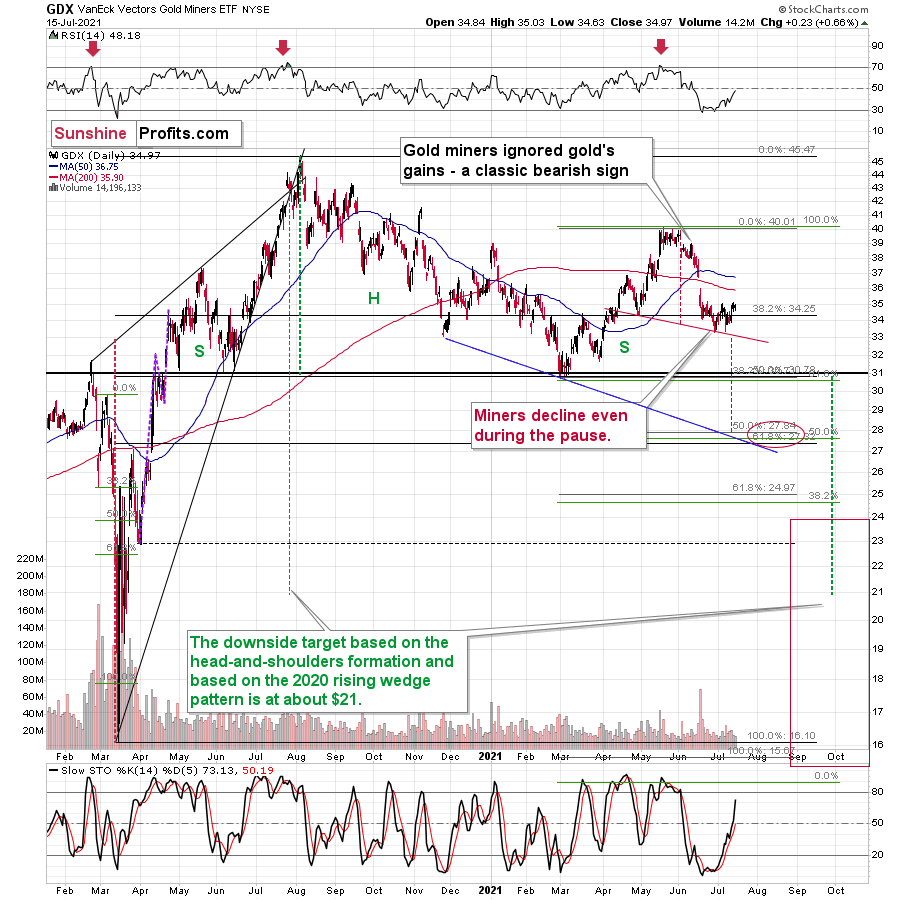
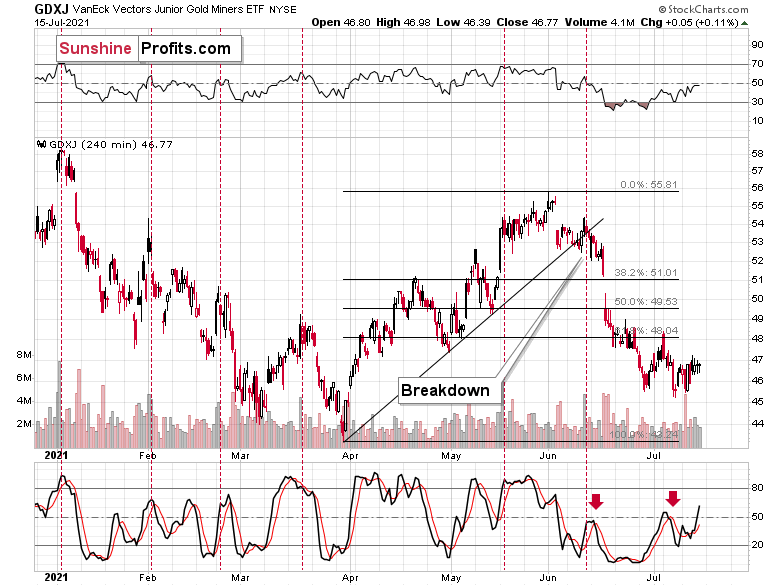
Senior gold miners (GDX) have barely moved to their recent highs, even though gold is visibly higher. And junior gold miners (GDXJ) didn’t even manage to do the same thing. The upswing that we saw in case of the latter was tiny and practically barely visible.
Let’s not forget that while things may seem calm (at least in case of the minings stocks) now, they might change very soon and very fast. The situation in the USD Index shows that the storm is already brewing.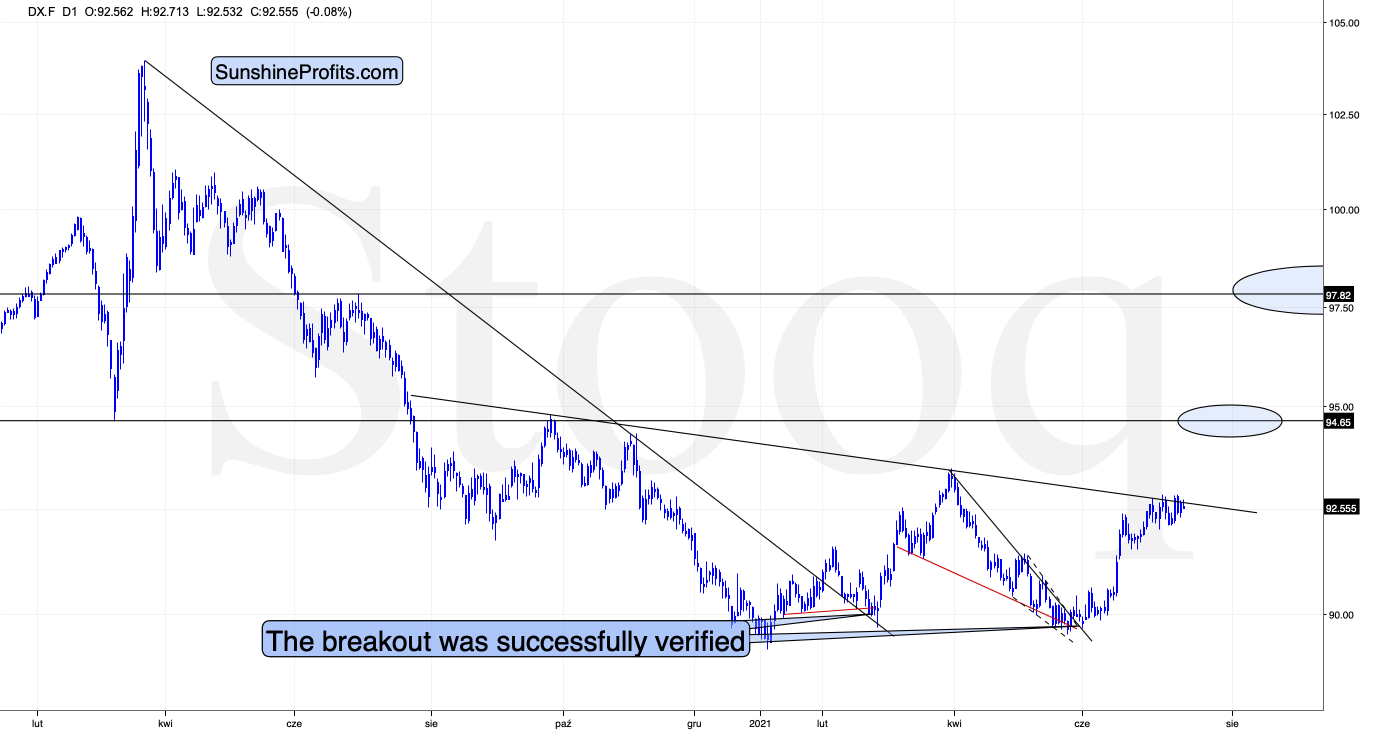
The U.S. currency is on the verge of breaking above the neck level of a medium-term inverse head-and-shoulders pattern. Once it breaks above it, it will likely rally to about 98 without looking back. When that happens, it’s very probable that it will trigger big declines in the precious metals sector – and this breakout in the USDX seems to be just around the corner.
Having said that, let’s take a look at the markets from a more fundamental angle.
You Don't Say!
At first it was nothing, then it was something, and now it’s…
 Source: CNBC
Speaking with CNBC on Jul. 15, U.S. Treasury Secretary Janet Yellen – who preceded Jerome Powell as the Chairman of the U.S. Federal Reserve (FED) – said that declining long-term Treasury yields is “the market expressing its views that inflation does remain under control.” However, while the contradictory statements of “several more months of rapid inflation” and “inflation does remain under control” are quite humorous, she has a point: with bond investors eager to front-run the FED’s forthcoming taper, the U.S. 10-Year Treasury yield has been the main casualty. And with gold often moving inversely of the U.S. 10-Year real yield, the development has strengthened the yellow metal.
Please see below:
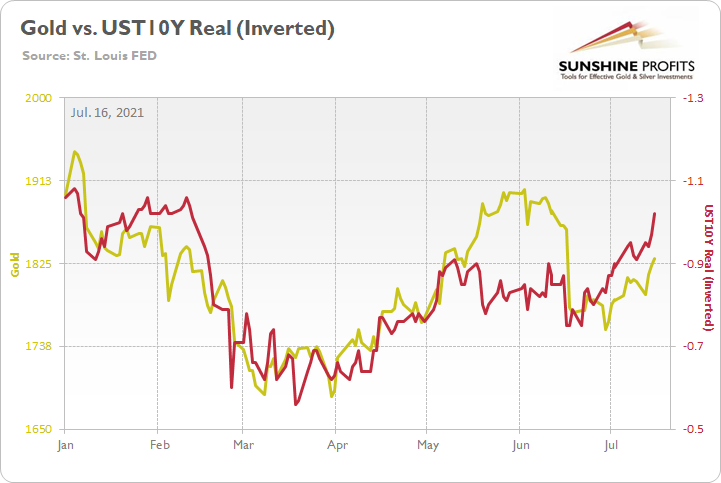
To explain, the gold line above tracks the London Bullion Market Association (LBMA) Gold Price, while the red line above tracks the inverted U.S. 10-Year real yield. For context, inverted means that the latter’s scale is flipped upside down and that a rising red line represents a falling U.S. 10-Year real yield, while a falling red line represents a rising U.S. 10-Year real yield.
If you analyze the relationship, you can see that one’s pain is often the other one’s gain. And if you focus your attention on the right side of the chart, you can see that the U.S. 10-Year real yield’s recent malaise has uplifted the yellow metal.
Despite that, while Powell and Yellen continue to make excuses for their lack of foresight, Powell actually told Congress on Jul. 15 that surging inflation caught ‘everyone’ by surprise.
Please see below:
 Source: CNBC
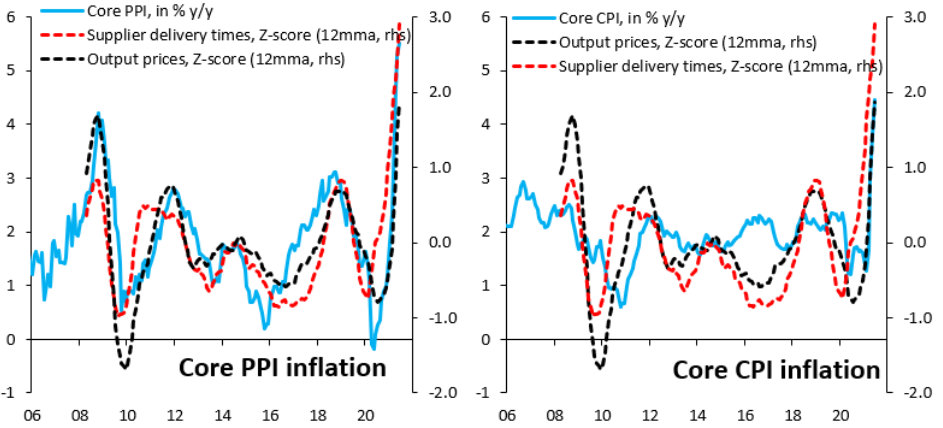
However, while I’ve been warning for months that inflation was likely to boil, both policymakers are underestimating the lasting effects. And in the process, bond investors have buried their heads in the sand. Conversely, while “temporary” and “transitory” remain Powell’s favorite buzzwords, supply chain disruptions still haven’t fully filtered into the core Consumer Price Index (CPI).
Please see below:
 Source: Robin Brooks/Institute of International Finance (IIF)
To explain, the chart on the left depicts the effect of supplier delivery times on the core Producer Price Index (PPI). If you analyze the relationship, you can see that the red and light blue lines are roughly three standard deviations above their historical average (follow the scales on the right side of both charts). Conversely, if you analyze the chart on the right, you can see that the core CPI (the light blue line) is still less than two standard deviations above its historical average. As a result, the core CPI still hasn’t felt the brunt of the inflationary surge.
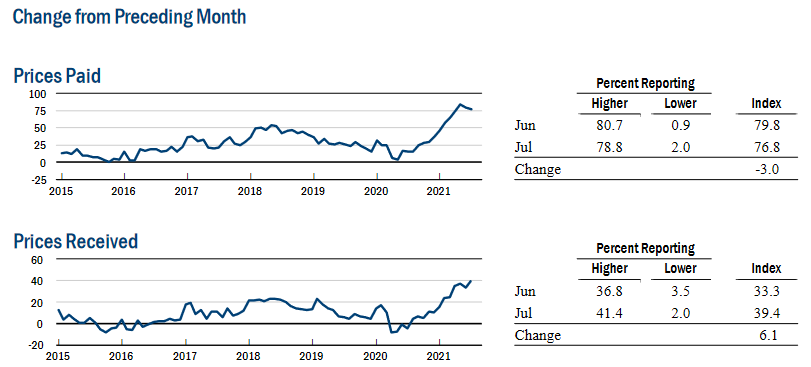
What’s more, the New York FED released its Empire State Manufacturing Survey on Jul. 15. And with one header reading “Selling Prices Increase at Record-Setting Pace,” cost-push inflation remains alive and well.
Please see below:
 Source: NY FED
In addition, New York’s’ manufacturing sector expanded rapidly and supply chain disruptions (delivery times) remain an issue. An excerpt from the report read:
“Business activity grew at a record-setting pace in New York State, The headline general business conditions index shot up twenty-six points to 43.0. New orders and shipments increased robustly. Delivery times continued to lengthen substantially, and inventories expanded. Employment grew strongly, and the average workweek increased. Input prices continued to increase sharply, and selling prices rose at the fastest pace on record. Looking ahead, firms remained optimistic that conditions would improve over the next six months, with the index for future employment reaching another record high.”
Turning to the second major player in gold’s bearish forecast, the USD Index is hitting its stride. And as sentiment shifts, the U.S. dollar is gaining significant support from speculators.
Please see below:
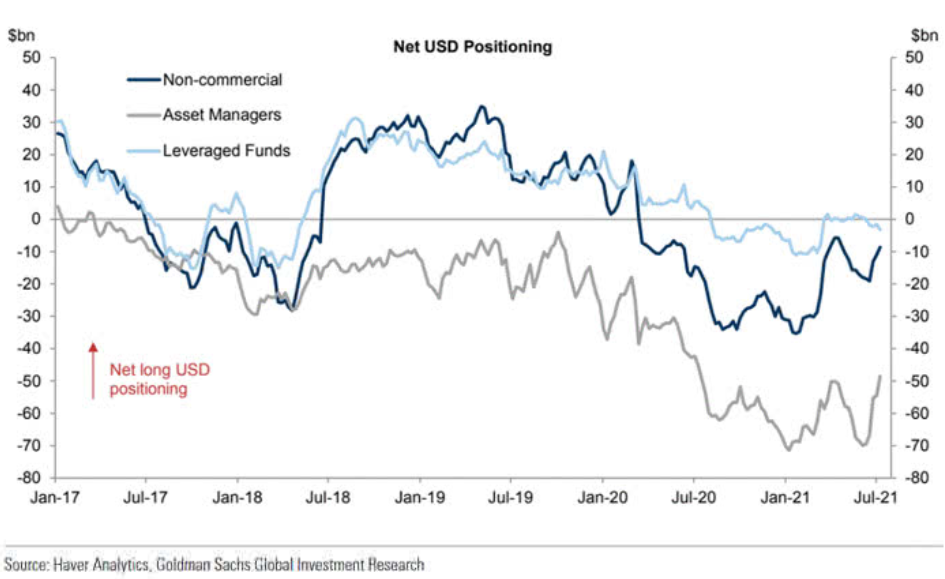
To explain, the dark blue, gray and light blue lines above represent net-long positions of non-commercial (speculative) futures traders, asset managers and leveraged funds. When the lines are falling, it means that the trio have reduced their net-long positions and are expecting a weaker U.S. dollar. Conversely, when the lines are rising, it means that the trio have increased their net-long positions and are expecting a stronger U.S. dollar. And if you analyze the right side of the chart, you can see that non-commercial futures traders and asset managers have completely changed their tune (though leveraged funds’ movement has been minimal).
On top of that, the latest USD Outlook from Vanda Research offers an interesting take on the FED’s forthcoming taper. Predicting that a ‘buy the rumor, sell the news’ event will unfold over the next several weeks, the firm believes that speculators will likely front-run the expected announcement.
Please see below:
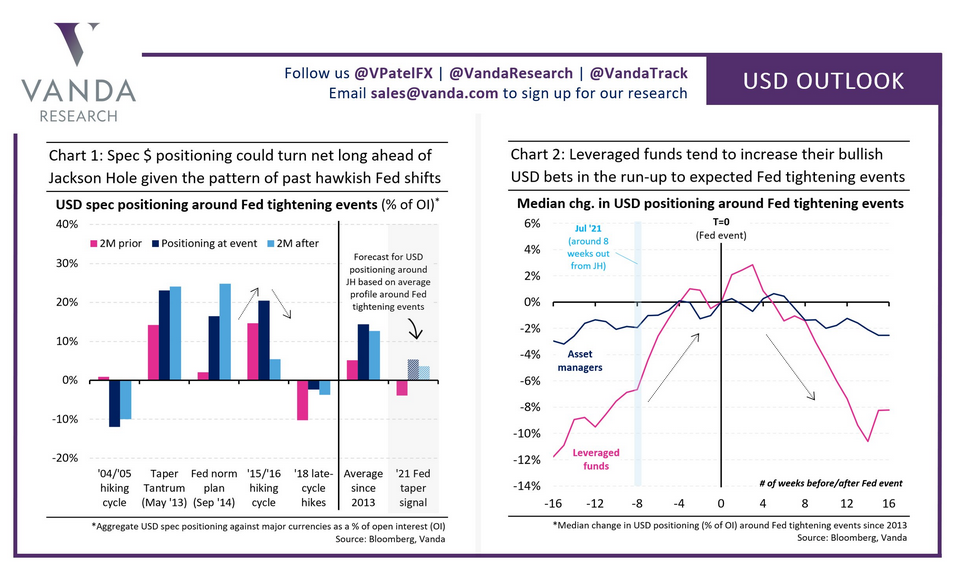
To explain, if you analyze the first chart on the left, the pink bars (two months before), the dark blue bars (actual event) and the light blue bars (two months after) depict speculators’ USD positioning before, during and after hawkish FED announcements. And if you analyze the relationship, more often than not, speculators buy the U.S. dollar in anticipation, hold throughout the event and then bail after the drama unfolds. As further evidence, if you turn to the chart on the right, you can see that leveraged funds are notorious for front-running the FED’s actions. With eight weeks preceding major FED events often resulting in significant increases in net-long positioning, leveraged funds aim to strike while the iron is hot. The bottom line? With the Jackson Hole Economic Policy Symposium scheduled for Aug. 26-28 (roughly six weeks away), another front-run could already be underway.
Finally, while I’ve been warning for some time that the FED’s daily reverse repurchase agreements are the fundamental equivalent of a shadow taper (though, it doesn’t have the same psychological effect), the FED sold $776.261 billion worth of reverse repos on Jul. 15 and $859.975 billion worth of reverse repos on Jul. 14. More importantly, though, with the U.S. 10-Year Treasury yield often moving inversely of the FED’s international reverse repos, bond investors are behaving as if the taper is already underway.
Please see below:
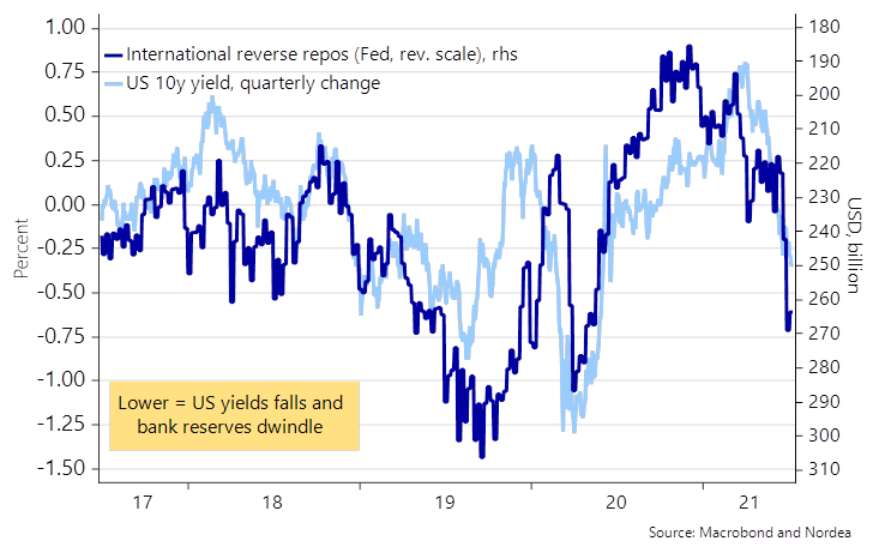
To explain, the dark blue line above tracks the quarterly percentage change in the U.S. 10-Year Treasury yield, while the light blue line above tracks the FED’s inverted (scale flipped upside down) international reverse repos. If you analyze the relationship, you can see that the larger the liquidity drain, the more bond investors position for slower growth, lower inflation and a hawkish FED.
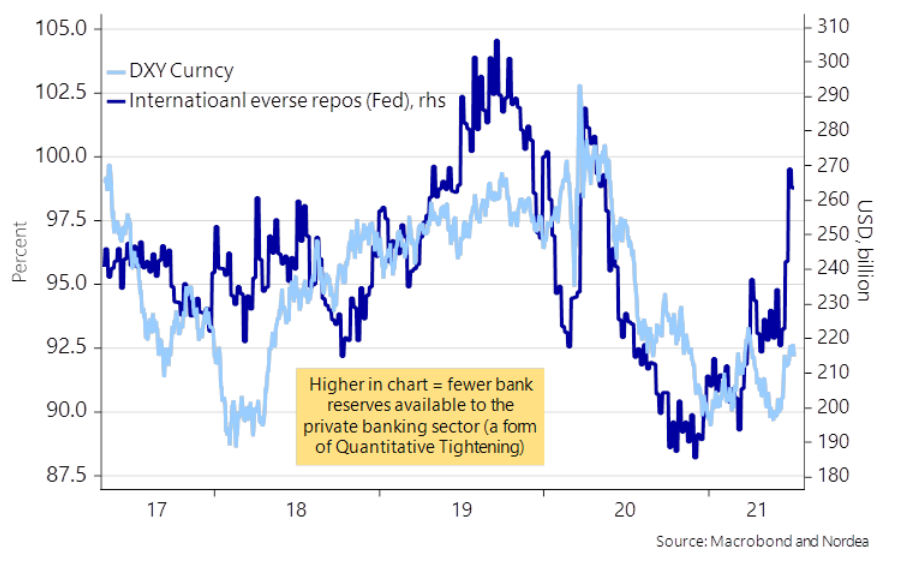
Conversely, the dynamic has the opposite effect on the USD Index. With U.S. dollars being siphoned out of the system, it’s akin to the FED reducing its QE program. As such, the liquidity drain (lower supply of dollars) is extremely bullish for the greenback.
In conclusion, while the PMs have been buoyed by falling real yields, their relative performance has been extremely subdued. From March through May, gold rallied sharply once the U.S. 10-Year real yield reversed course. This time around, however, the bounce has been tepid, as concerns over a prospective taper counters the bullish optimism. As a result, with the USD Index gaining steam, inflation surging and a taper announcement likely to commence in September, the PMs’ optimism could evaporate at the drop of a dime. Thus, it’s prudent to avoid reading too much into their recent strength.
Overview of the Upcoming Part of the Decline
- The barely visible corrective upswing in gold might already be over, and another huge decline is likely just around the corner.
- After miners slide in a meaningful and volatile way, but silver doesn’t (and it just declines moderately), I plan to switch from short positions in miners to short positions in silver. At this time, it’s too early to say at what price levels this would take place – perhaps with gold close to $1,600. I plan to exit those short positions when gold shows substantial strength relative to the USD Index, while the latter is still rallying. This might take place with gold close to $1,350 - $1,500 and the entire decline (from above $1,900 to about $1,475) would be likely to take place within 6-20 weeks, and I would expect silver to fall the hardest in the final part of the move. This moment (when gold performs very strongly against the rallying USD and miners are strong relative to gold – after gold has already declined substantially) is likely to be the best entry point for long-term investments, in my view. This might also happen with gold close to $1,475, but it’s too early to say with certainty at this time.
- As a confirmation for the above, I will use the (upcoming or perhaps we have already seen it?) top in the general stock market as the starting point for the three-month countdown. The reason is that after the 1929 top, gold miners declined for about three months after the general stock market started to slide. We also saw some confirmations of this theory based on the analogy to 2008. All in all, the precious metals sector would be likely to bottom about three months after the general stock market tops.
- The above is based on the information available today, and it might change in the following days/weeks.
Please note that the above timing details are relatively broad and “for general overview only” – so that you know more or less what I think and how volatile I think the moves are likely to be – on an approximate basis. These time targets are not binding or clear enough for me to think that they should be used for purchasing options, warrants or similar instruments.
Letters from Subscribers
Q: What do you make of the market reaction (gold particularly) to the higher than expected PPI figure?
Shouldn’t it go down instead?
A: In short, it’s quite complex. Theoretically, higher inflation numbers should be bullish for gold, which is the long-term inflation hedge, known for its ability to retain value over centuries. On the other hand, higher inflation numbers imply higher interest rates sooner or later, which would be bearish for gold. It seems to me that the gold market has already priced-in the inflationary effects, but not necessarily the rise in the interest rates. Consequently, whatever “reminds” the market about the upcoming increases in the interest rates could trigger declines in gold.
But.
Gold is priced in the U.S. dollar, which means that if gold was to retain its value in terms of other currencies, it should move in the opposite direction to the USD Index. And on Wednesday, when the PPI numbers were released, the USD Index moved visibly lower. Consequently, it was natural for gold to move higher. Its reaction could be explained by the above mechanism without any other implications. If gold continues to rally regardless of what the USD Index is doing, and regardless of the inflation-related statistics, we’ll know that a rally is just around the corner. Right now, what we saw continues to look like a prolonged breather within a much bigger move lower.
Q: Some of us are not able to buy USA-listed ETFs due to EU regulations, so there is an EU-listed UCITS alternative, G2XJ in Deutche Borse.
Can you provide the targets in EUR? Is it a simple conversion based on today’s EUR/USD rate?
I have short positions in Gold XAUUSD. Should I expect a decline from these levels (1820) or should I exit and short the ETFs?
A: The near-term target (analogous to the targets that we have for the GDXJ and the JDST) for the G2XJ would be about $26.5 (if I were going to use this instrument, I’d place the profit-take level at about $27.1 to increase the chance of the trade being realized). I’m not basing it on the EUR/USD exchange rate, but rather on the technical picture for the G2XJ itself and the likelihood of it completing its head and shoulders pattern, just as the GDX and GDXJ are likely to complete it shortly.
The last question assumes (based on the “or” word) that there’s an alternative between both parts of the sentence, but it seems to me that both are actually true. In other words, I do expect gold to decline from these levels ($1,820) based, i.a. on the 50% Fibonacci retracement that was just reached, and at the same time I prefer to profit from the decline in the junior mining stocks rather than to profit from the decline in gold. It simply seems to me that based on miners’ recent (and likely) underperformance, the corrective upswings in miners are likely to be smaller than the ones in gold, and the declines are likely to be bigger in the case of the miners than the ones in gold. Therefore, it seems to me that the risk-to-reward ratio for shorting miners is more favorable than the one for shorting gold. I do think that both approaches will end up profitable in the following weeks.
I can’t tell you what you should do with your current trade in gold, as I don’t know what other things you consider when making trades, what your risk tolerance is, etc., and also because I can’t provide specific investment advice. I hope you’ll find my above comments useful though.
Summary
To summarize, even though gold could still move somewhat higher in the near term, it seems that having a short position in the junior mining stocks is much more justified from the risk-to-reward point of view than having a long one in any part of the precious metals market. Gold miners’ exceptional underperformance along with the inverse head-and-shoulders pattern in the USD Index make the bearish outlook justified from the risk-to-reward point of view.
Due to the increased clarity regarding the likely next interim bottom in gold (previous 2021 lows) and mining stocks (below their previous 2021 lows), the profit-take levels on our current short position are not pointing to the final bottom, but to the likely interim one. This does not imply that the entire decline is going to be smaller than first believed. It’s simply a consequence of the short-term target becoming more crystallized.
After the sell-off (that takes gold to about $1,350 - $1,500), I expect the precious metals to rally significantly. The final part of the decline might take as little as 1-5 weeks, so it's important to stay alert to any changes.
Most importantly, please stay healthy and safe. We made a lot of money last March and this March, and it seems that we’re about to make much more on the upcoming decline, but you have to be healthy to enjoy the results.
As always, we'll keep you - our subscribers - informed.
By the way, we’re currently providing you with a possibility to extend your subscription by a year, two years or even three years with a special 20% discount. This discount can be applied right away, without the need to wait for your next renewal – if you choose to secure your premium access and complete the payment upfront. The boring time in the PMs is definitely over and the time to pay close attention to the market is here. Naturally, it’s your capital, and the choice is up to you, but it seems that it might be a good idea to secure more premium access now, while saving 20% at the same time. Our support team will be happy to assist you in the above-described upgrade at preferential terms – if you’d like to proceed, please contact us.
To summarize:
Trading capital (supplementary part of the portfolio; our opinion): Full speculative short positions (300% of the full position) in mining stocks are justified from the risk to reward point of view with the following binding exit profit-take price levels:
Mining stocks (price levels for the GDXJ ETF): binding profit-take exit price: $37.12; stop-loss: none (the volatility is too big to justify a stop-loss order in case of this particular trade)
Alternatively, if one seeks leverage, we’re providing the binding profit-take levels for the JDST (2x leveraged) and GDXD (3x leveraged – which is not suggested for most traders/investors due to the significant leverage). The binding profit-take level for the JDST: $15.96; stop-loss for the JDST: none (the volatility is too big to justify a SL order in case of this particular trade); binding profit-take level for the GDXD: $37.02; stop-loss for the GDXD: none (the volatility is too big to justify a SL order in case of this particular trade).
For-your-information targets (our opinion; we continue to think that mining stocks are the preferred way of taking advantage of the upcoming price move, but if for whatever reason one wants / has to use silver or gold for this trade, we are providing the details anyway.):
Silver futures upside profit-take exit price: unclear at this time - initially, it might be a good idea to exit, when gold moves to $1,683
Gold futures upside profit-take exit price: $1,683
HGD.TO – alternative (Canadian) inverse 2x leveraged gold stocks ETF – the upside profit-take exit price: $12.88
Long-term capital (core part of the portfolio; our opinion): No positions (in other words: cash
Insurance capital (core part of the portfolio; our opinion): Full position
Whether you already subscribed or not, we encourage you to find out how to make the most of our alerts and read our replies to the most common alert-and-gold-trading-related-questions.
Please note that we describe the situation for the day that the alert is posted in the trading section. In other words, if we are writing about a speculative position, it means that it is up-to-date on the day it was posted. We are also featuring the initial target prices to decide whether keeping a position on a given day is in tune with your approach (some moves are too small for medium-term traders, and some might appear too big for day-traders).
Additionally, you might want to read why our stop-loss orders are usually relatively far from the current price.
Please note that a full position doesn't mean using all of the capital for a given trade. You will find details on our thoughts on gold portfolio structuring in the Key Insights section on our website.
As a reminder - "initial target price" means exactly that - an "initial" one. It's not a price level at which we suggest closing positions. If this becomes the case (like it did in the previous trade), we will refer to these levels as levels of exit orders (exactly as we've done previously). Stop-loss levels, however, are naturally not "initial", but something that, in our opinion, might be entered as an order.
Since it is impossible to synchronize target prices and stop-loss levels for all the ETFs and ETNs with the main markets that we provide these levels for (gold, silver and mining stocks - the GDX ETF), the stop-loss levels and target prices for other ETNs and ETF (among other: UGL, GLL, AGQ, ZSL, NUGT, DUST, JNUG, JDST) are provided as supplementary, and not as "final". This means that if a stop-loss or a target level is reached for any of the "additional instruments" (GLL for instance), but not for the "main instrument" (gold in this case), we will view positions in both gold and GLL as still open and the stop-loss for GLL would have to be moved lower. On the other hand, if gold moves to a stop-loss level but GLL doesn't, then we will view both positions (in gold and GLL) as closed. In other words, since it's not possible to be 100% certain that each related instrument moves to a given level when the underlying instrument does, we can't provide levels that would be binding. The levels that we do provide are our best estimate of the levels that will correspond to the levels in the underlying assets, but it will be the underlying assets that one will need to focus on regarding the signs pointing to closing a given position or keeping it open. We might adjust the levels in the "additional instruments" without adjusting the levels in the "main instruments", which will simply mean that we have improved our estimation of these levels, not that we changed our outlook on the markets. We are already working on a tool that would update these levels daily for the most popular ETFs, ETNs and individual mining stocks.
Our preferred ways to invest in and to trade gold along with the reasoning can be found in the how to buy gold section. Furthermore, our preferred ETFs and ETNs can be found in our Gold & Silver ETF Ranking.
As a reminder, Gold & Silver Trading Alerts are posted before or on each trading day (we usually post them before the opening bell, but we don't promise doing that each day). If there's anything urgent, we will send you an additional small alert before posting the main one.
Thank you.
Przemyslaw Radomski, CFA
Founder, Editor-in-chief

