

Briefly: in our opinion, full (300% of the regular position size) speculative short positions in junior mining stocks are justified from the risk/reward point of view at the moment of publishing this Alert. Moreover, while I see very little chance of those levels behind hit, I’m adding stop-loss orders for our current short positions. Since I’m placing them below the entry levels, they are effectively profit-protect orders. In other words, we are locking-in part of the profits, while letting them grow even more.
Welcome to this week's flagship Gold & Silver Trading Alert. Predicated on last week’s price moves, our most recently featured outlook remains the same as the price moves align with our expectations. On that account, there are parts of the previous analysis that didn’t change at all in the earlier days, which will be written in italics.
The key and good news about this week is that our short position in junior miners got even more profitable this week as the GDXJ is down by over 5% and the JDST is up by almost 10%. Will profits grow even further? That’s likely.
Let’s start today’s analysis with a recap of what recently happened on the fundamental front.
The Weekly Fundamental Roundup
While recession fears keep investors on edge, the short week was all about holiday cheer. Moreover, with risk-on sentiment intensifying on Jul. 7, an optimistic S&P 500 helped uplift the GDXJ ETF. However, the latter has been a drastic underperformer over the last week and month, and while the S&P 500 may have some short-term upside, don’t let the seasonally bullish period distract you from the deteriorating medium-term fundamental outlook.
For example, July is often a strong month for the general stock market. Specifically, the first two weeks of July often exude optimism.
Please see below:
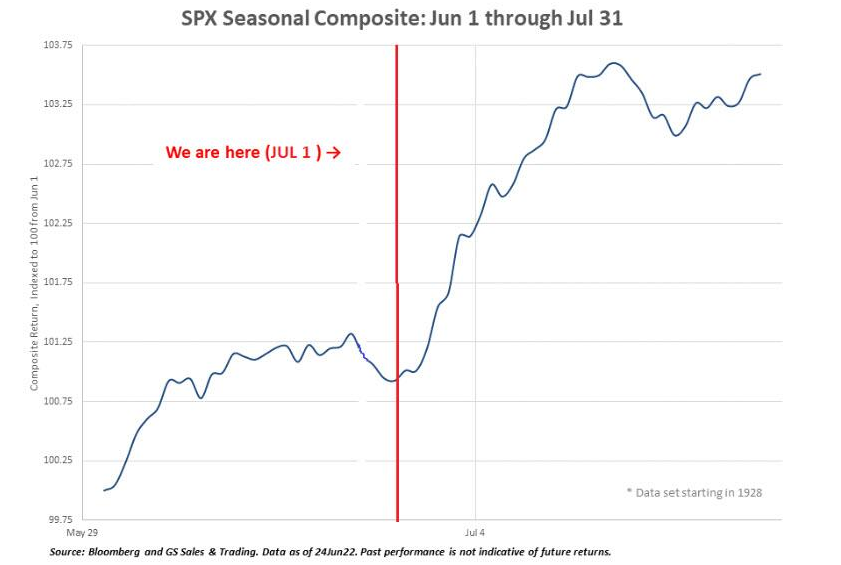
To explain, Goldman Sachs flow trader Scott Rubner noted that "1H July is the best period from now until July 17." Thus, while the bulls may attempt to push the relief rally to the limit, the subsequent rush for the exit should have negative consequences for the PMs.
To that point, I've noted on numerous occasions that the Cboe Volatility Index (VIX) – which measures stock market volatility – has been relatively dormant despite the S&P 500's large intraday price swings. For context, I wrote on May 20:
While Fed officials realize that inflation will only subside if commodity and stock prices fall, a near 20% peak-to-trough decline in the S&P 500 still hasn’t spooked market participants. Moreover, while some claim that sentiment is extremely bearish on Wall Street, the reality is that no one fears the Fed.
Please see below:
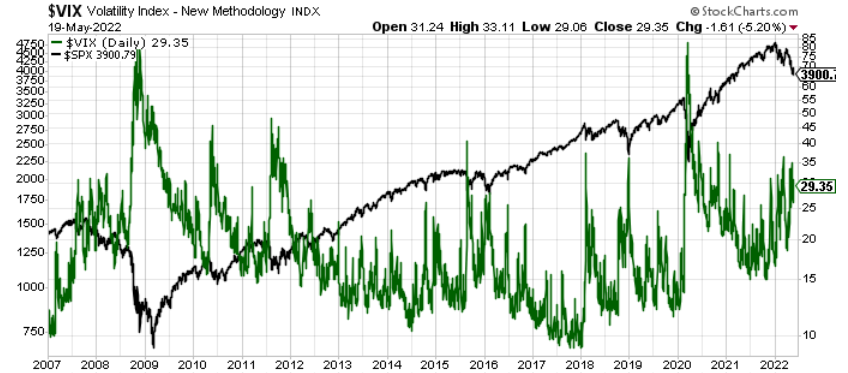
To explain, the black line above tracks the S&P 500, while the green line above tracks the Cboe Volatility Index (VIX). If you analyze the relationship, notice how material spikes in the VIX often mark bottoms for the S&P 500? In a nutshell: when true fear is present, investors rush to buy put options (downside hedges) at any cost, and volatility skyrockets. Therefore, panic is what often creates long-term bottoms.
Thus, while the S&P 500 closed near its May 19 value, the VIX ended the day lower. As a result, while the FX and bond markets are on edge, we’re likely far from a VIX level that supports a medium-term bottom for the S&P 500.
Please see below:
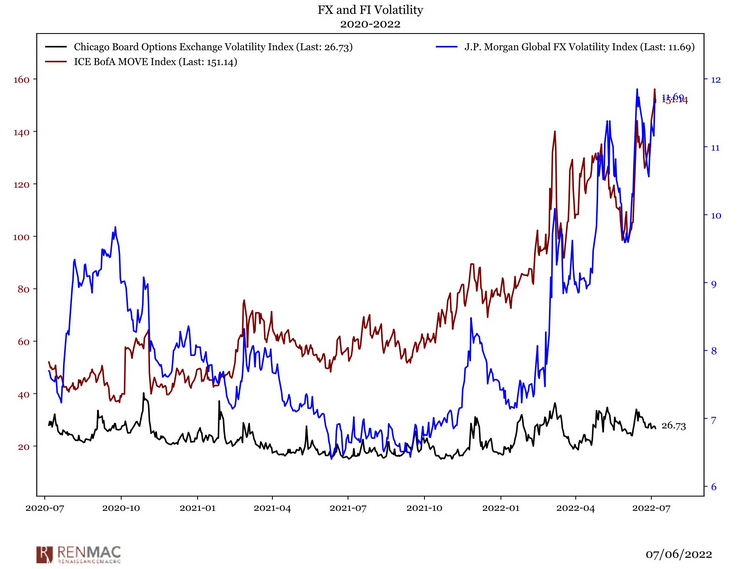
To explain, the blue line above tracks J.P. Morgan’s Global FX Volatility Index (currency volatility), while the brown line above tracks the ICE Bank of America MOVE Index (bond volatility). If you analyze the right side of the chart, you can see that currency and fixed income traders are braced for massive tremors.
Conversely, the black line above tracks the VIX, and stock market volatility has declined even as panic erupts across other asset classes. Thus, either the former needs to rise or the latter needs to fall. However, with the Fed on a hawkish warpath to tame inflation and a recession likely on the horizon, stock market bulls are on the wrong side of history.
To that point, while owning the VIX has been a terrible hedge against the S&P 500’s declines in 2022 – since it’s not rising a lot when the S&P 500 falls – market participants expect this to change in the months ahead.
Please see below:
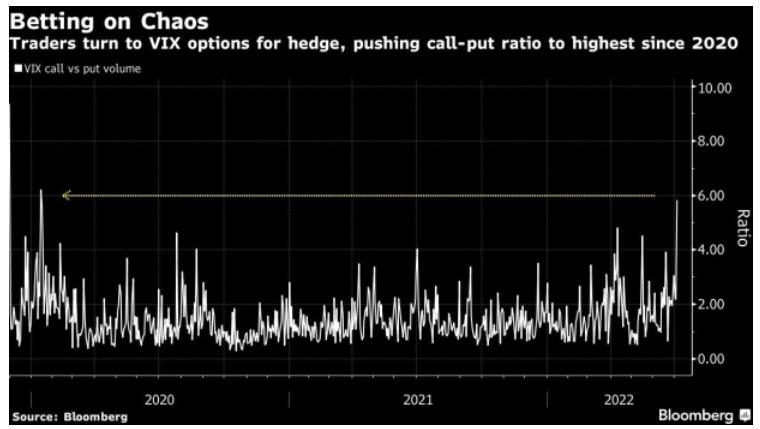
To explain, the white line above tracks the VIX call-put ratio. When the white line rises, it means that more calls than puts have been purchased, and investors expect the VIX to increase. Bloomberg noted:
"Before this month, there were signs that professional investors were shunning equity options and instead flocking to stock futures to hedge positions. Now, demand for options appears to be back. More than 440,000 VIX calls changed hands Wednesday, outpacing puts by a margin of 5.8-to-1. That's the highest reading since January 2020."
Thus, with a major disconnect between bond/FX and stock market volatility on display, the recent option activity by "professional investors" rivals the run-up to the COVID-19 crash. As such, while this bear market should take much longer to unfold, the important point is that the S&P 500 will likely break down over the medium term.
Fed Hawks
While the release of the Fed minutes on Jul. 6 outlined the monetary policy framework that should unfold in the months ahead, Fed Governor Christopher Waller reiterated those hawkish points on Jul. 7. He said:
"I am definitely in support a doing another 75 basis point hike in July. Probably 50 in September, and then after that we can debate whether to go back down to 25s or if inflation just doesn't seem to be going down, we have to do more."
As a result, while his second point of “we can debate whether to go back down to 25s” after September passes for dovish news these days, the reality is that hawkish fireworks are on the horizon.
Please see below:
 Source: Bloomberg
Likewise, St. Louis Fed President James Bullard said on Jul. 7:
“I think it would make a lot of sense to go with the 75 at this juncture. I’ve advocated and continue to advocate getting to 3.5% this year, then we can see where we are and see how inflation’s developing at that point.”
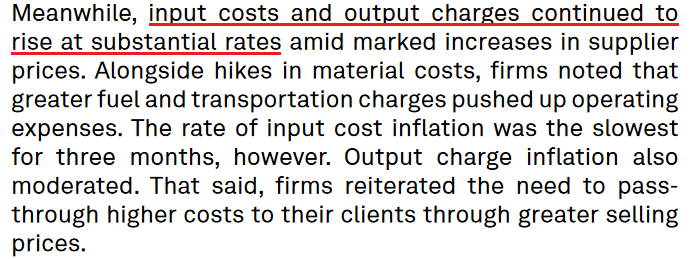
Thus, while the recent collapse in commodity prices should help ease the inflation burden, it’s a long way from 8%+ to 2%. Furthermore, I noted on Jul. 5 that S&P Global’s U.S. Manufacturing PMI signaled substantial inflation pressures in June.
Please see below:
 Source: S&P Global
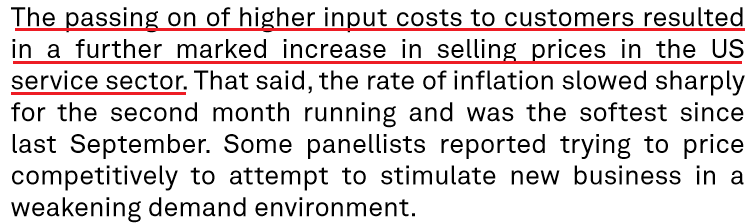
In addition, S&P Global released its U.S. Services PMI on Jul. 6. The report revealed:
“Steep price pressures were recorded again in June. The rate of input cost inflation slowed from May's survey record, but was still among the fastest since the series began in October 2009.”
As a result, while the survey highlighted a “weakening demand environment,” output inflation is still rising and moving further away from the Fed’s 2% target.
 Source: S&P Global
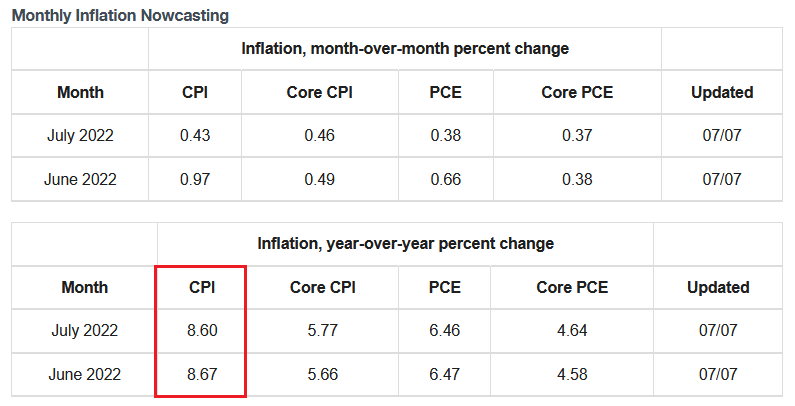
On top of that, the Cleveland Fed’s inflation “Nowcast” has the headline Consumer Price Index (CPI) hitting a new 2022 high of 8.67% year-over-year (YoY) in June and barely declining to 8.60% YoY in July.
Please see below:
 Source: Cleveland Fed
As a result, while six rate hikes (25 basis point increments) have sparked varying degrees of carnage on Wall Street, they've done little to alleviate inflation's reign. That's why I warned that 'peak CPI' is irrelevant. What matters is the duration of rate hikes and how the Fed's long battle with inflation should result in a recession along the way.
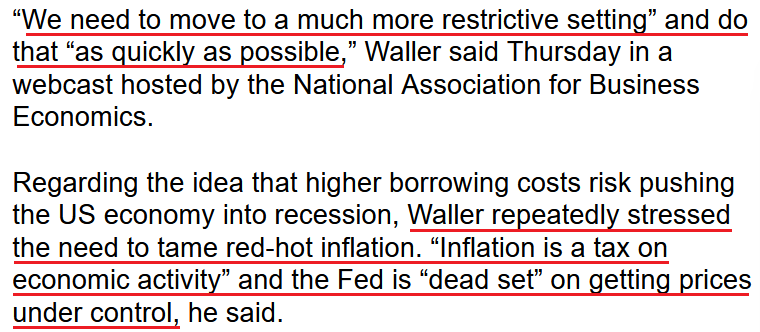
However, Waller and Bullard both claimed on Jul. 7 that recession fears are exaggerated. Waller said:
"I personally think some of the fears of a recession are overblown. We're going to get inflation down. That means we are going to be aggressive on rate hikes and we may have to take the risk of causing some economic damage, but I don't think, given how strong the labor market is right now, that that should be that much.”
Bullard added that raising interest rates to 3% or slightly higher will not send the unemployment rate (from 3.6% now) to a dramatically higher level like 6%. Therefore, while the U.S. economy should cool, “some people are mistaking that for a recession.”
Yet, despite the relatively optimistic sentiment, the reality is that unanchored inflation always causes recessions. To explain, I wrote on Jun. 1:
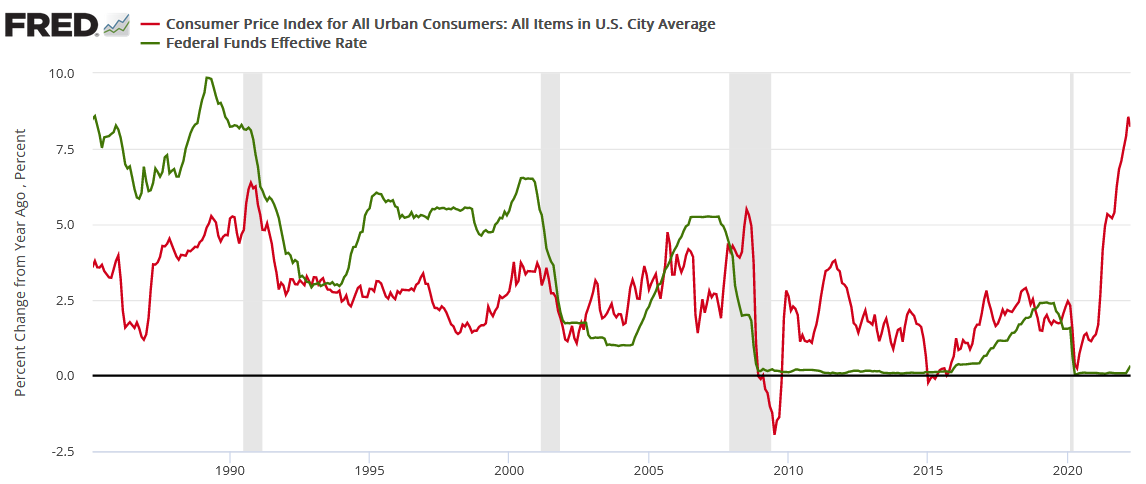
While the consensus either doesn't care or doesn't know history, unanchored inflation in the 1970s/1980s pushed the U.S. into recession four times over ~12 years (the vertical gray bars below). For context, if we exclude the COVID-19 pandemic, the U.S. has only entered a recession once in the last 20 years.
Please see below:
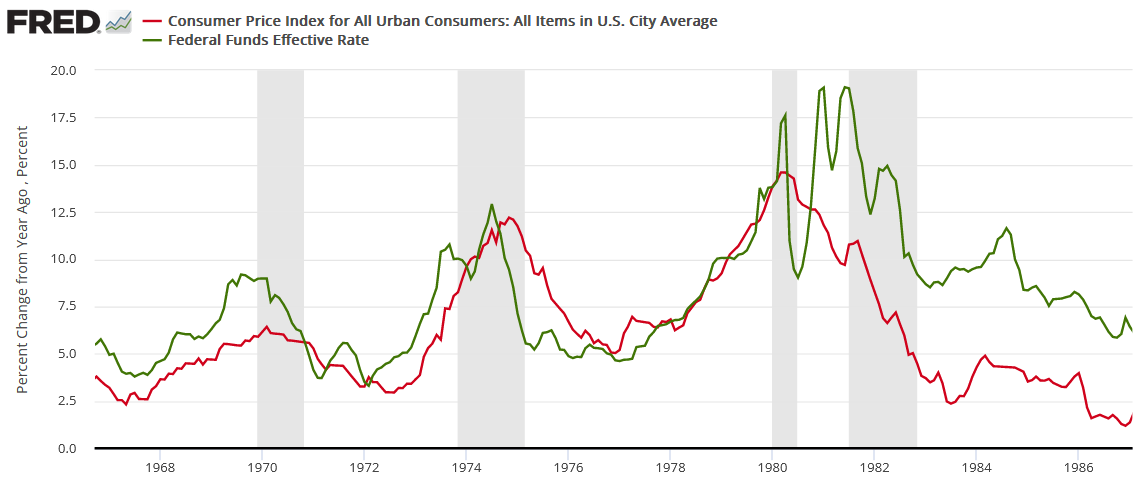
Likewise, modern history sings a similar tune. For example, the Fed has never curbed inflation without the U.S. federal funds rate eclipsing the YoY CPI rate at some point. Therefore, if the Fed pauses at 1.83% and inflation falls to its 2% target, Powell and his crew would accomplish something that’s never been done.
To that point, notice how every inflation spike leads to a higher U.S. federal funds rate and then a recession. As such, do you really think this time is different?
The Bottom Line
While seasonal forces helped uplift the S&P 500 and nearly all risky assets on Jul. 7, the fundamental issues plaguing the financial markets aren't solved with optimism. In contrast, nearly 70 years of history show that the Fed has to hammer inflation until a recession unfolds. Then, the economic slack and the collapse in asset prices alleviate the problem. Moreover, the ominous outcomes highlight why keeping inflation from reaching these levels is critical. However, that ship has already sailed, and it's nearly impossible for the Fed to pull off a soft landing.
In conclusion, the PMs rallied on Jul.7, as risky assets caught a bid. However, the U.S. 10-Year real yield increased to 0.68% and should continue its ascent over the medium term. Moreover, the USD Index closed at a new 2022 high and should also seek higher ground in the weeks and months ahead. As a result, the PMs' medium-term fundamental outlooks remain profoundly bearish.
What to Watch for Next Week
With more U.S. economic data releases next week, the most important are as follows:
- Jul. 12: NFIB Small Business Optimism Index
The NFIB's report will detail U.S. small businesses' pricing and wage policies. As a result, their actions are leading indicators of the headline CPI and, therefore, future Fed policy.
- Jul. 13: CPI, Fed Beige Book
The CPI will be highly anticipated and should move markets. However, I’ve noted many times that surveys are more important because they tell you where inflation is going, not where it’s been. However, the recent PMI data signals another high number.
In addition, the Fed’s Beige Book consolidates the findings from the regional Fed surveys. Therefore, the inflation and employment results are important.
- Jul. 14: Producer Price Index (PPI)
With the PPI often leading the headline CPI, it will be interesting to see if the recent commodity declines cooled input inflation.
- Jul. 15: Retail sales, New York Fed Empire State Manufacturing Index
Retail sales will highlight the ferocity, or lack thereof, of U.S. consumer spending, while the New York Fed’s survey will detail inflation and employment activity in New York state.
All in all, economic data releases impact the PMs because they impact monetary policy. Moreover, if we continue to see higher employment and inflation, the Fed should keep its foot on the hawkish accelerator. If that occurs, the outcome is profoundly bearish for the PMs.
Technically Speaking
Let’s start today’s technical discussion with a quick check on copper prices.
Practically, everything that I wrote about it last week (and in the previous weeks/months) remains up-to-date:
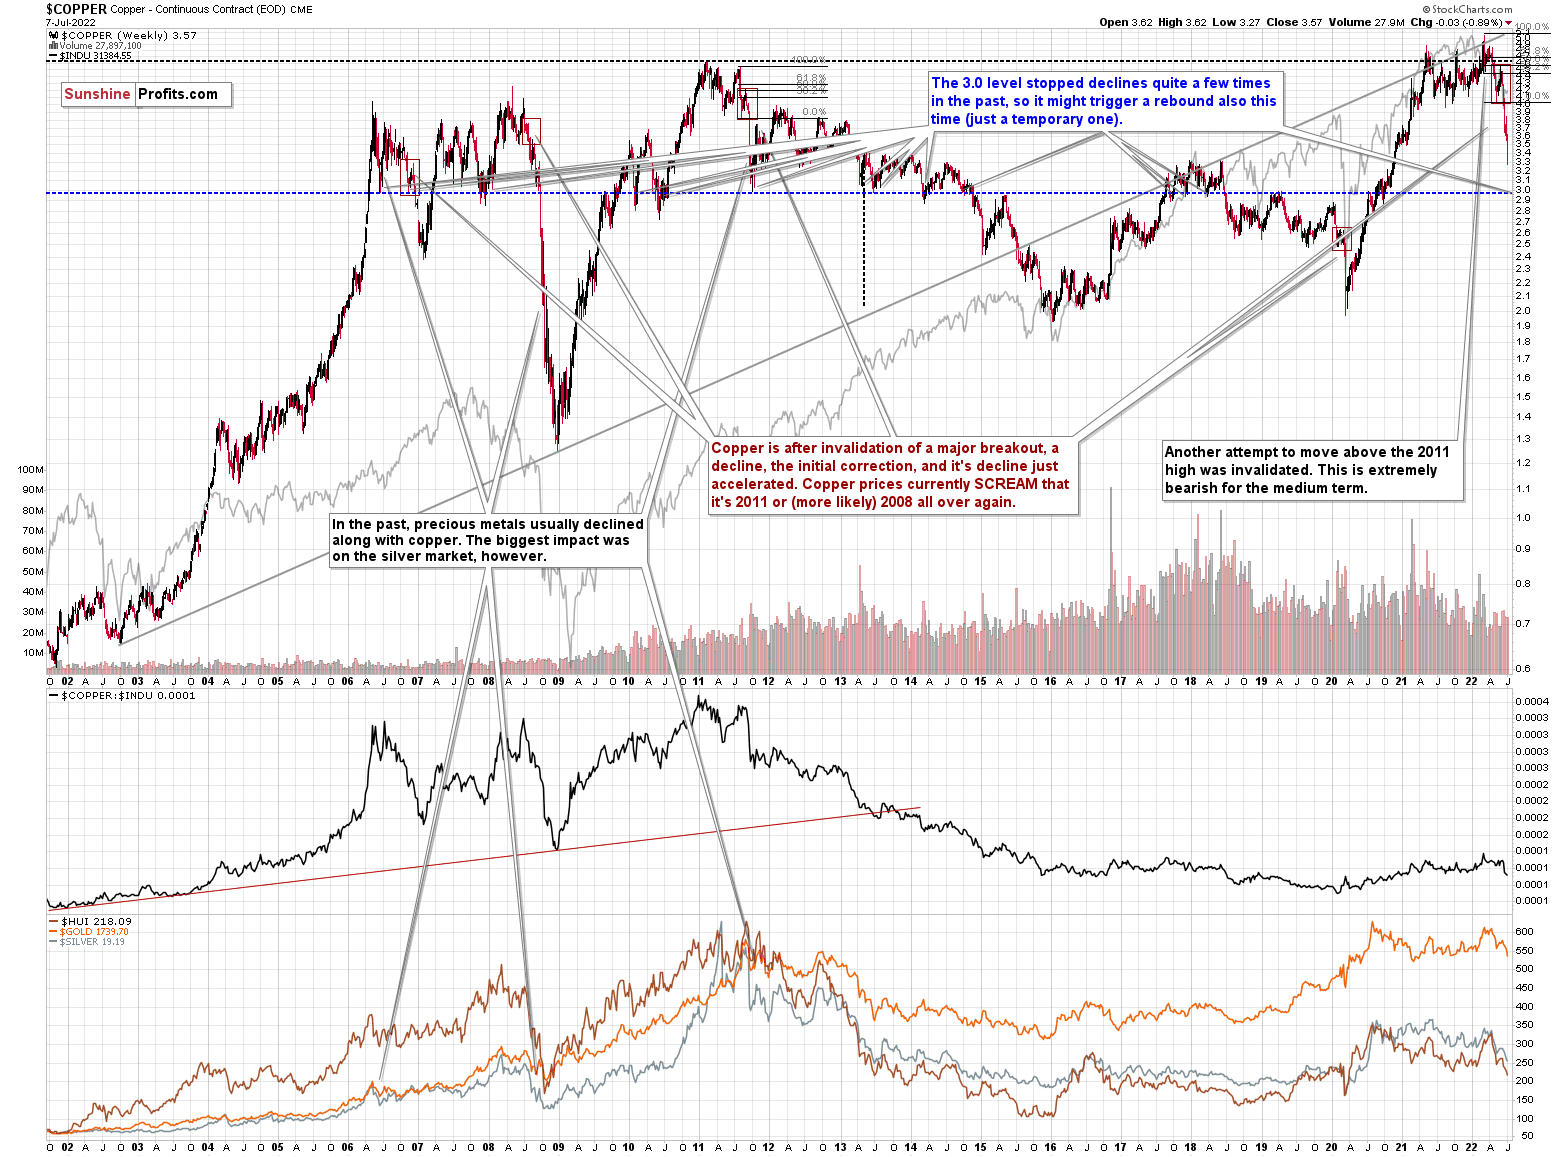
Copper recently CLEARLY invalidated another attempt to move above its 2011 high. This is a very strong technical sign that copper (one of the most popular commodities) is heading lower in the medium term.
The interest rates are going up, just like they did before the 2008 slide. What did copper do before the 2008 slide? It failed to break above the previous (2006) high, and it was the failure of the second attempt to break higher that triggered the powerful decline. What happened then? Gold declined, but silver and mining stocks truly plunged.
Again, copper is after invalidation of a major breakout, a decline, the initial correction, and its decline just accelerated. Copper prices currently SCREAM that it’s 2011 or (more likely) 2008 all over again. This is extremely bearish for mining stocks (especially juniors) and silver.
Still, as you know, no market moves up or down without corrections, and copper is no exception. The 3.0 level (and its proximity) stopped declines and triggered corrections or rallies multiple times in the past, and given how oversold (on a short-term basis) the copper market already is, it’s likely that we’ll see something similar also this time.
So, while copper might have already formed a short-term bottom, it seems that it’s likely to decline even more before correcting (and then declining much more). The medium-term implications remain bearish However, the above confirms the theory in which a short-term, corrective upswing might be just around the corner.
Consequently, what we saw recently is just a confirmation of the bearish analogy.
Having said that, let’s check junior miners’ really big picture.
I previously commented on the above chart in the following way:
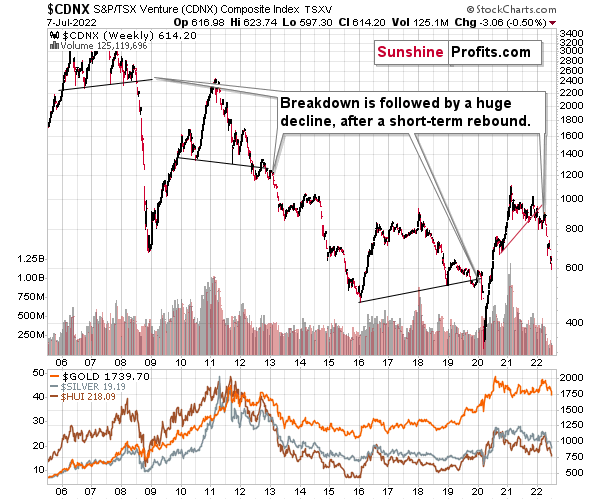
The Toronto Stock Exchange Venture Index includes multiple junior mining stocks. It also includes other companies, but juniors are a large part of it, and they truly plunged in 2008.
In fact, they plunged in a major way after breaking below their medium-term support lines and after an initial corrective upswing. Guess what – this index is after a major medium-term breakdown and a short-term corrective upswing. It’s likely ready to fall – and to fall hard.
So, what’s likely to happen? We’re about to see a huge slide, even if we don’t see it within the next few days.
The index corrected just like the PMs, but it didn’t change anything with regard to the medium term.
What has happened recently?
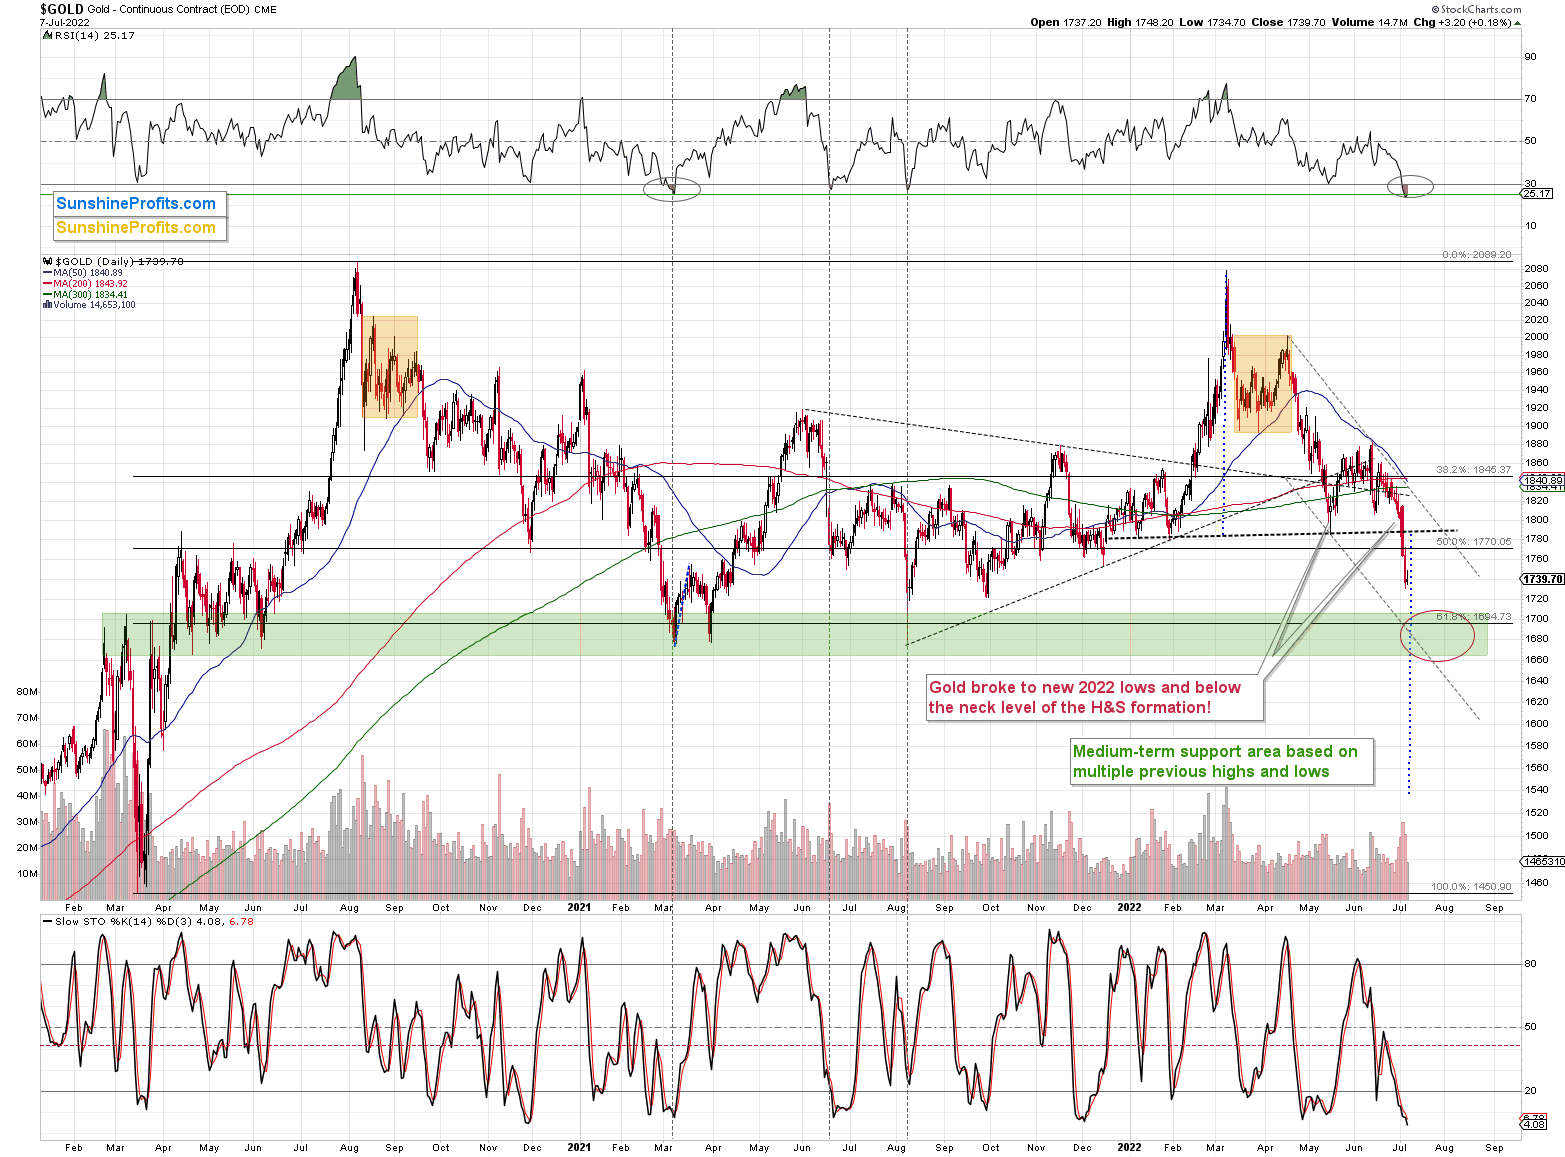
Gold just moved below the neck level of the previous head and shoulders pattern and also to new 2022 lows. The breakdown took place at a high volume, so it appears believable.
However, at the same time, the RSI moved below 30, which is a classic buy signal. I marked the previous similar signals with vertical dashed lines. In all three previous cases, gold was either bottoming or about to bottom.
In particular, the early-2021 situation appears similar because the preceding price action is also similar. The failed attempt to rally above $2,000, the consolidation (marked with orange rectangles), and the subsequent decline that also included a consolidation are all present in both cases.
Back in 2021, gold continued to decline until it moved below $1,700, and while it doesn’t guarantee the same thing right now, the fact that both declines started from highs at very similar price levels makes it quite likely.
So, what’s likely to happen next? Well, I see two likely short-term outcomes:
- Gold corrects a bit, thus verifying the breakdown below the neck level of the H&S formation and the previous 2022 low, and it then continues to decline after the correction.
- Gold slides to or slightly below $1,700 right away - or almost right away, but quite possibly this week.
In the case of scenario 1, junior miners would be likely to correct slightly as well, and then slide.
In the case of scenario 2, junior miners would be likely to slide right away, possibly showing some kind of strength right before gold moves to its $1,700 target.
In both cases, I plan to keep the short positions intact until GDXJ or gold reaches its targets lower – I don’t plan to trade the rebound from scenario 1. Not all moves are worth trading, just like you’ll probably agree that last Friday’s (Jul 1) daily rally wasn’t worth trading.
So far, scenario #2 is being realized. Yesterday, gold didn’t look back, and it declined sharply right away. It’s trading at about $1,740, so another ~$40-$60 decline would take it right into my target area.
It’s very likely that if gold gets there this week, we’ll then get a rebound in gold, silver, and mining stocks.
There is also a possibility that gold rebounds even before reaching this target – and that’s based on how low the RSI just moved.
The only time when the RSI was this low was at the March 2021 low, from which a quite sizable rally started. While I don’t think that the next corrective rally will be significant, I do think that it will be something visible – for example, a rally back to $1,790 or so (a correction to the previously broken neck level of the head and shoulders pattern).
Just because something is possible doesn’t make it the most likely outcome. It’s still most likely that gold will move a bit below $1,700 before bottoming. However, given how oversold on a short-term basis it is right now, it seems that gold would need to keep the bearish momentum going on an immediate-term basis if it was to slide against the mean-reversion tendency.
In other words, if gold is to slide lower soon, it likely has to do it really soon (like today or early next week) or else it might not be able to keep the momentum going, and correct instead.
Also, my previous description of the strength of the support area at/below $1,700 remains up-to-date:
Why do I think that gold would drop that low and then correct? Because that’s where we have really strong support and, consequently, if gold gets there in a fast manner (which is likely given the situation in the USD Index), it’s likely to rebound. That’s how strong support levels work.
Why would this support area be so strong? Because of two primary reasons:
- That’s where gold topped and bottomed multiple times (approximately there). This means that many people will think that gold will rally strongly once again given a similar set of circumstances and… They are likely to be right – but just for a while.
- That’s where we have the all-important 61.8% Fibonacci retracement level based on the 2020 rally. If we based this retracement on the 2020-2022 rally, it would be very close anyway.
Before looking at mining stocks, let’s take a look at gold from a broader point of view.
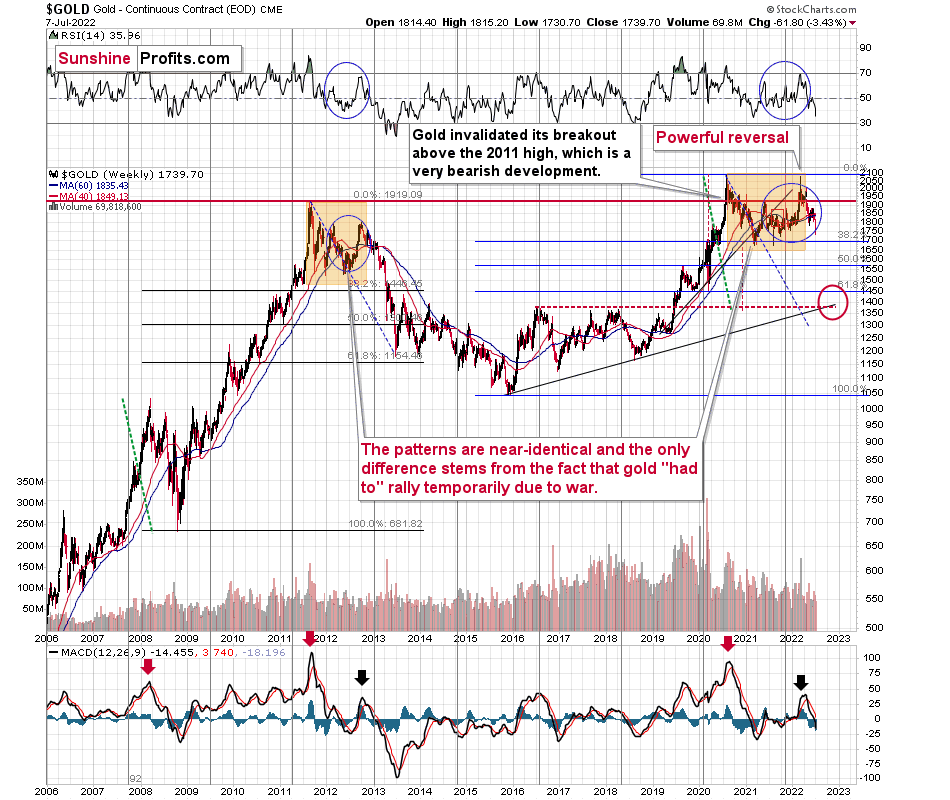
Let’s keep in mind that between 2020 and now, quite a lot happened, quite a lot of money was printed, and we saw a war breaking out in Europe. Yet, gold failed to rally to new highs.
In fact, it’s trading very close to its 2011 high, which tells you something about the strength of this market. It’s almost absent.
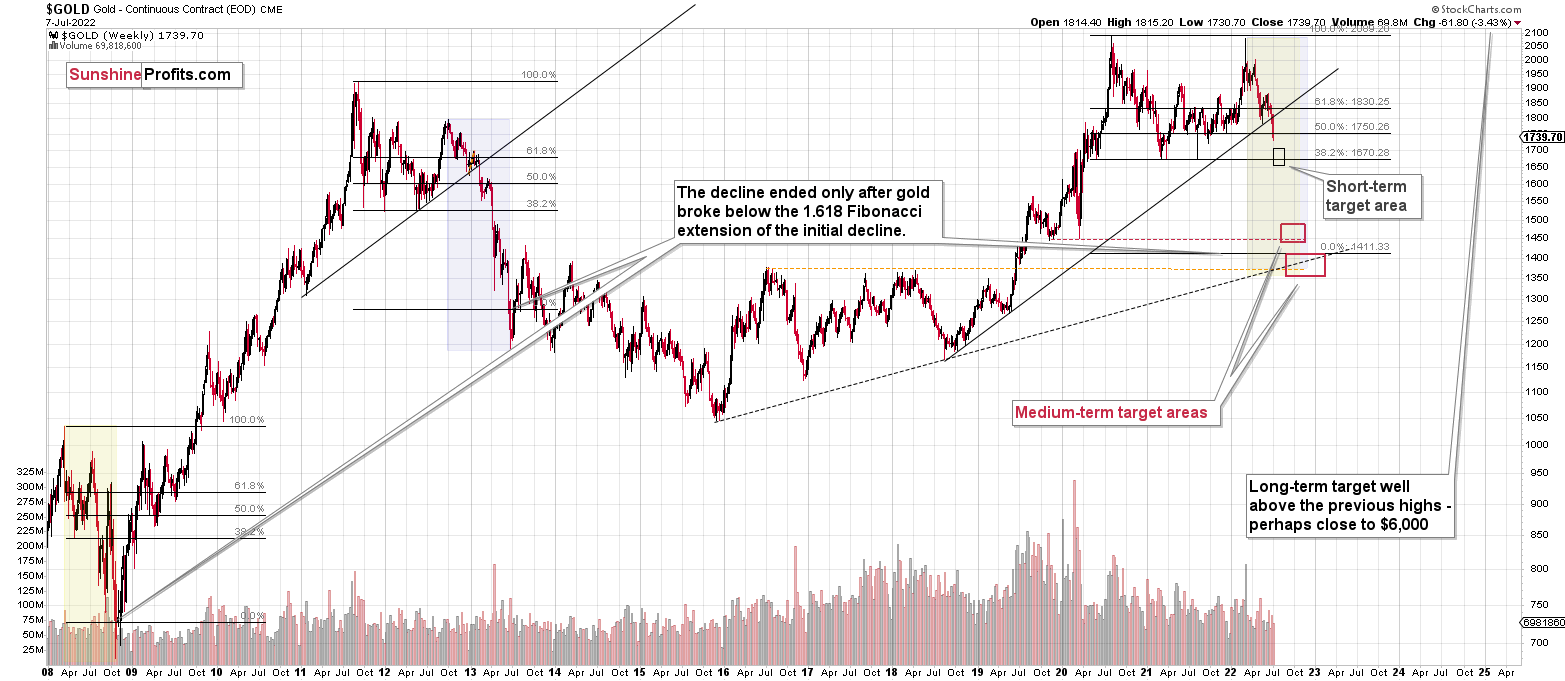
Truth be told, what we see in gold is quite in tune with what we saw after the 2011 top, and in particular, shortly after the 2012 top. The long-term gold price chart below provides details.
Please note that the 38.2% Fibonacci retracement based on the entire 2015-2020 rally is very close to $1,700, which makes the above-mentioned support area even stronger.
It seems that if it weren’t for the war in Europe, gold wouldn’t have been able to move above $2,000 and instead it would have topped close to its previous highs, which provided strong resistance.
The extraordinary thing about that is that that’s exactly what happened in 2012. Gold moved higher but only until it reached its previous highs, which happened in the second half of 2012.
This time the RSI was a bit higher, but it was close to 70, just like in 2012.
Yes, this time gold moved back to the previous high, but:
- This happened as a result of a geopolitical event (the war in Europe) and geopolitically-driven rallies are generally unsustainable;
- When gold reached its previous highs, it also formed a profound weekly reversal, which formed on huge volume, and that’s very bearish.
So, the current medium-term outlook for gold is very bearish.
There are also very interesting short-term takeaways from the above chart.
If the 2012-2013 is currently being replayed (at least to a significant extent), then let’s not forget that this decline initially took the shape of a back-and-forth decline with lower lows and lower highs (but there were notable short-term rallies within the decline).
One of those counter-trend rallies took place when gold touched its 40- and 60-week moving averages (marked with blue and red) in late 2012. The RSI was trading at about 50 at that time, and that’s more or less when we saw the clear sell signal from the MACD indicator (lower part of the above chart).
Let’s see how this applies to the current situation.
Basically, we saw the same thing. Gold has corrected, as it did in 2012. However, the correction didn’t last very long (it’s just a correction, after all).
Back then, it had ended a bit above the 40- and 60-week moving averages after the RSI moved back close to the 50 level (I mean the second rebound, not the first one). We’re seeing the same thing.
The difference now is that gold declined more in the short term before correcting, whereas back in 2012, it corrected twice. However, let’s not forget that this time the preceding rally was bigger (war tensions), so it’s no wonder that gold had more to correct in a shorter time. Consequently, it seems that the recent correction took place “instead of” two 2012 corrections.
Anyway, after the correction was over, gold plunged, and the next rebound started once gold moved close to its previous medium-term lows. The analogous lows right now are the 2021 bottoms, which are below $1,700. That’s where I think gold is headed next.
Also, if the situation is now going to be more similar to what we saw in 2008, then we might expect gold to decline faster than in 2013. Silver and mining stocks are likely to be affected even more than gold, though.
Let’s take a look at the silver market.
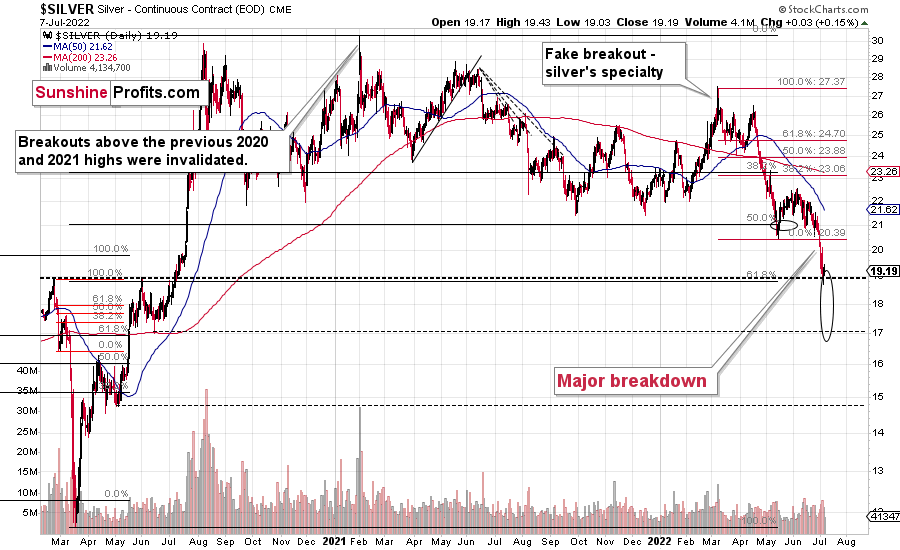
Silver just broke to new lows this week!
Silver prices have been trading below $20 for several days and confirmed a breakdown below this level – for the first time since mid-2020.
This is a very bearish development, and a confirmation of the bearish indications from other charts.
There’s a strong support at about $19 as that’s where silver previously topped twice. However, since gold is likely to decline some more, silver could move below $19 before correcting, too.
The next support is at about $17, and it wouldn’t surprise me to see silver hit this level before correcting back to $19 or $20.
As you see, the silver outlook is not as precise as it is for gold, as the support levels and targets based on multiple techniques don’t necessarily align. In the case of gold, they do.
Fortunately, it’s very likely that the short-term correction in gold, silver, and miners will start at more or less the same time. This means that when gold moves to its 2021 lows at about $1,700 or below, then gold, silver, and mining stocks would be likely to correct. Monitoring what gold does will likely be more important for silver and mining stock traders/investors than monitoring those markets on their own.
Let’s not forget that gold is not the only precious metal that is repeating its 2012 performance right now, and you can see more details on silver’s long-term chart.
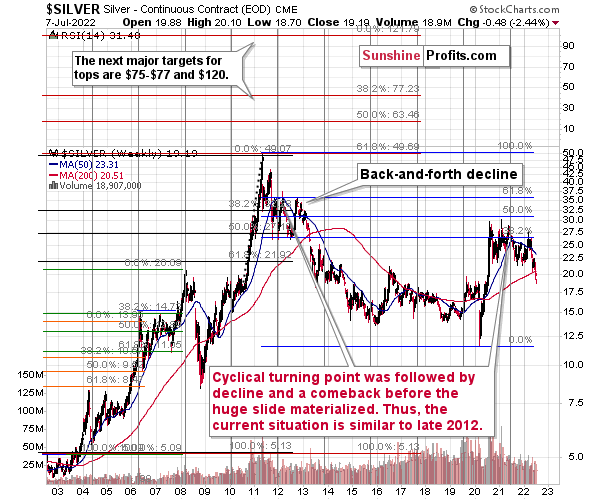
As you can see on the above chart, silver corrected about 50% of the previous downswing, and this correction ended at about $30, a long time ago. Ever since, silver has been declining, and even the outbreak of war in Europe didn’t make silver rally above that level.
On the above chart, you can see how silver first topped in 2011, then declined and formed another top at the cyclical turning point. Next, it declined once again – to the previous lows. After that, silver rallied (in 2012 and 2022), and it topped between its 50-week moving average (marked in blue) and the previous top. Now silver is declining in a back-and-forth manner (you can see it more clearly on the previous short-term silver chart).
Back in 2012, these were just the early days of a gargantuan decline, and the same appears likely to be the case this time. Interest rates are going up after all, and the Fed is determined to quench inflation.
Let’s not forget that rising interest rates are likely to negatively impact not just commodities, but practically all industries. This will likely cause silver’s price to decline profoundly, as silver’s industrial demand could be negatively impacted by lower economic growth (or a decline in economic activity).
Besides, please note that silver didn’t even manage to rally as much as copper (which tried to move to new highs recently) or most other commodities, thus being rather weak.
Consequently, it seems that silver will need to decline profoundly before it rallies (to new all-time highs) once again.
Having said that, let’s take a look at what happened in mining stocks.
Most importantly, let me emphasize that gold stocks are declining similarly to how they did in 2008.
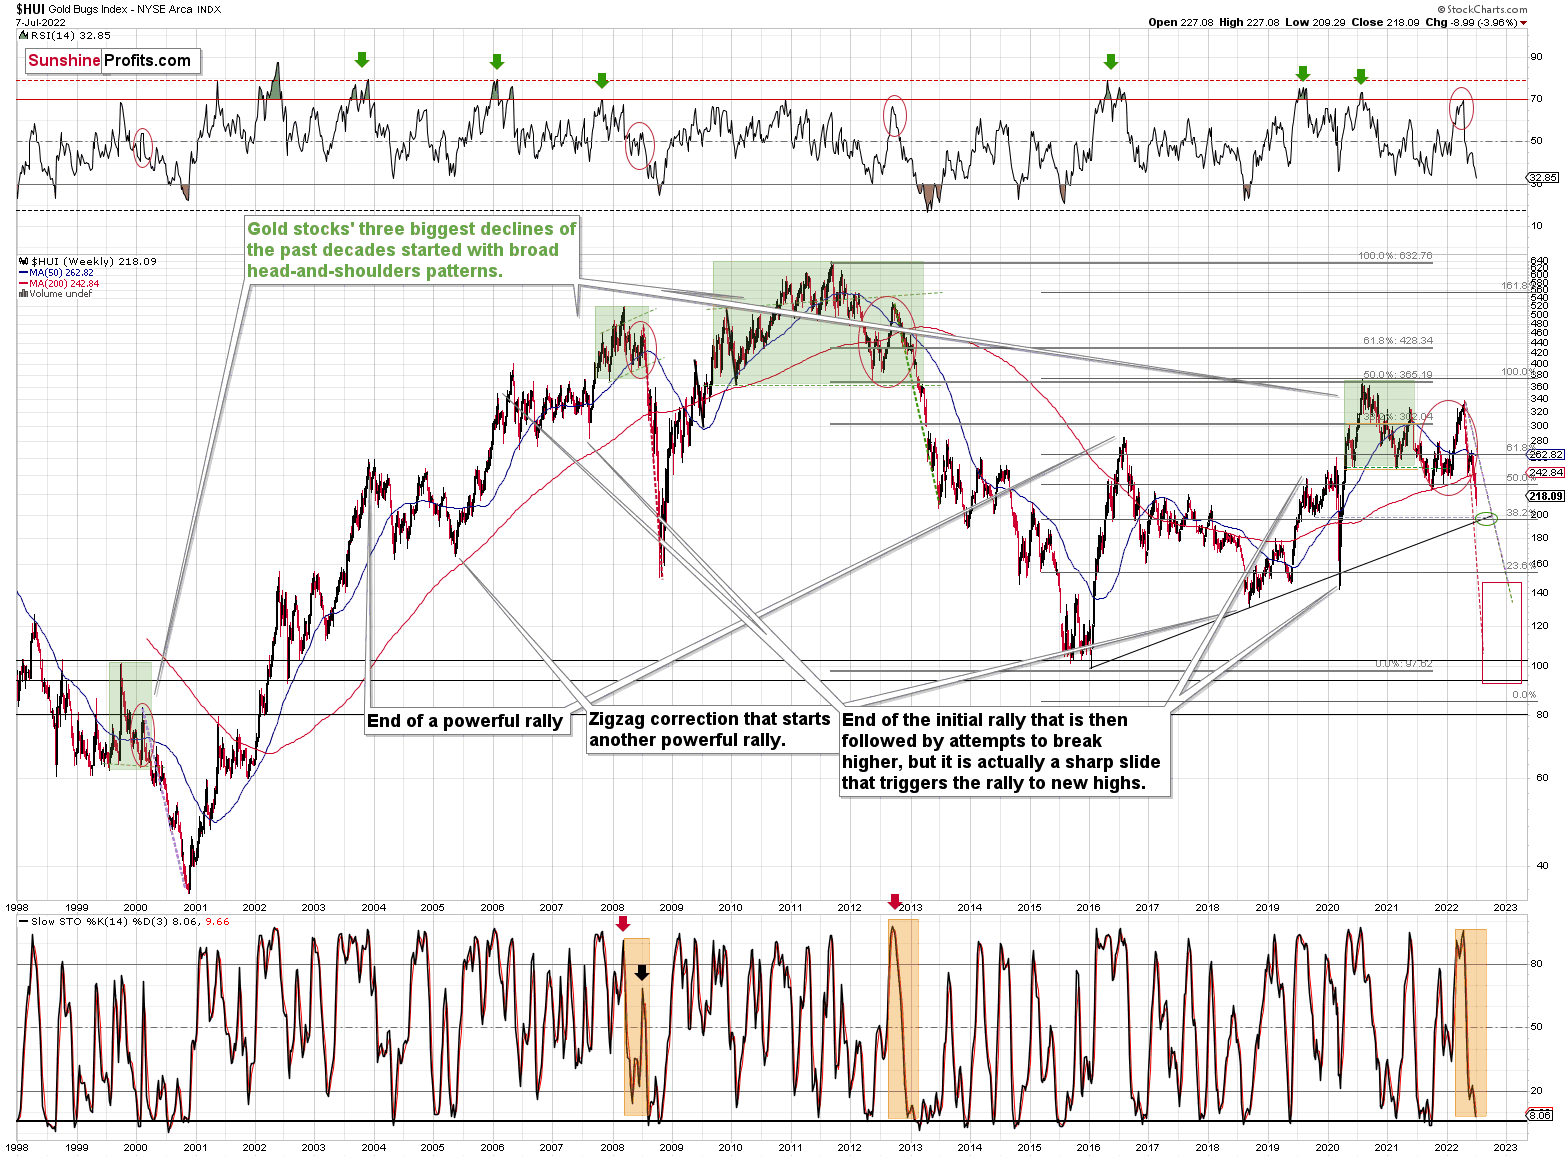
On a short-term basis, we see a short-term (only) downside target of around 200. That’s about 10% below yesterday’s (Thursday’s) closing price. There are several reasons for it:
- It’s a round number, and those tend to be more important psychologically than other numbers.
- That’s where we have the rising medium-term support line based on the 2016 and 2018 lows. The temporary move below this line triggered a massive rally in 2020.
- That’s where we have the 61.8% Fibonacci retracement level based on the entire 2016-2020 rally.
The Russian invasion triggered a rally, which was already more than erased, and if it wasn’t for it, the self-similarity would be very clear (note the head-and-shoulders patterns marked with green). Since the latter happened, it’s not as clear, but it seems that it’s still present. At least that’s what the pace of the current decline suggests.
I used a red dashed line to represent the 2008 decline, and I copied it to the current situation. They are very similar. We even saw a corrective upswing from more or less the 200-week moving average (red line), just like what happened in 2008.
We saw a breakdown to new short-term lows, which means that the volatile part of the slide is likely already underway.
All right, let’s zoom in and see how mining stocks declined in 2008.

Back then, the GDXJ ETF was not yet trading, so I’m using the GDX ETF as a short-term proxy here.
The decline took about 3 months, and it erased about 70% of the miners’ value. The biggest part of the decline happened in the final month, though.
However, the really interesting thing about that decline – that might also be very useful this time – is that there were five very short-term declines that took the GDX about 30% lower.
I marked those declines with red rectangles. After that, a corrective upswing started. During those corrective upswings, the GDX rallied by 14.8-41.6%. The biggest corrective upswing (where GDX rallied by 41.6%) was triggered by a huge rally in gold, and since I don’t expect to see anything similar this year, it could be the case that this correction size is an outlier. Not paying attention to the outlier, we get corrections of between 14.8% and 25.1%.
The interesting thing was that each corrective upswing was shorter (faster) than the preceding one.
The first one took 12 trading days. The second one took seven trading days. The third one took 2 trading days, and the fourth and final one took just 1 trading day.
Fast forward to the current situation. Let’s take a look at the GDXJ ETF.
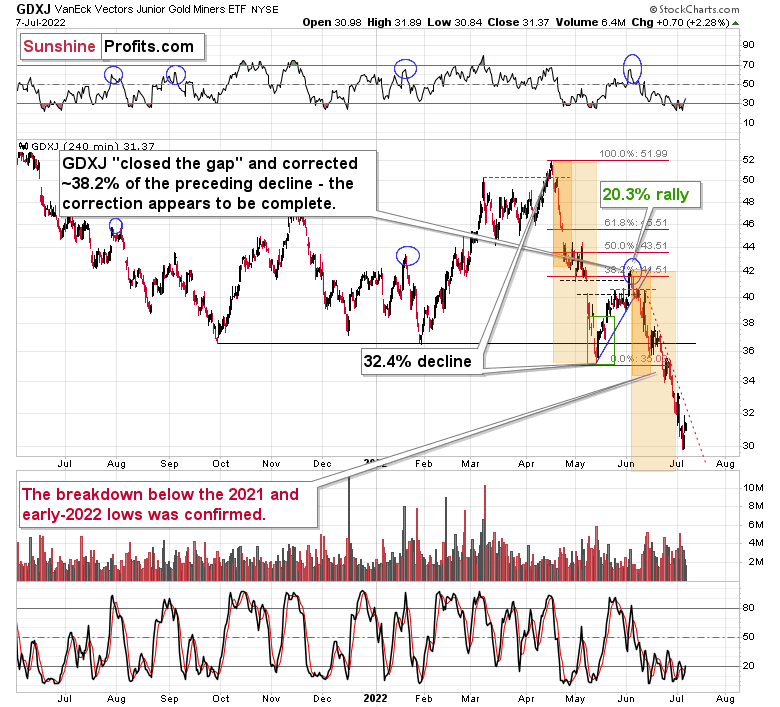
The GDXJ ETF declined by 32.4% and then corrected – it rallied by about 20.3%. The corrective upswing took 14 trading days.
The above is in perfect tune with the previous patterns seen in the GDX during the 2008 slide.
What does it tell us? It indicates that history can be rhymed, and while it will not be identical, we should pay attention to the indicators that worked in 2008. The next corrective upswing (a notable one, that is) might start when the GDXJ ETF declines by about 29-35% from its recent top. To clarify, I don’t claim that the above technique would be able to detect all corrective upswings, or that I aim to trade all of them. For instance, in my view, it was a good idea to enter a long position on May 12 and switch to a short position on May 26, but I wasn’t aiming to catch the intraday moves.
GDXJ could also decline a bit more than 29-35%, as let’s keep in mind that previous statistics are based on the GDX ETF and we are discussing the GDXJ here, and the latter is likely to decline even more than GDX as juniors are more correlated with the general stock market (and the latter is likely to slide).
So, let’s say that the GDXJ might decline between 29% and 40% from the recent high before triggering another notable corrective upswing (one that could take between 5 and 10 trading days based on how long the last one took and how big those corrections were in 2008).
The recent high was formed with the GDXJ ETF at $42.19. Applying the above-mentioned percentages to this price provides us with $24.78-29.32. And yes, the above would be likely to take place along with a big decline in gold prices.
Now, is there any meaningful support level in this area that could stop the decline?
Yes!
The late-March 2020 low is at $26.62, and it provides significant short-term support within the analogy-based target area.
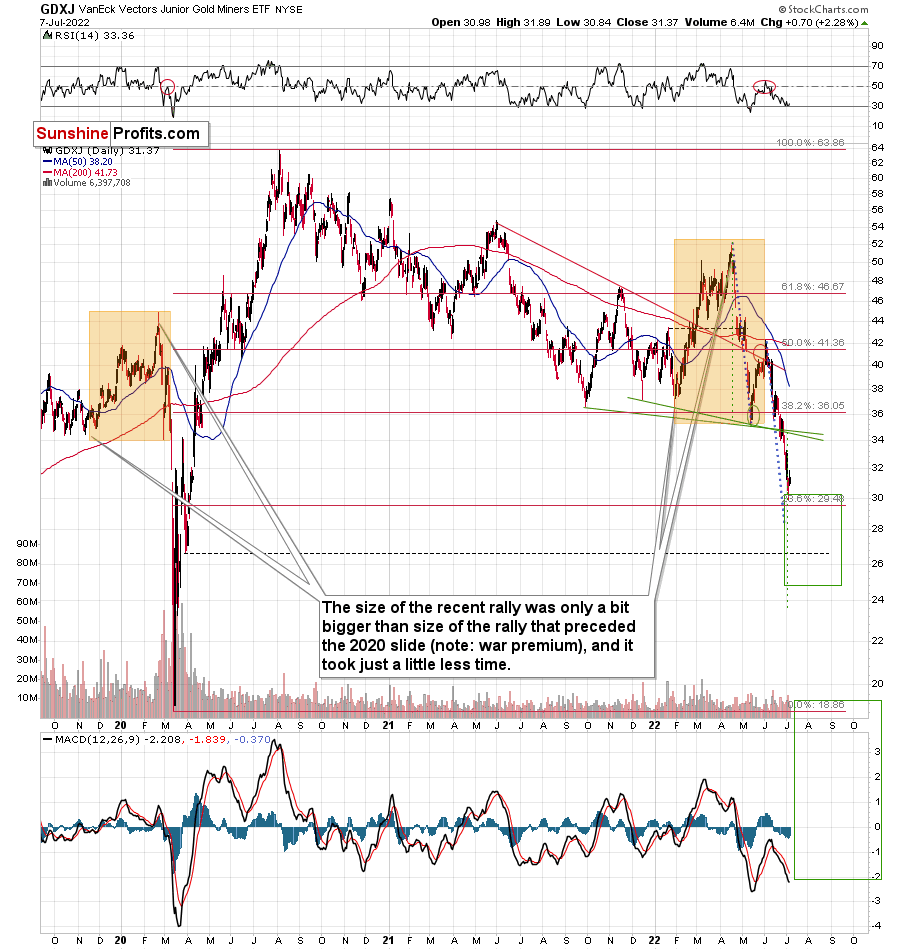
Additionally, the above corresponds – more or less – to the size of the decline that would match the size of the April-May decline. It would be only somewhat bigger.
Let’s keep in mind that gold stocks don’t necessarily move on their own, but rather move along with gold. So, if gold moves to its strong medium-term support provided by the 2021 lows and then starts a brief rally, the same action would be likely in mining stocks.
The head and shoulders pattern confirms that the downside target is well below $30, perhaps even as low as ~$24.
Please note that the previously mentioned decline in the HUI Index – it could decline by about 10% to about 200 – would approximately correspond to a move to / below $27 in the GDXJ, as the latter would need to decline by about 14%, and since juniors have been more volatile than the HUI Index during this decline, it all seems to fit.
Also, with regard to the analogy to 2008 in the GDX – remember GDX’s tendency to correct after declining by about 30%?
So far (taking this week’s low into account), the GDX ETF has declined by just 22.3% from its early-June high. Consequently, it seems that junior mining stocks have further to fall, especially if gold is about to slide to $1,700 or slightly below it.
Also, let’s not forget about the forest while looking at individual trees. By that, I mean looking at how gold stocks perform relative to gold. That’s one of the major indications that the current situation is just like what we saw at the 2012 top.
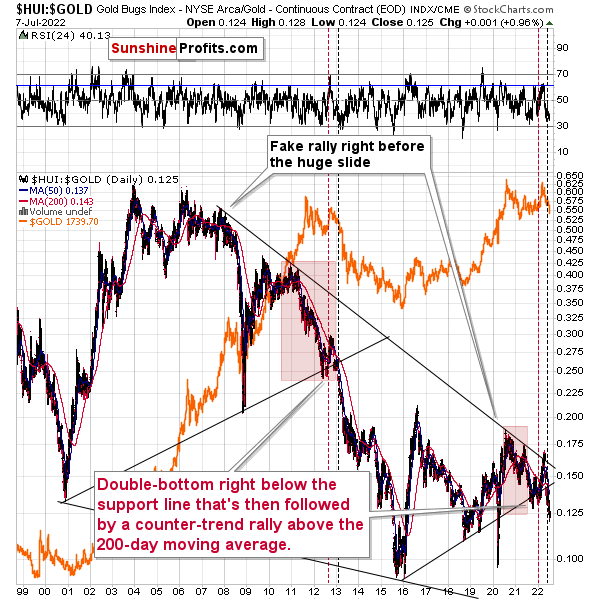
The situation in the gold stock to gold ratio is similar to what we saw in late 2012 and early 2013. The HUI to gold ratio invalidated its first attempt to break lower (marked with red, dashed lines), but after a corrective upswing, it then broke lower more decisively. That’s what I marked using black, dashed lines.
If history is to rhyme, we’re about to see a profound decline. In fact, we’re likely already seeing its beginning.
Also, please note that the pattern that we currently see, which started in early 2016, is somewhat similar to what happened between 2003 and 2008.
Back in 2008, the breakdown from the consolidation resulted in sharply lower ratio values and much lower prices of gold stocks.
So, if the situation is analogous to 2012-2013, we’re likely to see a big decline in the following weeks/months, and if it’s analogous to 2008, we’re likely to see an enormous decline in the following weeks/months.
Declining stock prices would only add fuel to the bearish fire (after all, gold stocks are… just stocks) and that’s exactly what’s likely to happen.
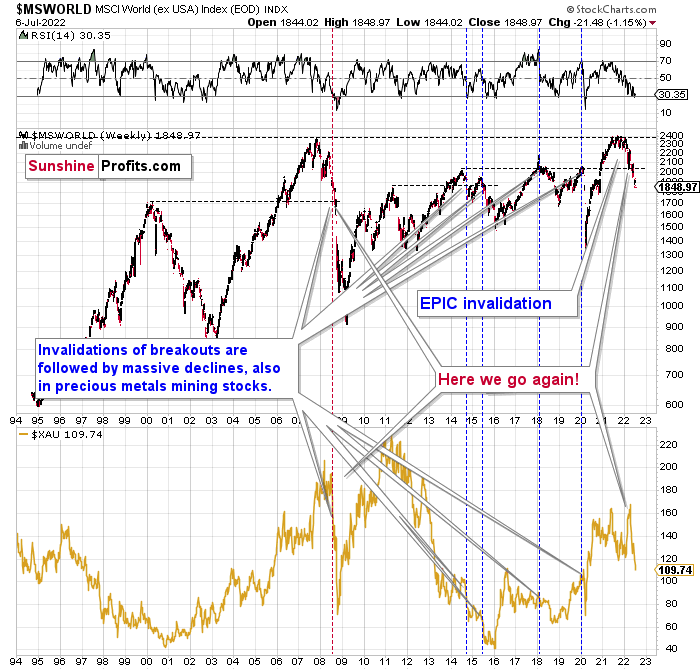
The technical picture in the case of world stocks remains extremely bearish, and my previous comments on it were just confirmed. Here’s what I’ve been writing about the above chart for quite a few weeks now:
World stocks have already begun their decline, and based on the analogy to the previous invalidations, the decline is not likely to be small. In fact, it’s likely to be huge.
For context, I explained the ominous implications on Nov. 30. I wrote:
Something truly epic is happening in this chart. Namely, world stocks tried to soar above their 2007 high, they managed to do so, and… failed to hold the ground. Despite a few attempts, the breakout was invalidated. Given that there were a few attempts and that the previous high was the all-time high (so it doesn’t get more important than that), the invalidation is a truly critical development.
It's a strong sell signal for the medium - and quite possibly for the long term.
From our – precious metals investors’ and traders’ – point of view, this is also of critical importance. All previous important invalidations of breakouts in world stocks were followed by massive declines in mining stocks (represented by the XAU Index).
Two of the four similar cases are the 2008 and 2020 declines. In all cases, the declines were huge, and the only reason why they appear “moderate” in the lower part of the above chart is that it has a “linear” and not a “logarithmic” scale. You probably still remember how significant and painful (if you were long, that is) the decline at the beginning of 2020 was.
All those invalidations triggered big declines in the mining stocks, and we have “the mother of all stock market invalidations” at the moment, so the implications are not only bearish, but extremely bearish.
World stocks have declined below their recent highs, and when something similar happened in 2008, it meant that both stocks and gold and silver mining stocks (lower part of the chart) were about to slide much further.
The medium-term implications for mining stocks are extremely bearish.
However, let’s get back to the short- and medium-term point of view.
Mining stocks declined significantly this week, but they haven’t severely underperformed gold. There is a good reason for it – the general stock market moved higher recently.
What would have to happen for the mining stocks (in particular, junior mining stocks) to decline in a more profound manner and slide well below $30 (in the GDXJ)? For example, the trend in the stock market could reverse.
Guess what – that’s exactly what’s likely to happen based on what’s going on in the S&P 500 chart.
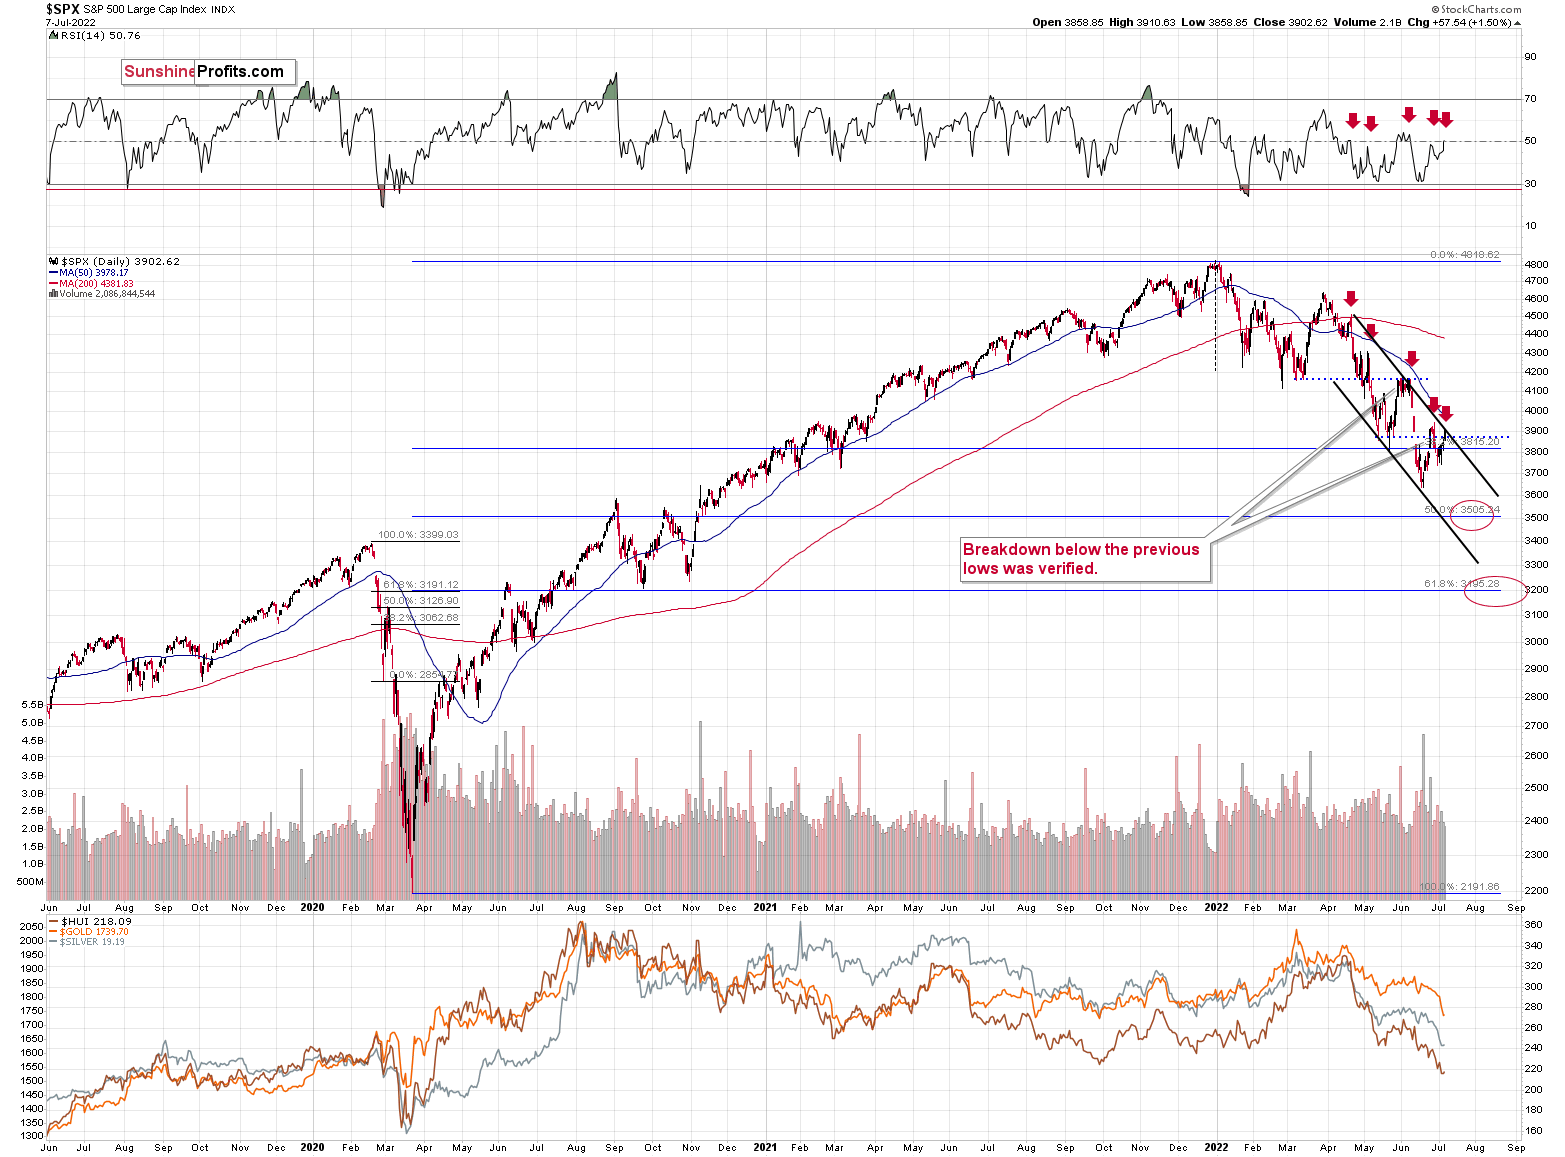
The S&P 500 just moved to the upper border of its trading channel, which means that it’s now likely to reverse its course. This scenario is supported by the action in the RSI indicator.
As you can see on the above chart (marked with red arrows), when the RSI moved to or close to 50 in recent months, it meant that the corrective rally was either over or about to end. The RSI just moved to 50.76.
In all recent cases, the declines that followed this RSI-close-to-50 sell signal were sharp. All of them, except the last one, were quite significant from the short-term point of view. In fact, if the S&P 500 does exactly what it did after the previous signals, it will likely move close to the 3,500 level, which has been my target area for some time now. That’s where we have the 50% Fibonacci retracement based on the entire 2020-2022 rally.
Most interestingly, though, such a decline would likely have a devastating effect on the prices of mining stocks (especially junior mining stocks) and silver. There might be some impact on gold, too.
The above would also be in tune with an extra rally in the USD Index. After all, less competitive exports are not that favorable for the U.S. economy.
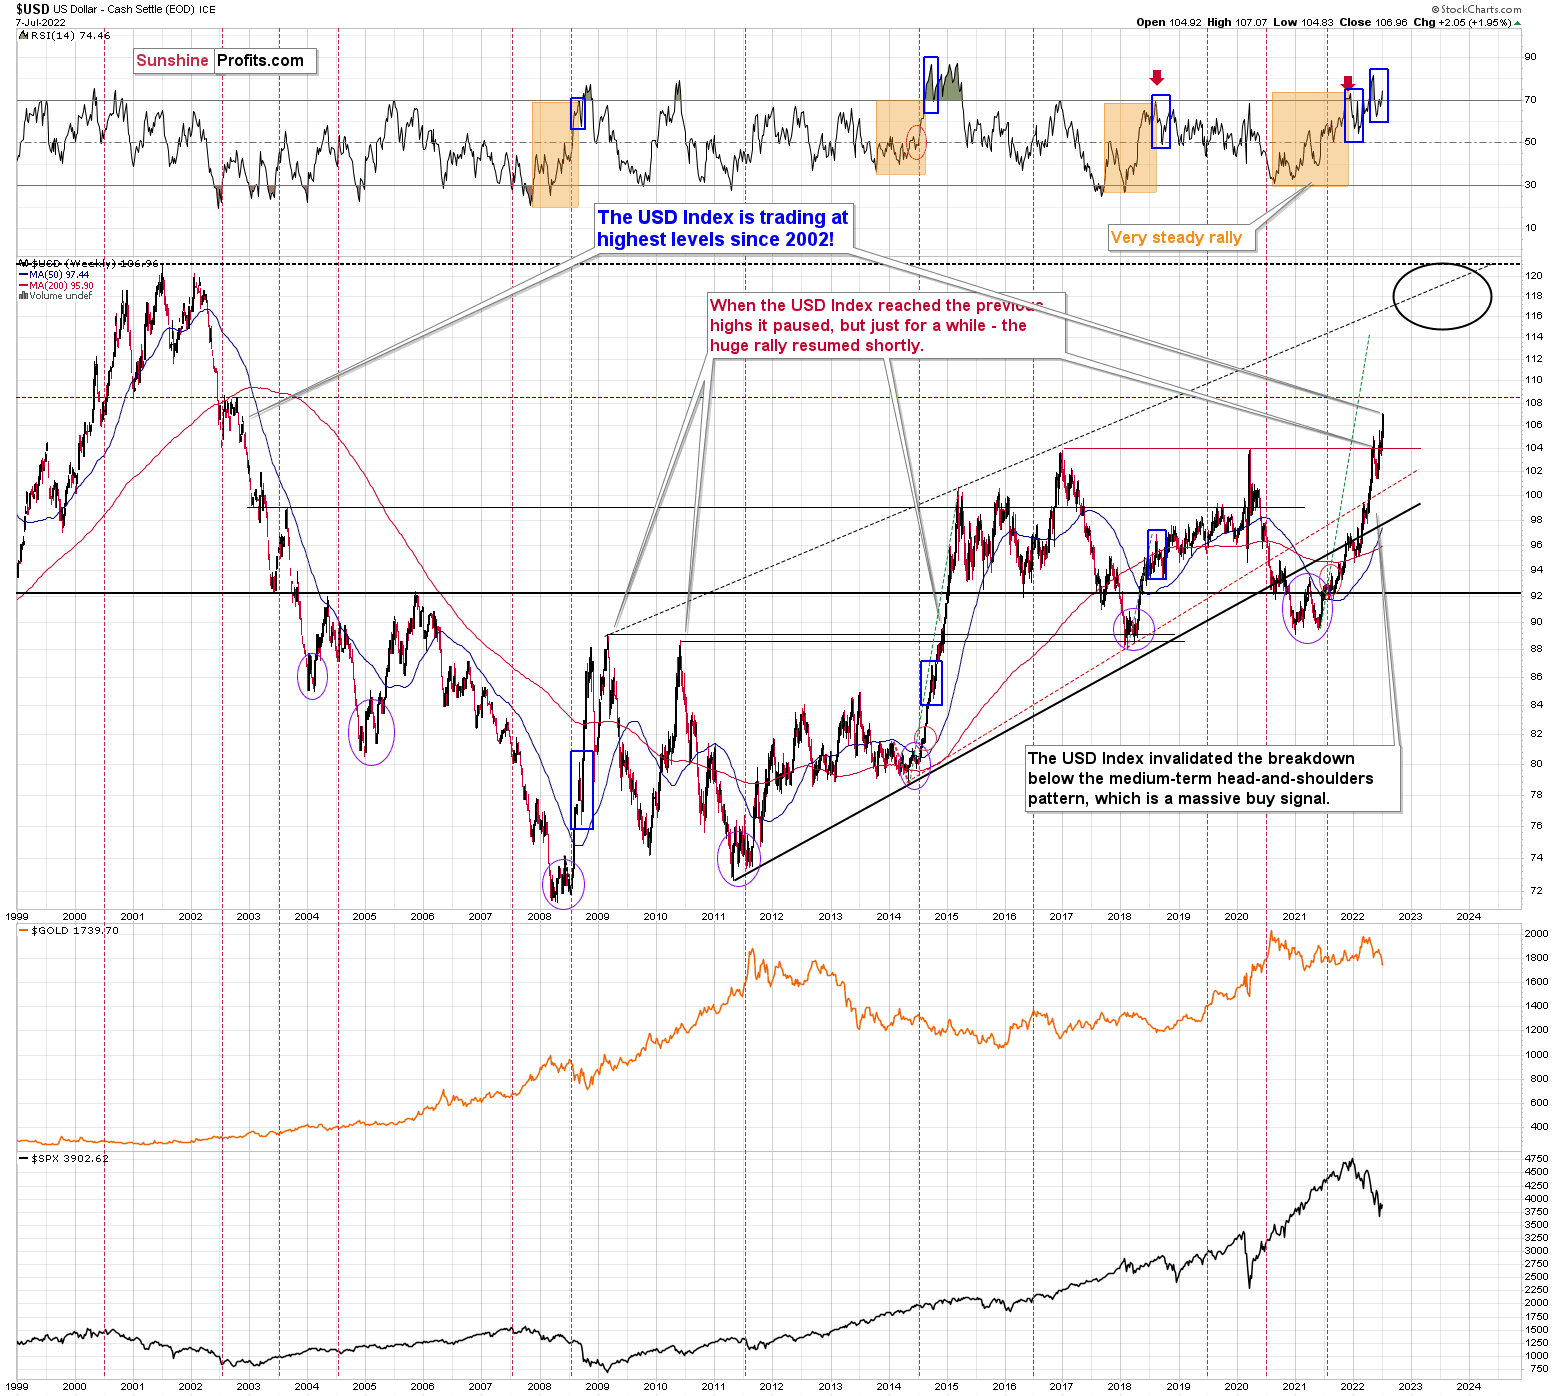
Speaking of the USD Index, after invalidating the breakout below the multi-year head-and-shoulders pattern, the USDX was poised to soar, just like I’ve been expecting it to do for more than a year, and that’s exactly what it did. And now it’s as high as it hasn’t been that high in 20 years!
The USD Index just broke above the previous highs, and it did so after correcting, which means that it just completed a massively bullish cup-and-handle pattern. This pattern is likely to send the USD Index much higher. However, since no market moves in a straight line, either up or down, let’s see where we have potential resistance levels.
The nearest resistance is provided by the 2002 high, and it’s slightly above the 108 level.
This means that the USD Index could easily rally by another 1 index point or so, which in turn could easily trigger another profound decline in gold.
This could happen this week (or early next week), so please stay tuned.
Whether this triggers a massive decline in junior miners or not is a different matter. It might, but it also might trigger a move back to this week’s intraday lows or just somewhat below them, and then miners could show strength. Either of the above – if accompanied by gold’s move to/below $1,700 – would serve as a signal for closing one’s current short positions and taking our massive profits off the table.
If the general stock market declines along with a rally in the USD Index, then the scenario in which the junior miners decline profoundly will likely be realized. I think it’s the more likely scenario here.
Do I plan to enter a long position once I close the current short position? Yes (just like I did at the end of the previous big correction), but only if gold declines below $1,700. If it doesn’t, and it moves higher right now, then I most likely won’t make any adjustments to the current short position. Remember – it’s not the point to catch each and every price move – in fact, it’s impossible to do so. The point is to select those trades that have the best risk-to-reward ratio and then enter trades while waiting out (i.e., ignoring) possible trades that don’t have a very favorable risk-to-reward ratio.
Naturally, as always, I’ll keep you – my subscribers – informed.
Overview of the Upcoming Part of the Decline
- It seems to me that the precious metals market is already in its medium-term decline that is about to take it much lower (to the 2021 lows in case of gold - $1,650 - $1,700). Once that takes place, I expect gold, silver, and mining stocks to start a corrective rally (similar to what we saw in 2013).
- If we see a situation where miners slide in a meaningful and volatile way while silver doesn’t (it just declines moderately), I plan to – once again – switch from short positions in miners to short positions in silver. At this time, it’s too early to say at what price levels this could take place and if we get this kind of opportunity at all – perhaps with gold prices close to $1,600.
- If we see a situation where miners slide in a meaningful and volatile way while silver doesn’t (it just declines moderately), I plan to – once again – switch from short positions in miners to short positions in silver. At this time, it’s too early to say at what price levels this could take place and if we get this kind of opportunity at all – perhaps with gold prices close to $1,600.
- I plan to exit all remaining short positions once gold shows substantial strength relative to the USD Index while the latter is still rallying. This may be the case with gold close to $1,400. I expect silver to fall the hardest in the final part of the move. This moment (when gold performs very strongly against the rallying USD and miners are strong relative to gold after its substantial decline) is likely to be the best entry point for long-term investments, in my view. This can also happen with gold close to $1,400, but at the moment it’s too early to say with certainty.
- The above is based on the information available today, and it might change in the following days/weeks.
You will find my general overview of the outlook for gold on the chart below:
Please note that the above timing details are relatively broad and “for general overview only” – so that you know more or less what I think and how volatile I think the moves are likely to be – on an approximate basis. These time targets are not binding or clear enough for me to think that they should be used for purchasing options, warrants, or similar instruments.
Letters to the Editor
Q: For us, new subscribers, please clarify what you mean when you say you may close the short position on miners if gold goes to 1700, but then you say gold may go to 1400? Closing at 1700 is hard to understand. Thanks.
A: Welcome aboard, it’s great to have you with us!
To reply to your question, I mean that I expect gold to first decline to about $1,700 or a bit lower, then correct, and then fall lower. You will find more details in the previous section called “Overview of the Upcoming Part of the Decline”. I’ll be updating the above section as well as the chart that’s in it, so that it’s easier to keep track of the forest and not be distracted by individual trees (daily price swings).
Summary
Summing up, it seems to me that this short-term decline might end any day now and that we might see a corrective upswing after an additional quick slide. Naturally, the following correction will be just a correction – nothing more than that.
After it’s done, I expect the medium-term decline to continue. The profit potential with regard to the upcoming gargantuan decline remains huge.
As investors are starting to wake up to reality, the precious metals sector (particularly junior mining stocks) is declining sharply. Here are the key aspects of the reality that market participants have ignored:
- rising real interest rates,
- rising USD Index values.
Both of the aforementioned are the two most important fundamental drivers of the gold price. Since neither the USD Index nor real interest rates are likely to stop rising anytime soon (especially now that inflation has become highly political), the gold price is likely to fall sooner or later. Given the analogy to 2012 in gold, silver, and mining stocks, “sooner” is the more likely outcome.
After the final sell-off (that takes gold to about $1,350-$1,500), I expect the precious metals to rally significantly. The final part of the decline might take as little as 1-5 weeks, so it's important to stay alert to any changes.
As always, we'll keep you – our subscribers – informed.
To summarize:
Trading capital (supplementary part of the portfolio; our opinion): Full speculative short positions (300% of the full position) in junior mining stocks are justified from the risk to reward point of view with the following binding exit profit-take price levels:
Mining stocks (price levels for the GDXJ ETF): binding profit-take exit price: $27.32; stop-loss: $37.43
Alternatively, if one seeks leverage, we’re providing the binding profit-take levels for the JDST (2x leveraged). The binding profit-take level for the JDST: $18.35; stop-loss for the JDST: $10.98
For-your-information targets (our opinion; we continue to think that mining stocks are the preferred way of taking advantage of the upcoming price move, but if for whatever reason one wants / has to use silver or gold for this trade, we are providing the details anyway.):
Silver futures downside profit-take exit price: $17.22; stop-loss: $22.23
SLV profit-take exit price: $16.22; stop-loss: $20.21
ZSL profit-take exit price: $41.47; stop-loss: $26.78
Gold futures downside profit-take exit price: $1,706; stop-loss: $1,873
HGD.TO – alternative (Canadian) 2x inverse leveraged gold stocks ETF – the upside profit-take exit price: $11.87; stop-loss: $7.87
HZD.TO – alternative (Canadian) 2x inverse leveraged silver ETF – the upside profit-take exit price: $31.87; stop-loss: $20.68
Long-term capital (core part of the portfolio; our opinion): No positions (in other words: cash)
Insurance capital (core part of the portfolio; our opinion): Full position
Whether you’ve already subscribed or not, we encourage you to find out how to make the most of our alerts and read our replies to the most common alert-and-gold-trading-related-questions.
Please note that we describe the situation for the day that the alert is posted in the trading section. In other words, if we are writing about a speculative position, it means that it is up-to-date on the day it was posted. We are also featuring the initial target prices to decide whether keeping a position on a given day is in tune with your approach (some moves are too small for medium-term traders, and some might appear too big for day-traders).
Additionally, you might want to read why our stop-loss orders are usually relatively far from the current price.
Please note that a full position doesn't mean using all of the capital for a given trade. You will find details on our thoughts on gold portfolio structuring in the Key Insights section on our website.
As a reminder - "initial target price" means exactly that - an "initial" one. It's not a price level at which we suggest closing positions. If this becomes the case (as it did in the previous trade), we will refer to these levels as levels of exit orders (exactly as we've done previously). Stop-loss levels, however, are naturally not "initial", but something that, in our opinion, might be entered as an order.
Since it is impossible to synchronize target prices and stop-loss levels for all the ETFs and ETNs with the main markets that we provide these levels for (gold, silver and mining stocks - the GDX ETF), the stop-loss levels and target prices for other ETNs and ETF (among other: UGL, GLL, AGQ, ZSL, NUGT, DUST, JNUG, JDST) are provided as supplementary, and not as "final". This means that if a stop-loss or a target level is reached for any of the "additional instruments" (GLL for instance), but not for the "main instrument" (gold in this case), we will view positions in both gold and GLL as still open and the stop-loss for GLL would have to be moved lower. On the other hand, if gold moves to a stop-loss level but GLL doesn't, then we will view both positions (in gold and GLL) as closed. In other words, since it's not possible to be 100% certain that each related instrument moves to a given level when the underlying instrument does, we can't provide levels that would be binding. The levels that we do provide are our best estimate of the levels that will correspond to the levels in the underlying assets, but it will be the underlying assets that one will need to focus on regarding the signs pointing to closing a given position or keeping it open. We might adjust the levels in the "additional instruments" without adjusting the levels in the "main instruments", which will simply mean that we have improved our estimation of these levels, not that we changed our outlook on the markets. We are already working on a tool that would update these levels daily for the most popular ETFs, ETNs and individual mining stocks.
Our preferred ways to invest in and to trade gold along with the reasoning can be found in the how to buy gold section. Furthermore, our preferred ETFs and ETNs can be found in our Gold & Silver ETF Ranking.
As a reminder, Gold & Silver Trading Alerts are posted before or on each trading day (we usually post them before the opening bell, but we don't promise doing that each day). If there's anything urgent, we will send you an additional small alert before posting the main one.
Thank you.
Przemyslaw Radomski, CFA
Founder, Editor-in-chief

