

Briefly: in our opinion, full (300% of the regular position size) speculative short positions in junior mining stocks are justified from the risk/reward point of view at the moment of publishing this Alert.
Silver’s previous quick run-up fooled many, but you weren’t caught off-guard, and yesterday’s decline didn’t surprise you. If so, congratulations!
In short, the analogy to 2013 remains intact, and you can find multiple details for it not only in the above-linked article but also in Friday’s flagship analysis.
Today, I would like to show you how the GDXJ (a proxy for junior mining stocks) is repeating its 2013 performance, and I want to emphasize just how bearish the implications are.
Here’s what the GDXJ did in 2013.
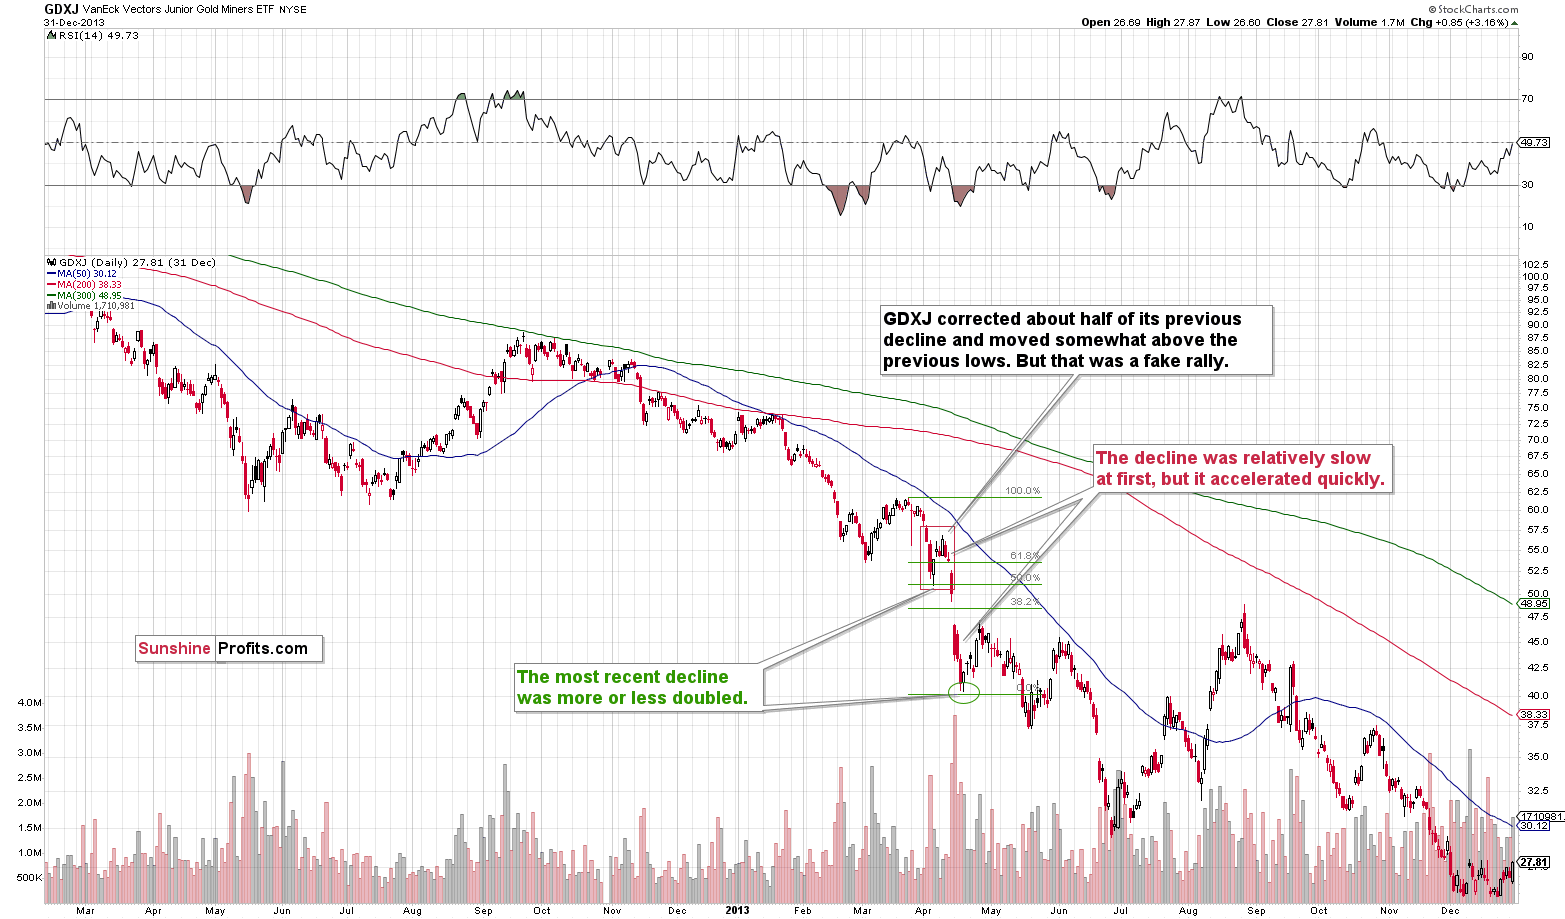
Right before the April 2013 plunge, the GDXJ corrected about half of the preceding short-term rally, and it moved above its most recent short-term low. This rally was relatively quick.
Then the decline started, but it was not huge at first. However, it took only a few days for the pace of decline to pick up, and shortly after the GDXJ moved below its recent lows, it truly plunged. The slide was also huge in the rest of the precious metals sector.
The GDXJ declined in a major way, and it formed a short-term bottom once it doubled the initial decline. I marked this with the green Fibonacci extension tool. The initial decline is 50% of the entire decline (approximately), which means that the latter was twice as big.
What does this imply for the current situation?
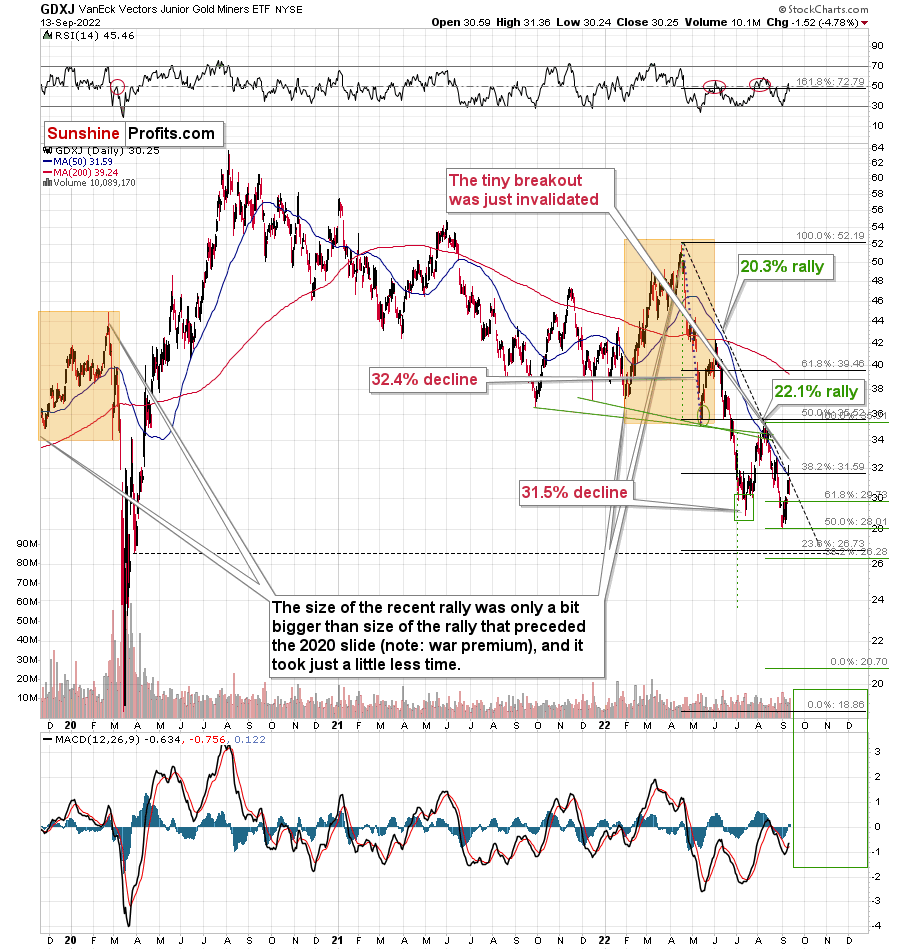
First of all, it implies that the analogy to 2013 remains intact.
Second, it implies that – based on the size of the recent decline – the GDXJ is likely to decline until it moves below $22 or so. Given the proximity of the 2020 lows that are just below $20, and the fact that right now there are more factors that are happening outside of the precious metals market that favor lower junior miners’ (and gold) prices, I wouldn’t be surprised to see the GDXJ bottom close to its 2020 low (or even slightly below it), and not slightly above the green target provided by the doubling-the-previous-decline technique.
Those “other factors” are the soaring USD Index, declining stock market prices, and rising interest rates.
Besides, the above is very much in tune with what I’ve been writing about for months. I’ve been emphasizing that the return to the 2020 target (or lower, perhaps much lower) is likely for mining stocks. Now, we even have even the short-term confirmation of this scenario.
Moreover, please note that yesterday’s almost 5% decline caused the tiny breakout above the declining, medium-term resistance line to be invalidated. Invalidations of breakouts are immediate sell signs.
The additional implication of the recent rally is that since it happened, it’s no longer likely that we will see a rebound from the ~$26-27 area. Why? Because we already saw one recently, and based on the analogy to 2013, what was likely to happen already happened. Sure, there are no certainties in any market, and there might indeed be a correction in this area, but it’s not likely, let alone very likely, that it’s going to take place.
All in all, it seems that the downtrend continues, and that it’s the final time to make sure one is prepared to take advantage of the upcoming big slide. Of course, I can’t promise any kind of performance or profitability, but in my opinion, it does seem likely that the next big move lower will be truly epic.
Having said that, let’s take a look at the markets from a more fundamental point of view.
You Can’t Run From Reality
With risk assets selling off hard on Sep. 13, reality returned to the financial markets. Moreover, with investors assuming that inflation would die easy, I warned repeatedly that the Fed’s war would be one of attrition. As such, the consensus woke up to that truth on Sep. 13.
For example, I explained why “peak inflation” is much more semblance than substance. In a nutshell: it doesn’t matter whether the Consumer Price Index (CPI) peaks. What matters is the economic damage required to normalize the metric to 2%.
To that point, after the headline CPI slowed from 8.5% year-over-year (YoY) in July to 8.3% YoY in August, the slow drip reminded the consensus that it’s a long way to 2%.
Please see below:
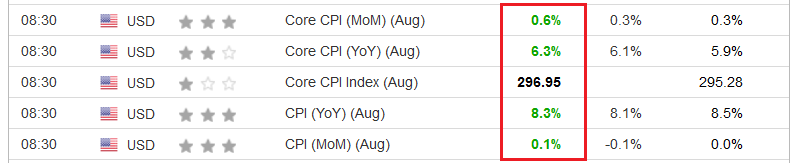 Source: Investing.com
To explain, the CPI outperformed expectations across the board. Furthermore, I warned that while lower oil & gas prices were bearish for the headline CPI, the rise in Americans’ disposable income was bullish for the core CPI. Thus, it’s no surprise that the latter increased from 5.9% YoY in July to 6.3% YoY in August. As a result, the supply-side theorists are still scratching their heads because they misunderstand the resiliency of consumer demand.
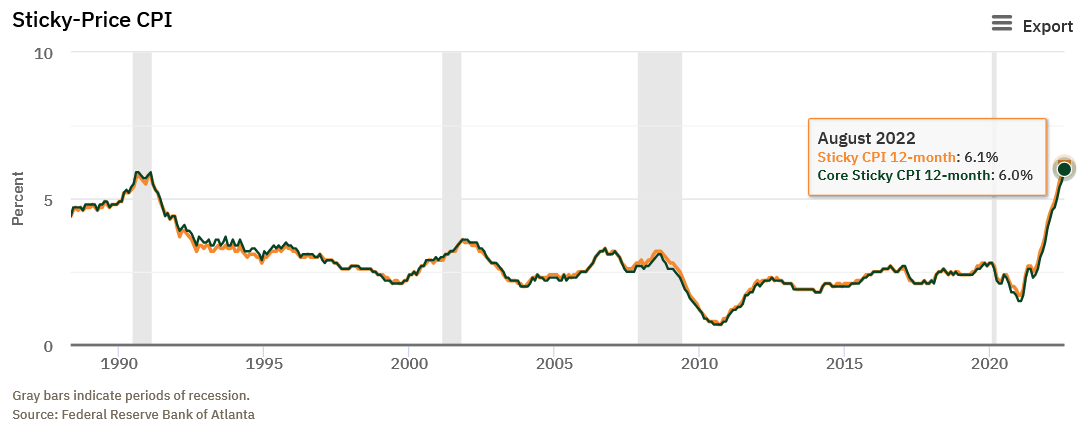
In addition, when the headline CPI slowed in July due to lower energy prices, I highlighted how the Atlanta Fed’s Sticky CPI’s hit new 2022 highs. I wrote on Aug. 11:
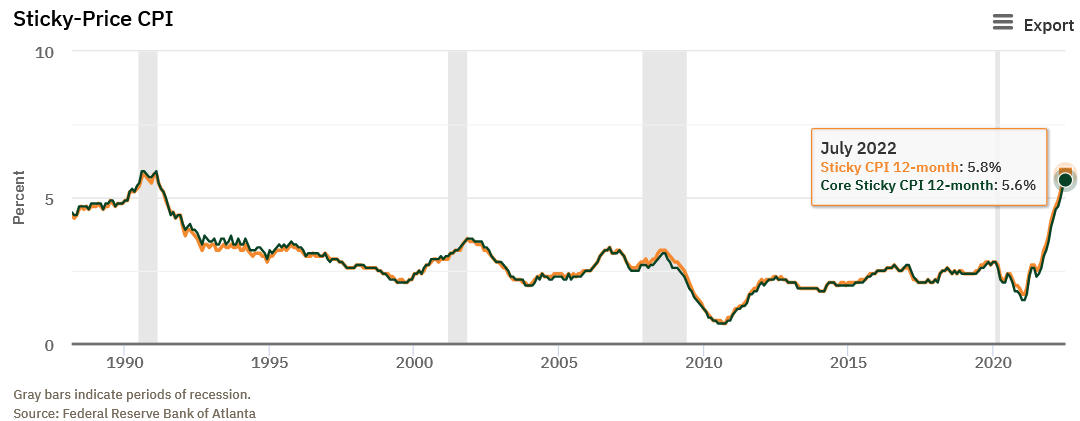
The orange and green lines above track the YoY percentage changes in the Sticky and core Sticky (excluding food and energy) CPIs. If you analyze the right side of the chart, you can see that neither decelerated in July. For context, the Atlanta Fed defines the metrics as:
“The Sticky CPI is calculated from a subset of goods and services included in the CPI that change price relatively infrequently. Because these goods and services change price relatively infrequently, they are thought to incorporate expectations about future inflation to a greater degree than prices that change on a more frequent basis. One possible explanation for sticky prices could be the costs firms incur when changing price.”
Likewise, with the headline and core Sticky CPIs reaching new 2022 heights on Sep. 13, the reality is that inflation is materially embedded within the U.S. economy.
Please see below:
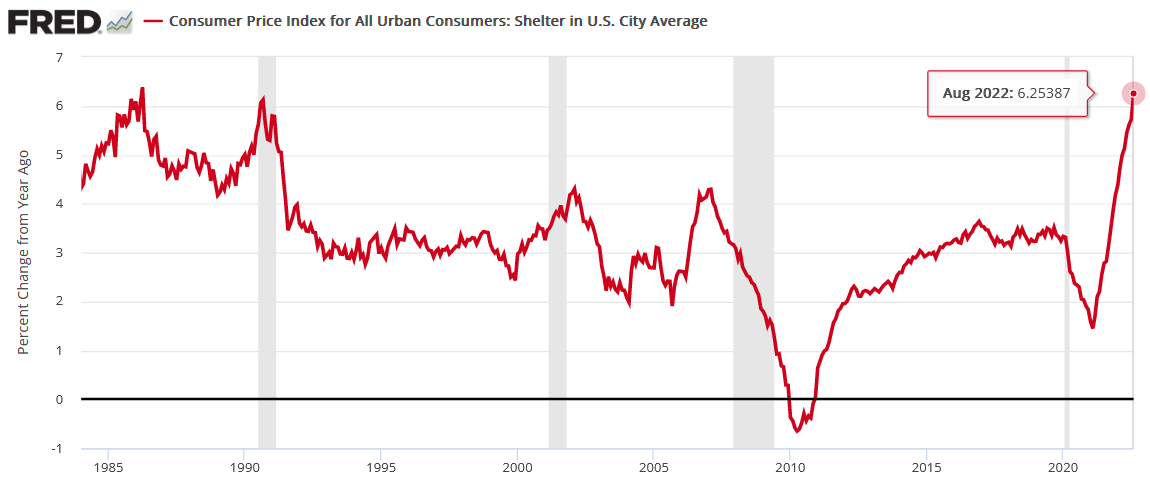
Furthermore, I’ve covered the implications of rent inflation extensively; and with the Shelter CPI including both new and renewed leases, the data lags the findings from Apartment List, which only includes new leases. Therefore, with the Shelter CPI hitting a new 2022 high on Sep. 13, a metric that accounts for more than 30% of the headline CPI’s movement continues to prove troublesome.
Please see below:
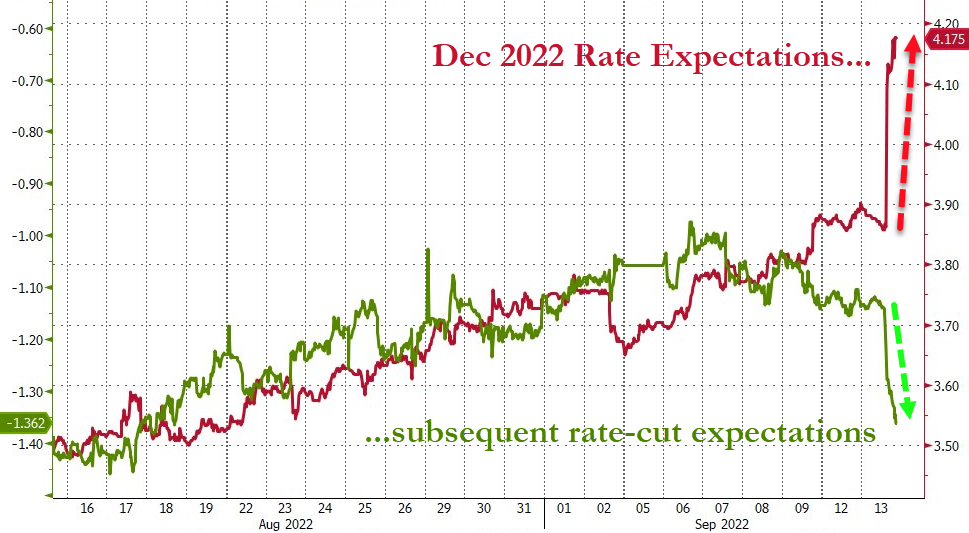
In addition, with the inflationary realities morphing into hawkish nightmares, financial assets re-priced substantially on Sep. 13. For example, the S&P 500 and the GDXJ ETF declined by 4.32% and 4.78%, respectively. Furthermore, investors rate hike expectations increased dramatically.
Please see below:
 Source: Bloomberg/ZeroHedge
To explain, the red line above tracks the market-implied rate hikes expected by the end of December 2022, while the green line above tracks the inverted (down means up) rate cuts expected thereafter. If you analyze the performance of the former, you can see that hawkish fears went vertical. As for the latter, concerns about a hard landing have investors pricing in more rate cuts.
For context, when inflation becomes unanchored, the only two historical outcomes are a hyperinflationary collapse or a rate-hike-induced recession. Moreover, with a passive approach much more damaging than an active one, hiking interest rates, quelling inflation and enduring a recession is the lesser of two evils. As a result, raising rates is short-term bearish and long-term bullish for the U.S. economy and the financial markets.
Continuing the theme, with investors’ U.S. federal funds rate (FFR) expectations now more aligned with our way of thinking, the consensus has adopted a realistic approach to solving this inflation crisis. To explain, I wrote on Aug. 1:
While the consensus assumes the Fed is near the end of its rate hike cycle, the CPI is on the fast track to 2% and a 3% FFR will be enough to capsize inflation, market participants are living in fantasy land.
For example, I’ve warned on numerous occasions that demand is much stronger than the consensus realizes. With Americans’ checking account balances at unprecedented all-time highs and the Atlanta Fed’s wage growth tracker hitting an all-time high in June, the FFR needs to go meaningfully above 3%. I wrote on Jul. 25:
With more earnings calls showcasing how the situation continues to worsen, market participants don’t realize that the FFR needs to hit ~4.5% or more for the Fed to materially reduce inflation. For context, the consensus expects a figure in the 2.5% to 3.5% range.
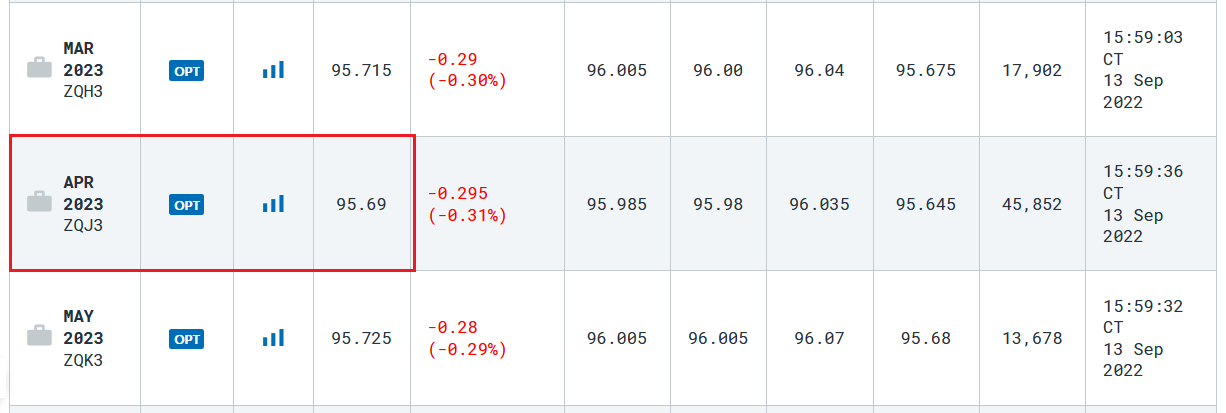
To that point, with the consensus now pricing in a peak FFR of 4.31% by the end of April 2023, the metric is approaching the 4.5% to 5.5% range that we expect in 2023.
Please see below:
 Source: CME Group
To explain, the figures above represent the 30-day FFR futures. The implied rate is calculated by subtracting the last price from 100. If you analyze the red box, the 95.69 implies an FFR of 4.31% by the end of April 2023 (100-95.69). As such, fundamental gravity has taken investors' consensus expectations from la-la land back to earth.
The Fed on Deck
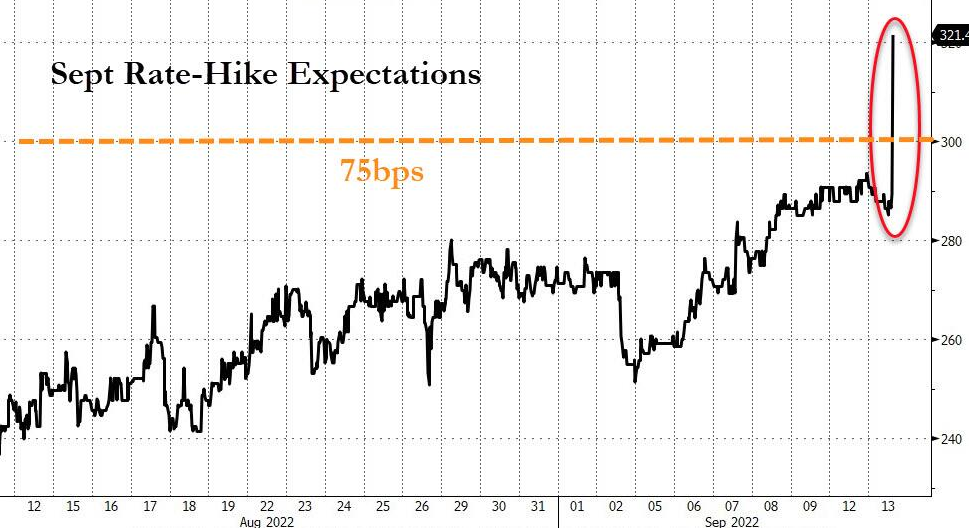
With another rate hike poised to commence on Sep. 21, the odds of a 75 basis point move spiked to 100% after the CPI print, while market participants also expect a 20% chance of a 100 basis point rate hike.
Please see below:
 Source: Bloomberg/ZeroHedge
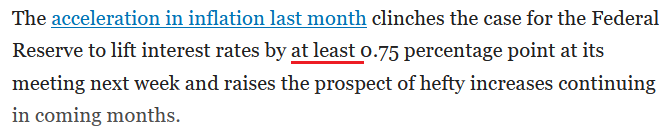
To explain, futures pricing surged through the 75 basis point threshold and is now warming up to the idea of a 100 basis point move. Moreover, the change in tone occurred after The Wall Street Journal’s (WSJ) Nick Timiraos – who serves as the Fed whisperer – published an article proclaiming that the central bank could hike by “at least” 75 basis points next week. As a result, hawkish anxieties were amplified on Sep. 13.
Please see below:
 Source: WSJ
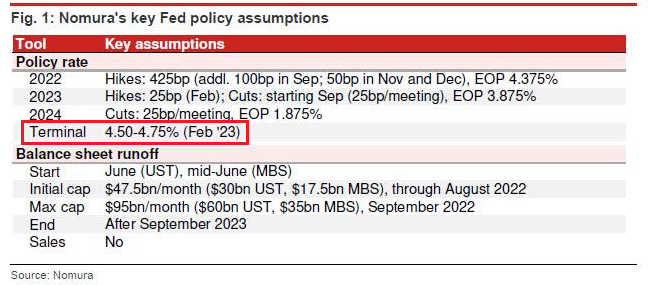
In addition, Nomura told its clients on Sep. 13 to brace for a 100 basis point increase. The team wrote:
“We have highlighted an emergence of a wage-price spiral and increasingly unanchored inflation expectations as factors that could keep inflation persistently elevated for longer, requiring a more forceful response from the Fed. With the latest data, we believe those risks are starting to materialize via higher measured inflation across a broad range of goods and services….
“We continue to believe markets underappreciate just how entrenched U.S. inflation has become and the magnitude of response that will likely be required from the Fed to dislodge it.”
As such, the bank expects the FFR to peak between 4.5% and 4.75% in February 2023.
Please see below:
Thus, while I warned consistently that hawkish fireworks would erupt in 2022, investors are starting to understand the magnitude of the issue. With unanchored inflation extremely damaging to an economy’s long-term health, the Fed realizes that normalizing the metric is the most important task.
Therefore, with an already unprecedented liquidity drain poised to accelerate even further, the developments are profoundly bearish for gold, silver, mining stocks and the S&P 500. Likewise, more downside should confront the PMs in the months ahead, and a likely U.S. recession should coincide with solid long-term buying opportunities.
The Bottom Line
With investors’ rate hike expectations shifting dramatically over the last month and a half, “peak inflation” turned out to be the most misguided narrative on Wall Street. Moreover, despite nine 25 basis point rate hikes in 2022, little progress has been made in curbing the pricing pressures. As a result, the consensus that continuously underestimated the demand side of the inflation equation has paid a hefty price for the lack of foresight.
Furthermore, the technicals have been signaling an identical outcome for months. With the long-term charts unwavering in their expectations for a stronger USD Index and lower precious metals prices, a mosaic of indicators has proven prescient over the last 12 to 20 months. Therefore, the technicals and the fundamentals remain a powerful combination.
In conclusion, the PMs declined on Sep. 13, as a sea of red flooded the financial markets. Moreover, the USD Index soared and the U.S. 10-Year real yield hit another 2022 high of 0.98%. Thus, the price action continues to unfold as expected.
Overview of the Upcoming Part of the Decline
- It seems to me that the corrective upswing is over, and that the next big move lower is already underway. We’re probably seeing the final small corrective upswing right now.
- If we see a situation where miners slide in a meaningful and volatile way while silver doesn’t (it just declines moderately), I plan to – once again – switch from short positions in miners to short positions in silver. At this time, it’s too early to say at what price levels this could take place and if we get this kind of opportunity at all – perhaps with gold prices close to $1,600.
- I plan to exit all remaining short positions once gold shows substantial strength relative to the USD Index while the latter is still rallying. This may be the case with gold prices close to $1,400. I expect silver to fall the hardest in the final part of the move. This moment (when gold performs very strongly against the rallying USD and miners are strong relative to gold after its substantial decline) is likely to be the best entry point for long-term investments, in my view. This can also happen with gold close to $1,400, but at the moment it’s too early to say with certainty.
- The above is based on the information available today, and it might change in the following days/weeks.
You will find my general overview of the outlook for gold on the chart below:
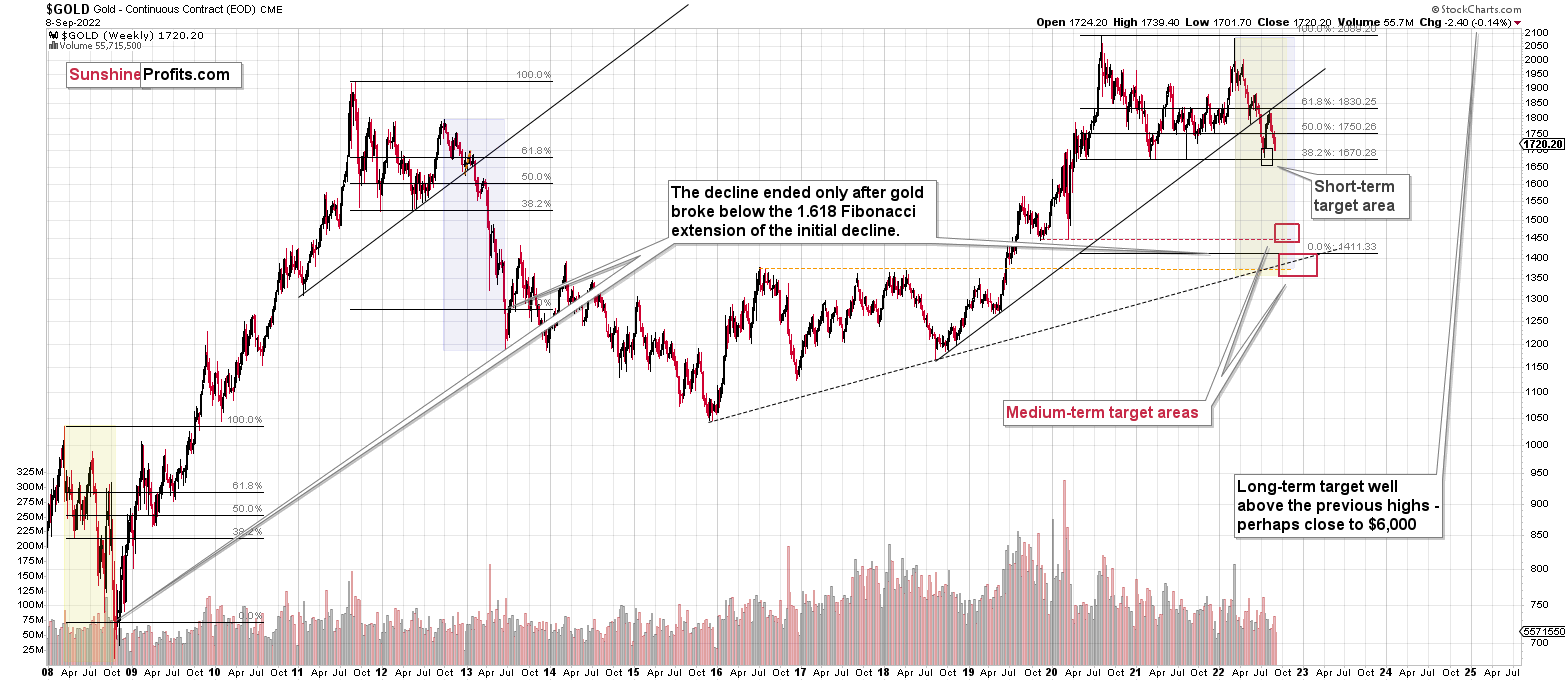
Please note that the above timing details are relatively broad and “for general overview only” – so that you know more or less what I think and how volatile I think the moves are likely to be – on an approximate basis. These time targets are not binding nor clear enough for me to think that they should be used for purchasing options, warrants, or similar instruments.
Summary
Summing up, it seems that the corrective upswing is over or is about to be over, which means that the powerful medium-term downtrend can resume any day now – the current corrective upswing simply appears to be of a very short-term nature. And based on the analogy to 2013, it seems that the next wave down might be really spectacular.
You have been profiting from how this situation develops practically throughout the entire year, and the above indicates (I’m not making any guarantees, of course) that the biggest gains are likely just ahead.
After the final sell-off (that takes gold to about $1,350-$1,500), I expect the precious metals to rally significantly. The final part of the decline might take as little as 1-5 weeks, so it's important to stay alert to any changes.
As always, we'll keep you – our subscribers – informed.
To summarize:
Trading capital (supplementary part of the portfolio; our opinion): Full speculative short positions (300% of the full position) in junior mining stocks are justified from the risk to reward point of view with the following binding exit profit-take price levels:
Mining stocks (price levels for the GDXJ ETF): binding profit-take exit price: $20.32; stop-loss: none (the volatility is too big to justify a stop-loss order in case of this particular trade)
Alternatively, if one seeks leverage, we’re providing the binding profit-take levels for the JDST (2x leveraged). The binding profit-take level for the JDST: $29.87; stop-loss for the JDST: none (the volatility is too big to justify a SL order in case of this particular trade).
For-your-information targets (our opinion; we continue to think that mining stocks are the preferred way of taking advantage of the upcoming price move, but if for whatever reason one wants / has to use silver or gold for this trade, we are providing the details anyway.):
Silver futures downside profit-take exit price: $12.32
SLV profit-take exit price: $11.32
ZSL profit-take exit price: $79.87
Gold futures downside profit-take exit price: $1,504
HGD.TO – alternative (Canadian) 2x inverse leveraged gold stocks ETF – the upside profit-take exit price: $19.87
HZD.TO – alternative (Canadian) 2x inverse leveraged silver ETF – the upside profit-take exit price: $49.87
Long-term capital (core part of the portfolio; our opinion): No positions (in other words: cash)
Insurance capital (core part of the portfolio; our opinion): Full position
Whether you’ve already subscribed or not, we encourage you to find out how to make the most of our alerts and read our replies to the most common alert-and-gold-trading-related-questions.
Please note that we describe the situation for the day that the alert is posted in the trading section. In other words, if we are writing about a speculative position, it means that it is up-to-date on the day it was posted. We are also featuring the initial target prices to decide whether keeping a position on a given day is in tune with your approach (some moves are too small for medium-term traders, and some might appear too big for day-traders).
Additionally, you might want to read why our stop-loss orders are usually relatively far from the current price.
Please note that a full position doesn't mean using all of the capital for a given trade. You will find details on our thoughts on gold portfolio structuring in the Key Insights section on our website.
As a reminder - "initial target price" means exactly that - an "initial" one. It's not a price level at which we suggest closing positions. If this becomes the case (as it did in the previous trade), we will refer to these levels as levels of exit orders (exactly as we've done previously). Stop-loss levels, however, are naturally not "initial", but something that, in our opinion, might be entered as an order.
Since it is impossible to synchronize target prices and stop-loss levels for all the ETFs and ETNs with the main markets that we provide these levels for (gold, silver and mining stocks - the GDX ETF), the stop-loss levels and target prices for other ETNs and ETF (among other: UGL, GLL, AGQ, ZSL, NUGT, DUST, JNUG, JDST) are provided as supplementary, and not as "final". This means that if a stop-loss or a target level is reached for any of the "additional instruments" (GLL for instance), but not for the "main instrument" (gold in this case), we will view positions in both gold and GLL as still open and the stop-loss for GLL would have to be moved lower. On the other hand, if gold moves to a stop-loss level but GLL doesn't, then we will view both positions (in gold and GLL) as closed. In other words, since it's not possible to be 100% certain that each related instrument moves to a given level when the underlying instrument does, we can't provide levels that would be binding. The levels that we do provide are our best estimate of the levels that will correspond to the levels in the underlying assets, but it will be the underlying assets that one will need to focus on regarding the signs pointing to closing a given position or keeping it open. We might adjust the levels in the "additional instruments" without adjusting the levels in the "main instruments", which will simply mean that we have improved our estimation of these levels, not that we changed our outlook on the markets. We are already working on a tool that would update these levels daily for the most popular ETFs, ETNs and individual mining stocks.
Our preferred ways to invest in and to trade gold along with the reasoning can be found in the how to buy gold section. Furthermore, our preferred ETFs and ETNs can be found in our Gold & Silver ETF Ranking.
As a reminder, Gold & Silver Trading Alerts are posted before or on each trading day (we usually post them before the opening bell, but we don't promise doing that each day). If there's anything urgent, we will send you an additional small alert before posting the main one.
Thank you.
Przemyslaw Radomski, CFA
Founder, Editor-in-chief

