

Briefly: in our opinion, full (300% of the regular position size) speculative short positions in junior mining stocks are justified from the risk/reward point of view at the moment of publishing this Alert.
Crude oil did it again! Even though gold moved higher recently, crude oil soared so substantially that it stole practically the entire spotlight. Let’s take a look at it before moving to the precious metals sector.
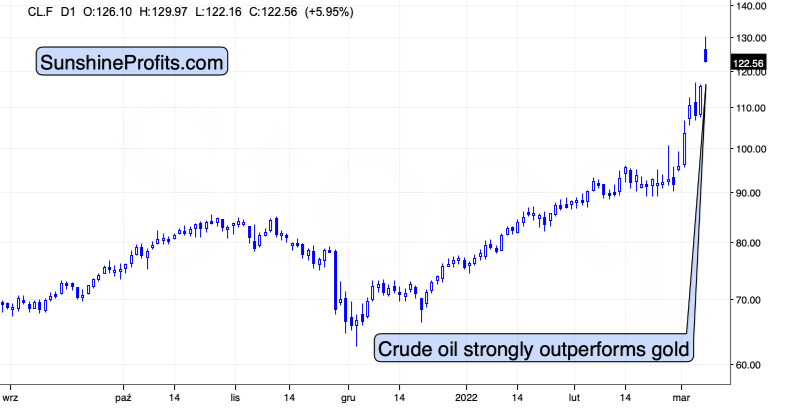
The price of crude oil soared by almost $40 in just a bit over a week! That’s over 40%. Gold rallied too, but the extent of the move higher is nothing compared to what we just saw in crude oil.
The black gold reversed on an intraday basis today, so we might have seen the top, but it’s far from being clear.
What is clear, however, is that crude oil is greatly outperforming gold.
This – as I’ve commented previously – has profound implications for precious metals investors:
As you may have noticed, crude oil shot up recently in a spectacular manner. This seems normal, as it’s a market with rather inflexible supply and demand, so disruptions in supply or threats thereof can impact the price in a substantial way. With Russia as one of the biggest crude oil producers, its invasion of Ukraine, and a number of sanctions imposed on the attacking country (some of them involving oil directly), it’s natural that crude oil reacts in a certain manner. The concern-based rally in gold is also understandable.
However, the relationship between wars, concerns, and prices of assets is not as straightforward as “there’s a war, so gold and crude oil will go up.” In order to learn more about this relationship, let’s examine the most similar situation in recent history to the current one, when oil supplies were at stake.
The war that I’m mentioning is the one between Iraq and the U.S. that started almost 20 years ago. Let’s see what happened in gold, oil, and gold stocks at that time.
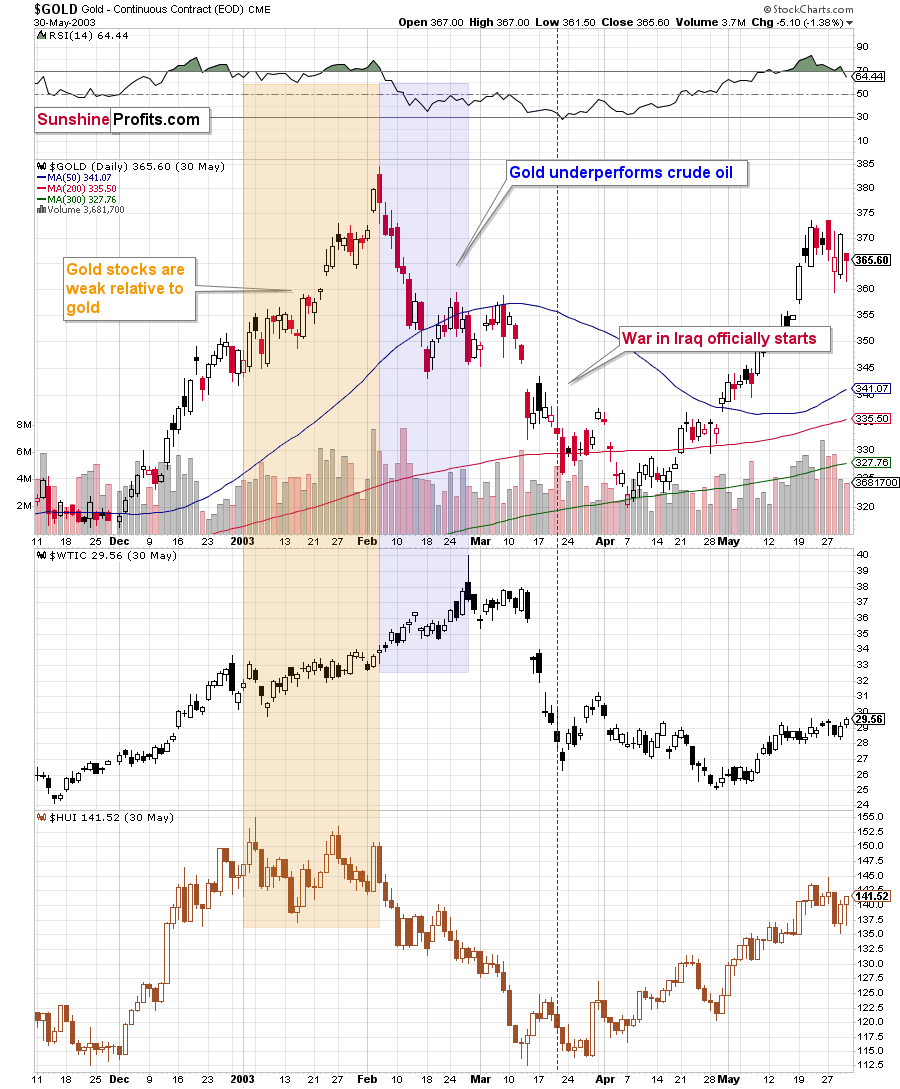
The most interesting thing is that when the war officially started, the above-mentioned markets were already after a decline. However, that’s not that odd, when one considers the fact that back then, the tensions were building for a long time, and it was relatively clear in advance that the U.S. attack was going to happen. This time, Russia claimed that it wouldn’t attack until the very last minute before the invasion.
The point here, however, is that the markets rallied while the uncertainty and concerns were building up, and then declined when the situation was known and “stable.” I don’t mean that “war” was seen as stable, but rather that the outcome and how it affected the markets was rather obvious.
The other point is the specific way in which all three markets reacted to the war and the timing thereof.
Gold stocks rallied initially, but then were not that eager to follow gold higher, but that’s something that’s universal in the final stages of most rallies in the precious metals market. What’s most interesting here is that there was a time when crude oil rallied substantially, while gold was already declining.
Let me emphasize that once again: gold topped first, and then it underperformed while crude oil continued to soar substantially.
Fast forward to the current situation. What has happened recently?
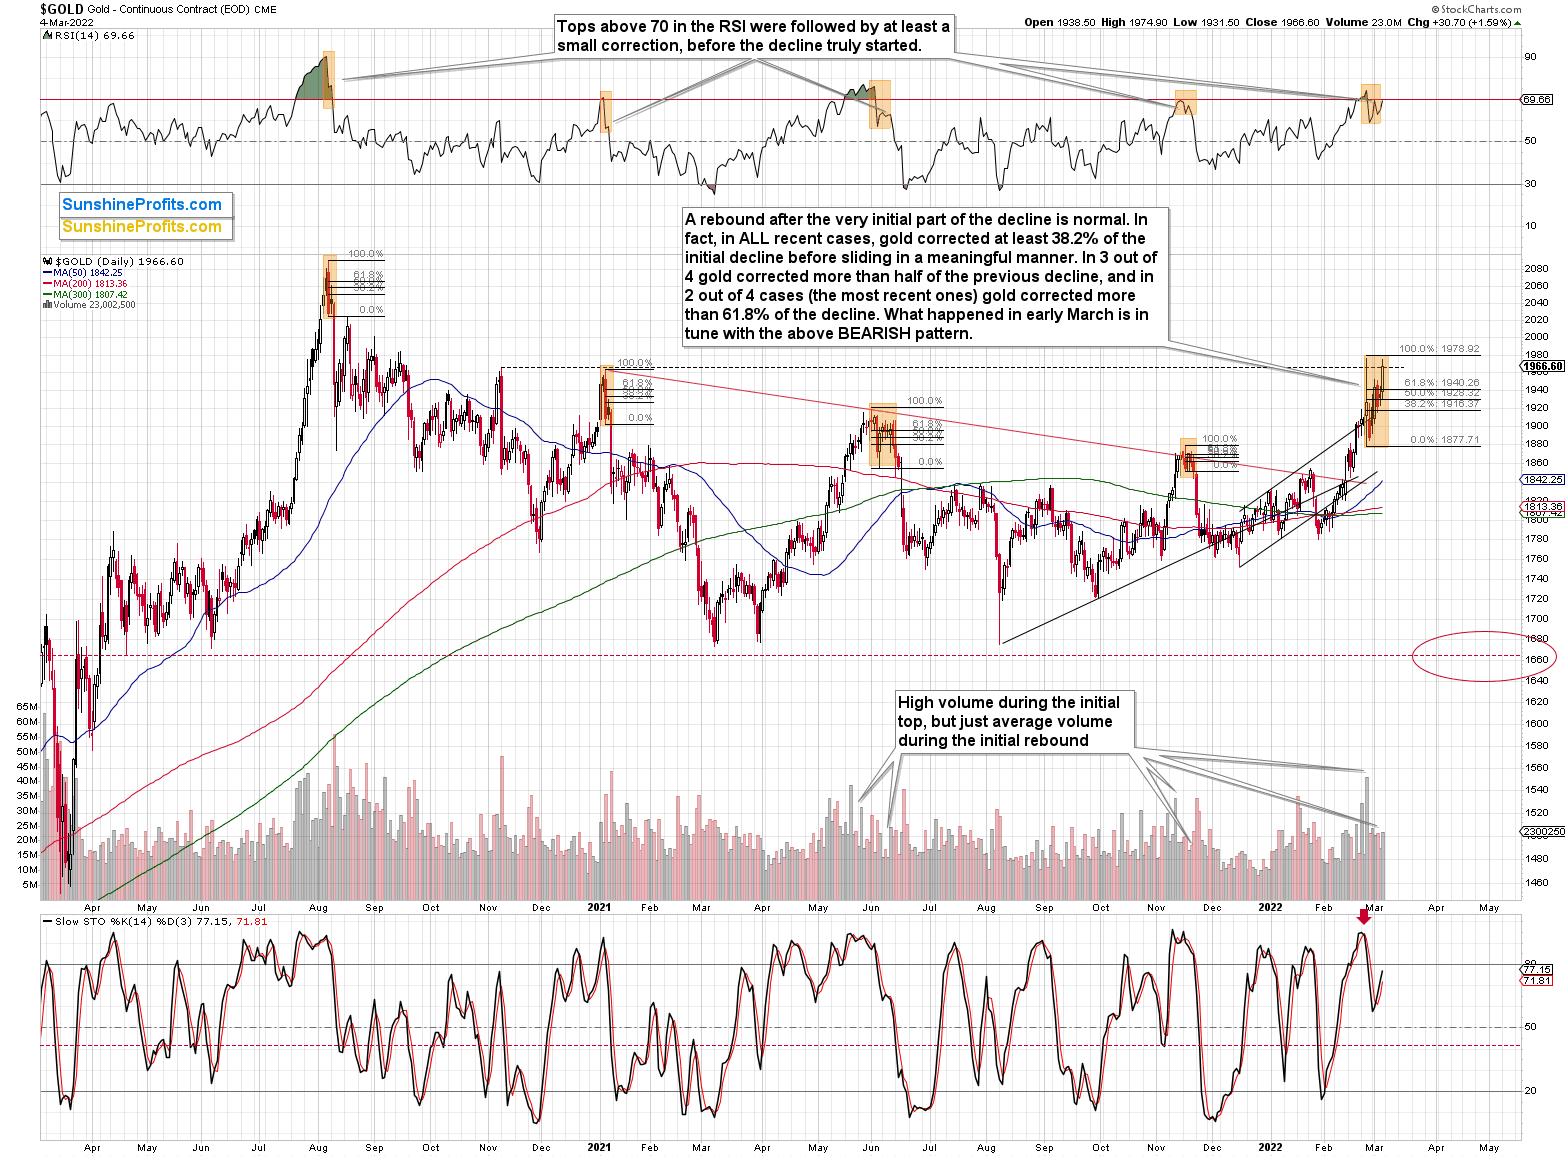
Gold touched $2,000 in today’s pre-market trading, which is barely above its 2021 high and below its 2020 high. Crude oil is way above both analogous levels.
In other words, gold underperforms crude oil to a significant extent, just like in 2003.
Interestingly, back in 2003, gold topped when crude oil rallied about 40% from its short-term lows (the late-2002 low).
What happened next in 2003? Gold declined, and the moment when crude oil started to visibly outperform gold was also the beginning of a big decline in gold stocks.
That makes perfect sense on the fundamental level too. Gold miners’ share prices depend on their profits (just like it’s the case with any other company). Crude oil at higher levels means higher costs for the miners (the machinery has to be fueled, the equipment has to be transported, etc.). When costs (crude oil could be viewed as a proxy for them) are rising faster than revenues (gold could be viewed as a proxy for them), miners’ profits appear to be in danger; and investors don’t like this kind of danger, so they sell shares. Of course, there are many more factors that need to be taken into account, but I just wanted to emphasize one way in which the above-mentioned technical phenomenon is justified. The above doesn’t apply to silver as it’s a commodity, but it does apply to silver stocks.
Back in 2003, gold stocks wiped out their entire war-concern-based rally, and the biggest part of the decline took just a bit more than a month. Let’s remember that back then, gold stocks were in a very strong medium- and long-term uptrend. Right now, mining stocks remain in a medium-term downtrend, so their decline could be bigger – they could give away their war-concern-based gains and then decline much more.
Mining stocks are not declining profoundly yet, but let’s keep in mind that history rhymes – it doesn’t repeat to the letter. As I emphasized previously today, back in 2003 and 2002, the tensions were building for a longer time, and it was relatively clear in advance that the U.S. attack was going to happen. This time, Russia claimed that it wouldn’t attack until the very last minute before the invasion. Consequently, the “we have to act now” is still likely to be present, and the dust hasn’t settled yet – everything appears to be unclear, and thus the markets are not returning to their previous trends. Yet.
However, as history shows, that is likely to happen. Either immediately, or shortly, as crude oil is already outperforming gold.
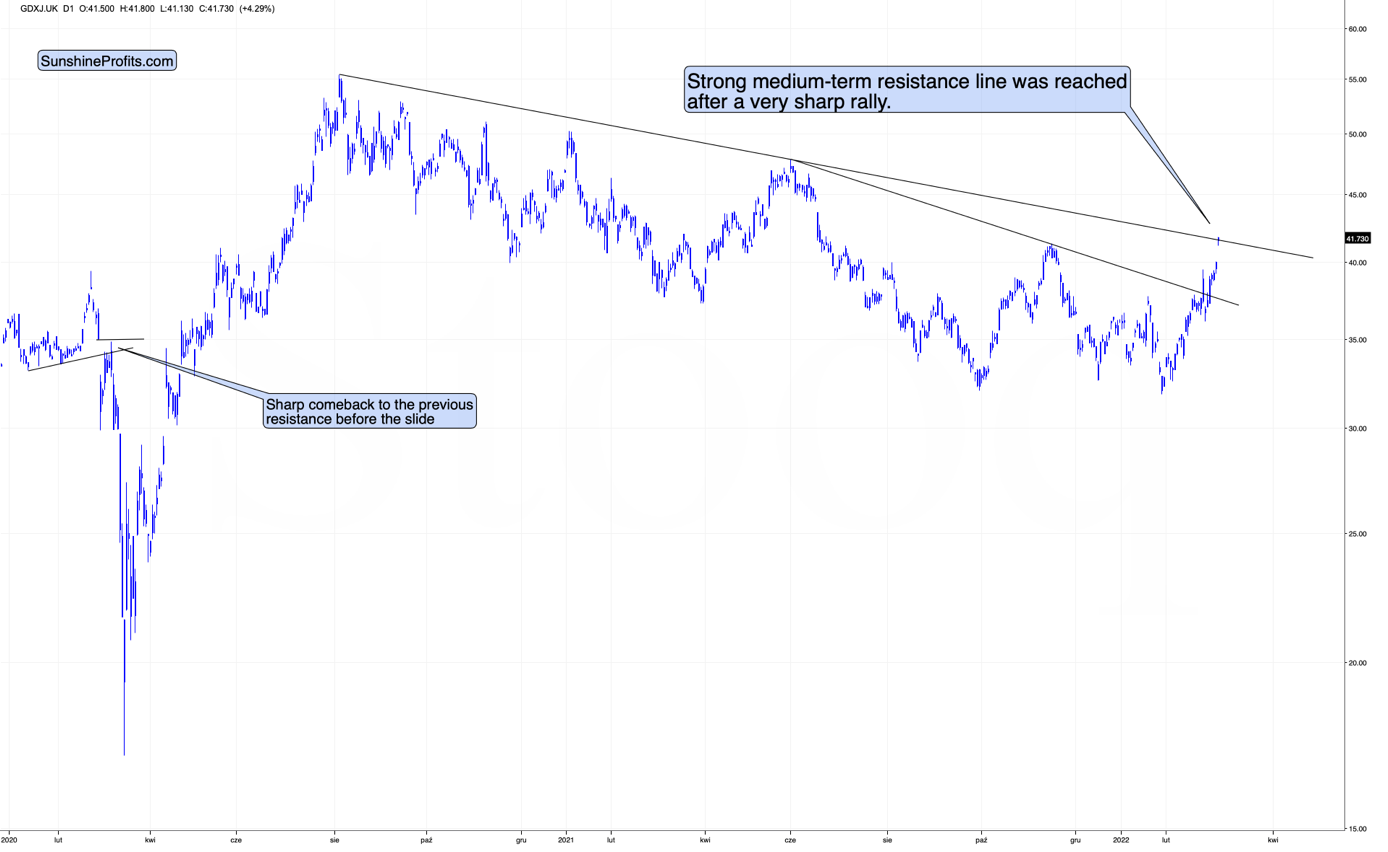
The above chart features the GDXJ ETF in its London trading. As you can see, the junior miners moved to their very strong resistance provided by the declining resistance line. This resistance seems to be analogous to the $2,000 level in gold.
By the way, please note that gold tried to break above $2,000 several times:
- twice in August 2020;
- twice in September 2020 (once moving above it, once moving just near this level);
- once in November 2020 (moving near this level);
- once in January 2021 (moving near this level);
- once in February 2022 (moving near this level).
These attempts failed in each of the 7 cases mentioned above. This is the eight attempt. Will this very strong resistance break this time?
Given how much crude oil has already soared, and how both markets used to react to war tensions in the case of oil-producing countries, it seems that the days of the rally are numbered.
Moving back to the GDXJ ETF, please note that while gold is moving close to its all-time highs, the junior miners are not doing anything like that. In fact, they barely moved slightly above their late-2021 high. They are not even close to their 2021 high, let alone their 2020 high. Instead, junior mining stocks are just a bit above their early-2020 high, from which their prices were more than cut in half in less than a month.
In other words, junior miners strongly underperform gold, which is a bearish sign. When gold finally declines – and it’s likely to, as geopolitical events tend to have only a temporary effect on prices, even if they’re substantial – junior miners will probably slide much more than gold.
One of the reasons is the likely decline in the general stock market.
I recently received a question about the impact the general stock market has on mining stocks, as the latter moved higher despite stocks’ decline in recent weeks. So, let’s take a look at a chart that will feature junior mining stocks, the GLD ETF, and the S&P 500 Index.
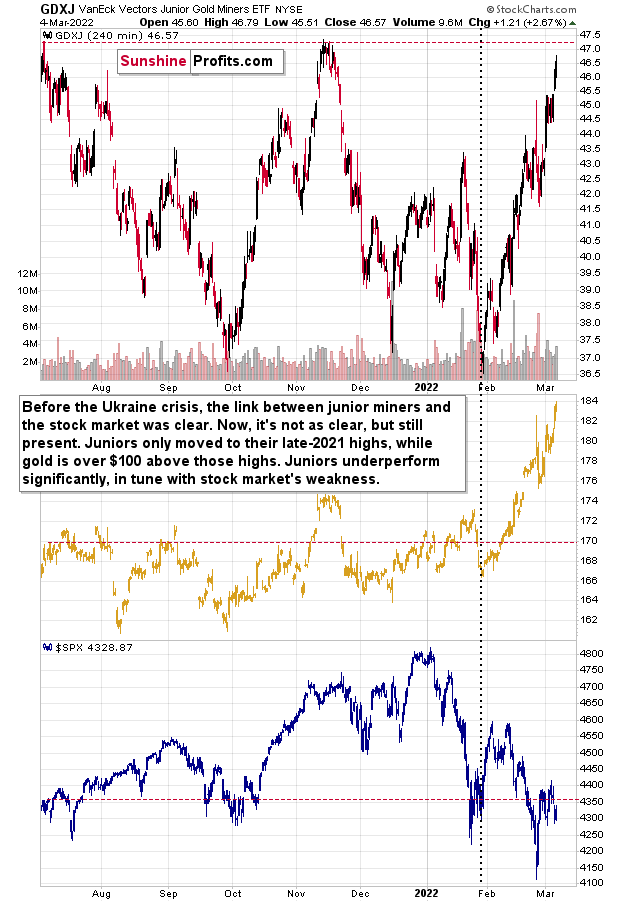
Before the Ukraine crisis, the link between junior miners and the stock market was clear. Now, it's not as clear, but it’s still present. Juniors only moved to their late-2021 highs, while gold is over $100 above those highs. Juniors underperform significantly, in tune with the stock market's weakness.
The gold price is still the primary driver of mining stock prices – including junior mining stocks. After all, that’s what’s either being sold by the company (that produces gold) or in the properties that the company owns and explores (junior miners). As gold prices exploded in the last couple of weeks, junior miners practically had to follow. However, this doesn’t mean that the stock market’s influence is not present nor that it’s going to be unimportant going forward.
Conversely, the weak performance of the general stock market likely contributed to junior miners’ weakness relative to gold – the former didn’t rally as much as the latter. Since the weakness in the general stock market is likely to continue, and gold’s rally is likely to be reversed (again, what happened in the case of other military conflicts is in tune with history, not against it), junior miners are likely to decline much more profoundly than gold.
Having said that, let’s take a look at the markets from a more fundamental point of view:
The Time Has Come
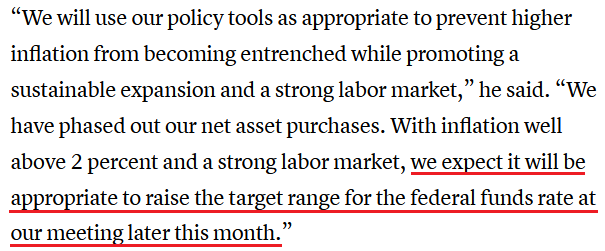
While the Russia-Ukraine conflict continues to garner all of investors’ attention, Fed Chairman Jerome Powell said on Mar. 2 that an interest rate hike at the Mar. 15/16 monetary policy meeting is likely a done deal.
Please see below:
 Source: CNBC
Moreover, while I’ve been warning for months that surging inflation would force the Fed’s hand, Powell admitted that the pricing pressures were “not as transitory as we had hoped.”
“Other mainstream economists and central banks around the world made the same mistake,” he said. “That doesn’t excuse it, but we thought these things would be resolved long ago.”
Likewise, if inflation persists, Powell said that larger rate hikes could materialize at subsequent meetings:
“We have an expectation that inflation will peak and begin to come down this year. To the extent inflation comes in higher or is more persistently high, (…) we would be prepared to move more aggressively by raising the federal funds rate by more than 25 basis points at a meeting or meetings.”
On top of that, New York Fed President John Williams (a major dove) echoed that sentiment on Mar. 3, adding: “we have the ability to adjust interest rates higher if inflation ends up being much more persistent or staying much higher than we expect or want.”
Thus, while the PMs remain distracted by the Russia-Ukraine drama, inflation has the Fed’s hawkish rhetoric morphing into hawkish policy. With the Fed’s tightening cycles often extremely unkind to gold, silver, and mining stocks, it could be a long way down if (once) the war premiums unwind.
To that point, the Fed released its latest Beige Book on Mar. 2, and as it relates to the “persistent” inflation that Williams and Powell referenced, the report revealed:
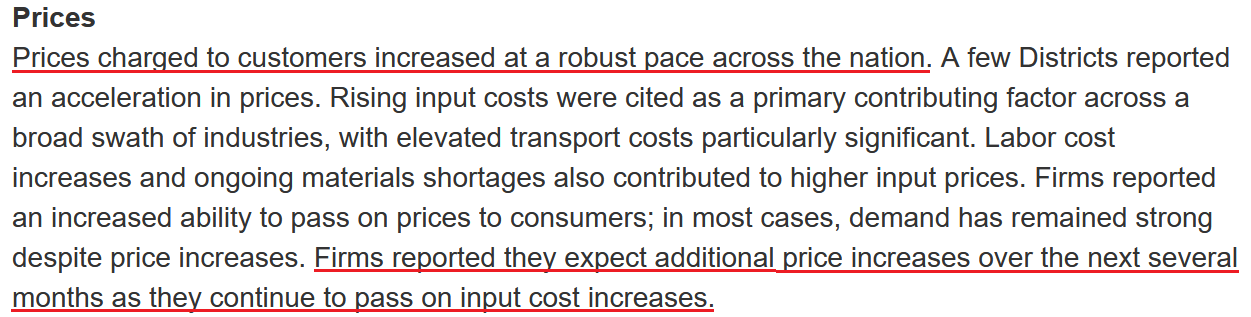 Source: U.S. Fed
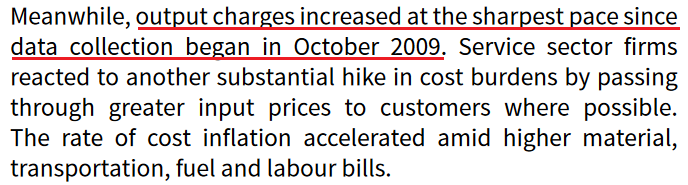
Furthermore, IHS Markit released its U.S. Services PMI on Mar. 3. With the headline index increasing from 51.2 in January to 56.5 in February, the report revealed that “supporting the overall upturn in output was the fastest increase in new business for seven months. Service providers largely attributed the expansion to greater demand from new and existing customers, with some noting an uptick in advanced ordering due to material and labor shortages.”
In addition:
“Greater new orders led to a steeper upturn in workforce numbers midway through the opening quarter of 2022. Firms were also keen to clear backlogs of work, which continued to expand. The rate of job creation was strong overall and quickened to the sharpest since last May.”
If that wasn’t enough:
“The degree of confidence in the outlook regarding output for the coming year was the highest since November 2020. Alongside hopes of further upticks in client demand, companies noted that opportunities for growth are likely to increase following the easing of travel restrictions and the waning impact of the Omicron wave of COVID-19.”
Thus, with business activity and employment in the U.S. service sector recovering nicely, the data pours more fuel on the Fed’s hawkish fire. With “persistent” inflation still extremely abundant, the Fed’s rate hike cycle should intensify in the coming months.
Please see below:
 Source: IHS Markit
As further evidence, the U.S. labor market supports the Fed’s “maximum employment” mandate. For example, U.S. nonfarm payrolls increased by 678,000 on Mar. 4, versus 400,000 expected. With the COVID-19 recovery outperforming prior recessions, U.S. labor market strength signals further hawkish policy over the next few months.
Please see below:
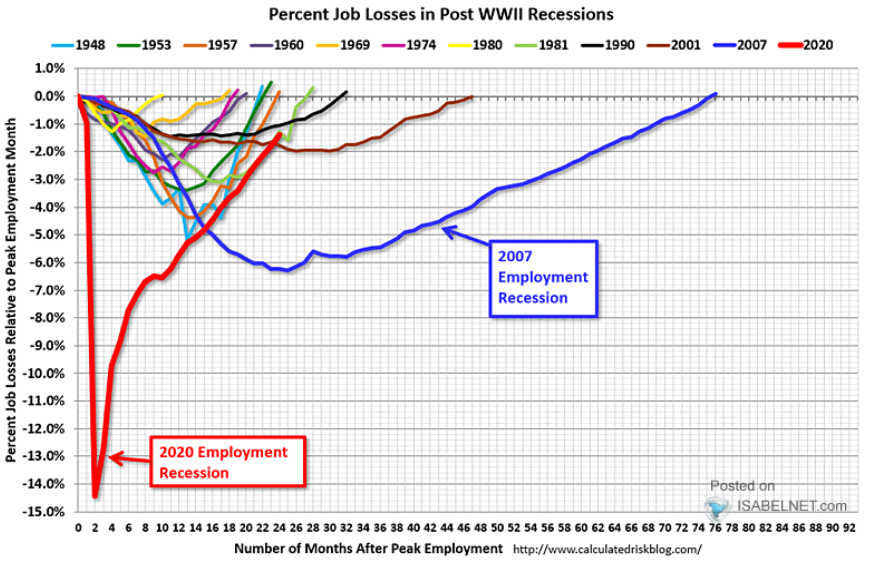
To explain, the various lines above track the number of months that it took the U.S. labor market to recover all of its losses during historical recessions. If you analyze the blue line above, you can see that the global financial crisis (GFC) resulted in a much longer recovery.
However, if you focus your attention on the red line above, you can see that the sharp drop in employment in 2020 has also resulted in a quick comeback. As such, the Fed's patience post-GFC isn't required this time around. Moreover, with inflation materially outperforming its post-GFC counterpart, the dual mandate makes the Fed's disposition much more hawkish now than it was then.
Thus, once the PMs shift their attention away from the Russia-Ukraine conflict and realize that lower-for-longer interest rates are no longer apparent, the wake-up call will likely result in profound drawdowns.
Continuing the theme, with inflation and employment accounted for and the Services PMI signaling renewed economic optimism, seasonality is also an important variable. With the warmer weather approaching, the Omicron variant fading, and many regions eliminating their COVID-19 policies, the cocktail is bullish for U.S. economic growth.
To explain, I wrote on Feb. 17:
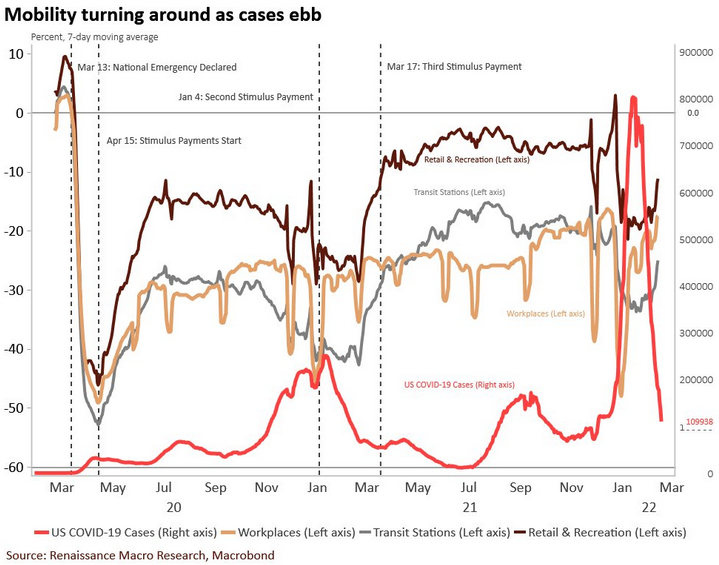
The red line above tracks U.S. COVID-19 cases, while the light brown, gray and dark brown lines above track workplace, transit and retail mobility. If you analyze the connection, you can see that the other three lines often fall when the red line rises. In a nutshell: rising coronavirus cases increase consumers' anxiety and they often hunker down.
However, if you focus your attention on the right side of the chart, you can see that the sharp drop in the red line has coincided with material increases in the other three lines. As a result, consumers' movement is on the rise, and this supports economic growth.
Furthermore, if you analyze the behavior of the red line, you can see that the spring and summer months (roughly May to July) resulted in lower COVID-19 cases in 2020 and 2021. As a result, we're approaching a seasonal period where cases should decline, mobility should increase, and that should uplift economic data. And since strong data should elicit a hawkish response from the Fed, it's fundamentally bullish for U.S. Treasury yields and the USD Index and bearish for the PMs.
To that point, with U.S. GDP growth expected to remain above trend in 2022 and 2023, a realization will only enhance the Fed’s hawkish fervor.
Please see below:
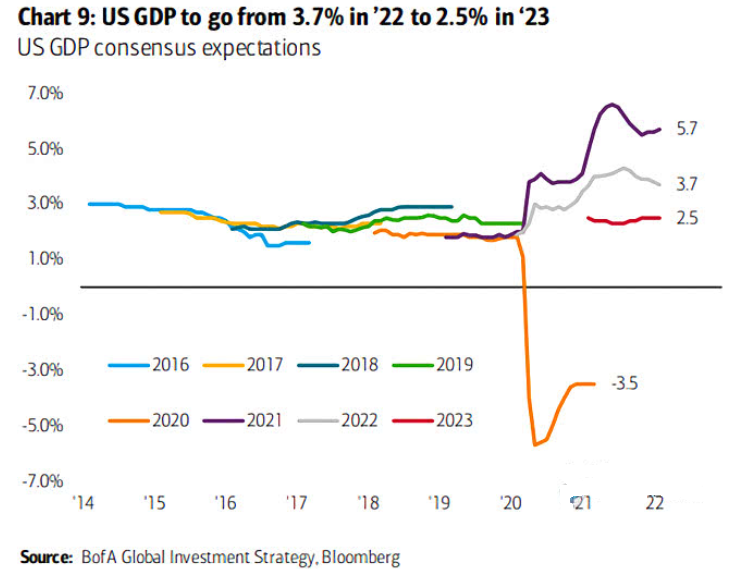
To explain, the various lines above track economists’ consensus GDP growth estimates. If you analyze the gray and red lines above, you can see that the median expectations are for 3.7% and 2.5% GDP growth, respectively, in 2022 and 2023. For context, the U.S. economy was growing at roughly 2% pre-COVID-19. As a result, several fundamental factors support further hawkish policy from the Fed.
Finally, since investors remain fixated on each new Russia-Ukraine headline, the PMs remain beneficiaries of any escalation. However, I warned on Mar. 3 that where we are in the current script is bearish, not bullish. I wrote:
Gold has recorded an intraday trough-to-peak rally of 11%. And with the spike-high-close-lower candle from Feb. 24 still holding as the intraday high, the yellow metal may have already reached its precipice.
Please see below:
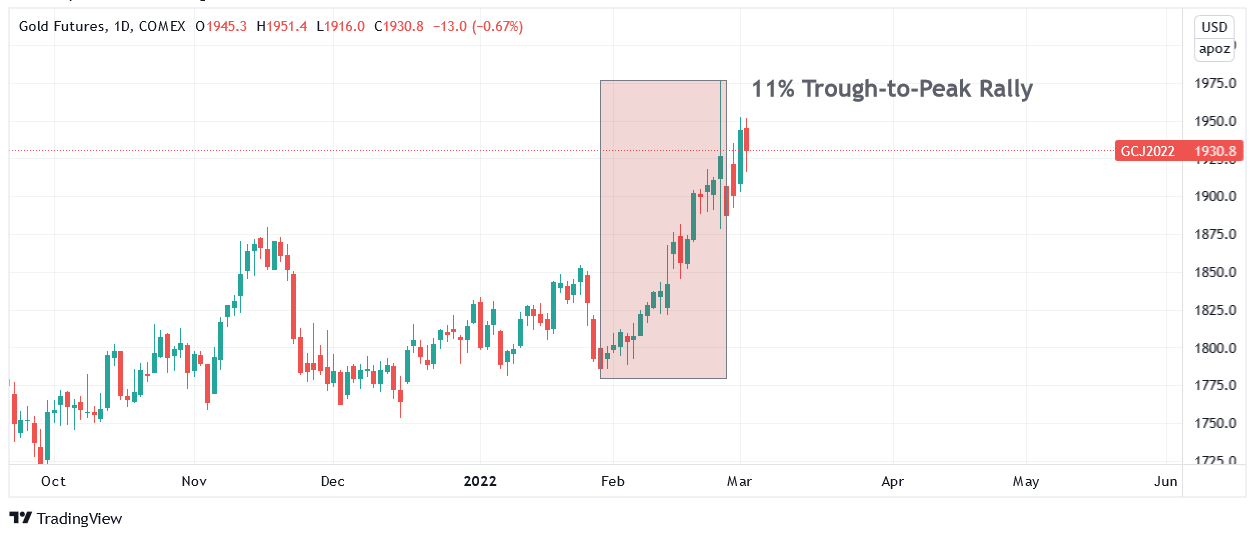
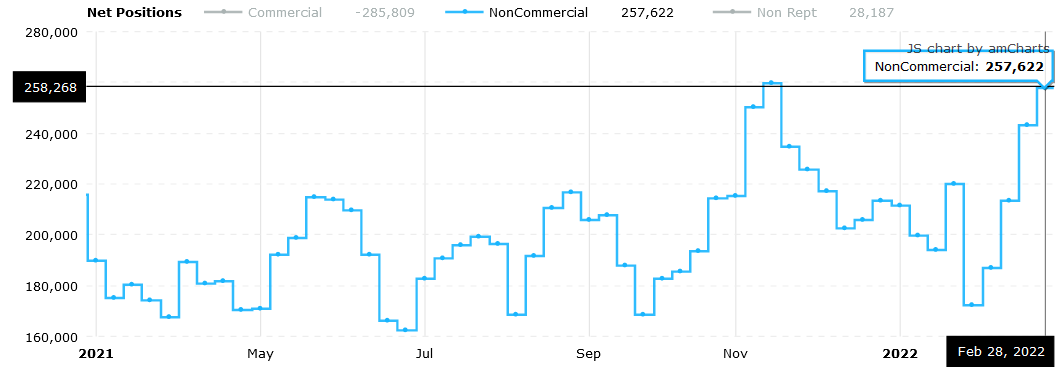
To that point, let's analyze how the price action and positioning in 2014 compares to 2022. As mentioned, gold futures' intraday trough-to-peak rallies are quite similar. Moreover, the behavior of speculative futures traders is nearly identical. For example, with investors tripping over themselves to go long the yellow metal, speculative net-futures positioning has spiked since the beginning of February. And since momentum begets momentum, the crisis narrative has investors piling into gold futures like in 2014.
For context, the data below depicts speculators' positioning as of the week ended Feb 25. And since Russian commercial banks were sanctioned and cut off from SWIFT, and the Russian central bank was isolated from the global monetary system during the weekend of Feb. 26-27, speculators' net positions could be even higher now.
However, the important point is that positioning is a contrarian indicator that highlights how it's often a bearish development when investors race to board gold's train.
Please see below:
 Source: COT report
To provide another update, new data was released on Mar. 4, and with speculative net-futures positioning rising once again, the bearish analog remains alive and well. Moreover, if you compare the November spike in speculative net-futures positioning to gold’s November peak on the price chart above, it’s another sign that we’re likely closer to the top than the bottom.
 Source: COT report
In conclusion, the PMs rallied on Mar. 4, as the Russia-Ukraine conflict continued to support sentiment. However, with war premiums present, optimism abundant, speculative net-futures positioning near its November peak, and the Fed about to begin its rate hike cycle, overzealous investors may find out the hard way that it’s dangerous to be long the PMs when these factors collide.
Overview of the Upcoming Part of the Decline
- It seems to me that the corrective upswing is now over or very close to being over , and that gold, silver, and mining stocks are now likely to continue their medium-term decline.
- It seems that the first (bigger) stop for gold will be close to its previous 2021 lows, slightly below $1,700. Then it will likely correct a bit, but it’s unclear if I want to exit or reverse the current short position based on that – it depends on the number and the nature of the bullish indications that we get at that time.
- After the above-mentioned correction, we’re likely to see a powerful slide, perhaps close to the 2020 low ($1,450 - $1,500).
- If we see a situation where miners slide in a meaningful and volatile way while silver doesn’t (it just declines moderately), I plan to – once again – switch from short positions in miners to short positions in silver. At this time, it’s too early to say at what price levels this could take place, and if we get this kind of opportunity at all – perhaps with gold close to $1,600.
- I plan to exit all remaining short positions once gold shows substantial strength relative to the USD Index while the latter is still rallying. This may be the case with gold close to $1,350 - $1,400. I expect silver to fall the hardest in the final part of the move. This moment (when gold performs very strongly against the rallying USD and miners are strong relative to gold after its substantial decline) is likely to be the best entry point for long-term investments, in my view. This can also happen with gold close to $1,375, but at the moment it’s too early to say with certainty.
- As a confirmation for the above, I will use the (upcoming or perhaps we have already seen it?) top in the general stock market as the starting point for the three-month countdown. The reason is that after the 1929 top, gold miners declined for about three months after the general stock market started to slide. We also saw some confirmations of this theory based on the analogy to 2008. All in all, the precious metals sector is likely to bottom about three months after the general stock market tops.
- The above is based on the information available today, and it might change in the following days/weeks.
You will find my general overview of the outlook for gold on the chart below:
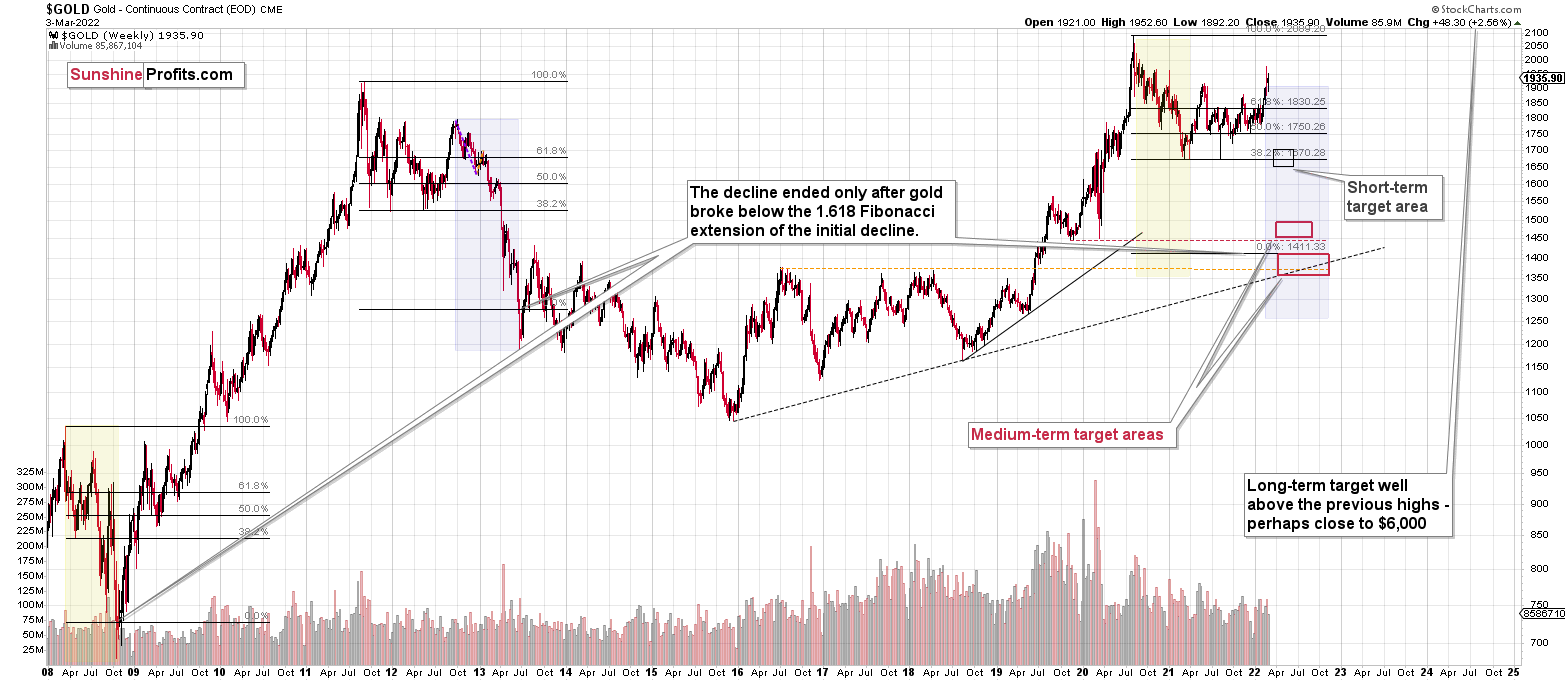
Please note that the above timing details are relatively broad and “for general overview only” – so that you know more or less what I think and how volatile I think the moves are likely to be – on an approximate basis. These time targets are not binding or clear enough for me to think that they should be used for purchasing options, warrants or similar instruments.
Summary
Summing up, despite last week’s rally in gold, the outlook for junior mining stocks remains exactly as I described previously.
Crude oil’s extreme outperformance, the stock market’s weakness, and critical medium-term resistance levels reached by gold and junior mining stocks all indicate that the tops are at hand or have just formed.
It looks like “peak uncertainty” and “peak gold” are already here or very, very close. It’s even more likely that the top in junior mining stocks is in.
Investing and trading are difficult. If it was easy, most people would be making money – and they’re not. Right now, it’s most difficult to ignore the urge to “run for cover” if you physically don’t have to. The markets move on “buy the rumor and sell the fact.” This repeats over and over again in many (all?) markets, and we have direct analogies to similar situations in gold itself. Junior miners are likely to decline the most, also based on the massive declines that are likely to take place (in fact, they have already started) in the stock markets.
From the medium-term point of view, the two key long-term factors remain the analogy to 2013 in gold and the broad head and shoulders pattern in the HUI Index. They both suggest much lower prices ahead.
It seems that our profits from short positions are going to become truly epic in the coming months.
After the sell-off (that takes gold to about $1,350-$1,500), I expect the precious metals to rally significantly. The final part of the decline might take as little as 1-5 weeks, so it's important to stay alert to any changes.
Most importantly, please stay healthy and safe. We made a lot of money last March and this March, and it seems that we’re about to make much more in the upcoming decline, but you have to be healthy to enjoy the results.
As always, we'll keep you - our subscribers - informed.
To summarize:
Trading capital (supplementary part of the portfolio; our opinion): Full speculative short positions (300% of the full position) in junior mining stocks are justified from the risk to reward point of view with the following binding exit profit-take price levels:
Mining stocks (price levels for the GDXJ ETF): binding profit-take exit price: $34.63; stop-loss: none (the volatility is too big to justify a stop-loss order in case of this particular trade)
Alternatively, if one seeks leverage, we’re providing the binding profit-take levels for the JDST (2x leveraged) and GDXD (3x leveraged – which is not suggested for most traders/investors due to the significant leverage). The binding profit-take level for the JDST: $14.98; stop-loss for the JDST: none (the volatility is too big to justify a SL order in case of this particular trade); binding profit-take level for the GDXD: $25.48; stop-loss for the GDXD: none (the volatility is too big to justify a SL order in case of this particular trade).
For-your-information targets (our opinion; we continue to think that mining stocks are the preferred way of taking advantage of the upcoming price move, but if for whatever reason one wants / has to use silver or gold for this trade, we are providing the details anyway.):
Silver futures downside profit-take exit price: $19.12
SLV profit-take exit price: $17.72
ZSL profit-take exit price: $38.28
Gold futures downside profit-take exit price: $1,683
HGD.TO – alternative (Canadian) inverse 2x leveraged gold stocks ETF – the upside profit-take exit price: $11.79
HZD.TO – alternative (Canadian) inverse 2x leveraged silver ETF – the upside profit-take exit price: $29.48
Long-term capital (core part of the portfolio; our opinion): No positions (in other words: cash
Insurance capital (core part of the portfolio; our opinion): Full position
Whether you already subscribed or not, we encourage you to find out how to make the most of our alerts and read our replies to the most common alert-and-gold-trading-related-questions.
Please note that we describe the situation for the day that the alert is posted in the trading section. In other words, if we are writing about a speculative position, it means that it is up-to-date on the day it was posted. We are also featuring the initial target prices to decide whether keeping a position on a given day is in tune with your approach (some moves are too small for medium-term traders, and some might appear too big for day-traders).
Additionally, you might want to read why our stop-loss orders are usually relatively far from the current price.
Please note that a full position doesn't mean using all of the capital for a given trade. You will find details on our thoughts on gold portfolio structuring in the Key Insights section on our website.
As a reminder - "initial target price" means exactly that - an "initial" one. It's not a price level at which we suggest closing positions. If this becomes the case (like it did in the previous trade), we will refer to these levels as levels of exit orders (exactly as we've done previously). Stop-loss levels, however, are naturally not "initial", but something that, in our opinion, might be entered as an order.
Since it is impossible to synchronize target prices and stop-loss levels for all the ETFs and ETNs with the main markets that we provide these levels for (gold, silver and mining stocks - the GDX ETF), the stop-loss levels and target prices for other ETNs and ETF (among other: UGL, GLL, AGQ, ZSL, NUGT, DUST, JNUG, JDST) are provided as supplementary, and not as "final". This means that if a stop-loss or a target level is reached for any of the "additional instruments" (GLL for instance), but not for the "main instrument" (gold in this case), we will view positions in both gold and GLL as still open and the stop-loss for GLL would have to be moved lower. On the other hand, if gold moves to a stop-loss level but GLL doesn't, then we will view both positions (in gold and GLL) as closed. In other words, since it's not possible to be 100% certain that each related instrument moves to a given level when the underlying instrument does, we can't provide levels that would be binding. The levels that we do provide are our best estimate of the levels that will correspond to the levels in the underlying assets, but it will be the underlying assets that one will need to focus on regarding the signs pointing to closing a given position or keeping it open. We might adjust the levels in the "additional instruments" without adjusting the levels in the "main instruments", which will simply mean that we have improved our estimation of these levels, not that we changed our outlook on the markets. We are already working on a tool that would update these levels daily for the most popular ETFs, ETNs and individual mining stocks.
Our preferred ways to invest in and to trade gold along with the reasoning can be found in the how to buy gold section. Furthermore, our preferred ETFs and ETNs can be found in our Gold & Silver ETF Ranking.
As a reminder, Gold & Silver Trading Alerts are posted before or on each trading day (we usually post them before the opening bell, but we don't promise doing that each day). If there's anything urgent, we will send you an additional small alert before posting the main one.
Thank you.
Przemyslaw Radomski, CFA
Founder, Editor-in-chief

