
tools spotlight

-
Gold: The S&P 500 Stirs the Pot
October 22, 2021, 8:42 AMWith the S&P 500 back at its all-time highs, gold stopped lagging behind. However, how long can this unsustainable growth last?
The FOMO Rally
While the S&P 500 has demonstrated a resounding ability to shake off bad news, an epic divergence has developed between positioning and economic expectations. And while ‘fear of missing out’ (FOMO) keeps sentiment near the high-end of its range, Q3 GDP growth is projected near the low-end of its range.
For example, while the Atlanta Fed’s third-quarter GDP growth estimate was north of 5% in early September, the bank reduced the estimate to 1.3% on Oct. 5. Moreover, with the outlook even worse now, the Atlanta Fed cut its Q3 GDP growth estimate to 0.5% on Oct. 19.
Please see below:
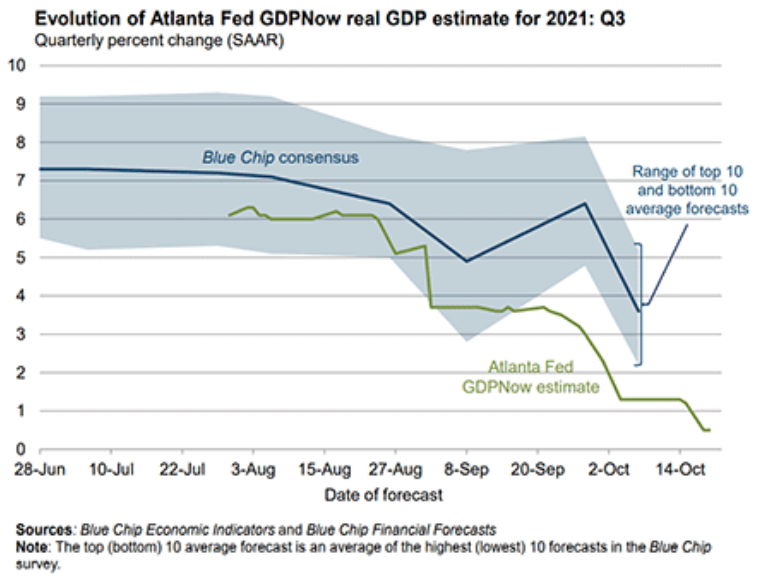
To explain, the blue line above tracks the Blue Chip consensus GDP growth estimate for the third quarter, and the shaded blue area represents the range of economists’ estimates. If you analyze the depth, you can see that economists expect a print in the ~2% to ~5.5% range. In stark contrast, the green line above tracks the Atlanta Fed’s GDPNow estimate – which has sunk like a stone and now implies 0.5% GDP growth in the third quarter.
What’s more, Bank of America also released its latest Global Fund Manager Survey on Oct. 19. And with institutional investors increasing their equity exposure when their economic expectations have turned negative for the first time in 18 months, FOMO is now on full display.
Please see below:
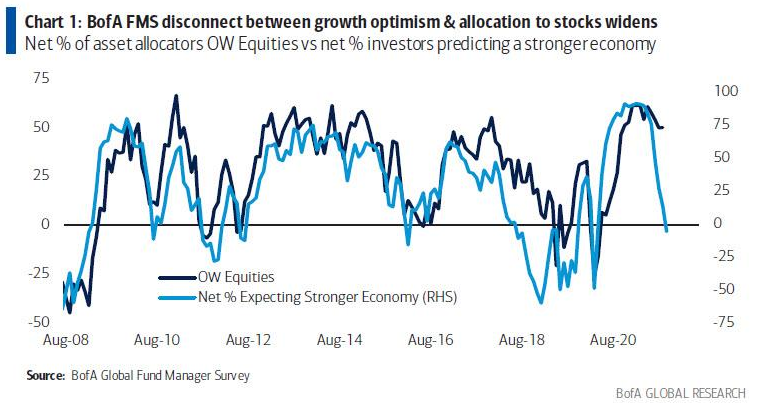
To explain, the dark blue line above tracks the net percentage of respondents that are overweight equities, while the light blue line above tracks the net percentage of respondents that expect stronger economic growth. If you analyze the right side of the chart, you can see that intuitional investors’ equity positioning still far exceeds what’s implied from economic growth prospects. As a result, if the dark blue line moves lower and reconnects with the light blue line, plenty of sell orders will hit the market.
On top of that, with stagflation fears now front and center, institutional investors are hitting the bid even when their better judgment tells them otherwise.
Please see below:
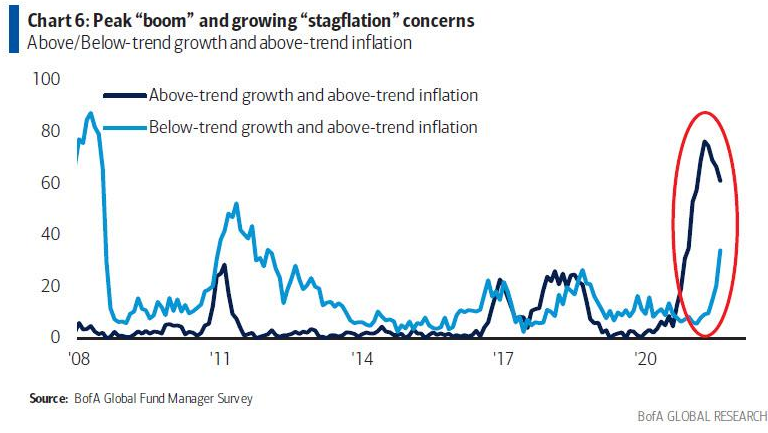
To explain, the dark blue line above tracks the net percentage of respondents that expect above-trend growth and above-trend inflation, while the light blue line above tracks the net percentage of respondents that expect below-trend growth and above-trend inflation. If you analyze the red circle on the right side of the chart, you can see that growth-with-inflation prophecies are losing momentum (the dark blue line), while fears of low growth and persistent inflation are increasing (the light blue line).
Will We See an Inflation Miracle?
Moreover, with the Fed stuck between a rock (high inflation) and a hard place (weak growth), the margin for error has dwindled and one policy mistake could bring down equities’ entire house of cards.
To that point, while I’ve been warning for months that the Fed was (and still is) materially behind the inflation curve, FOMC officials aren’t the only ones displaying inflationary anxiety.
Please see below:
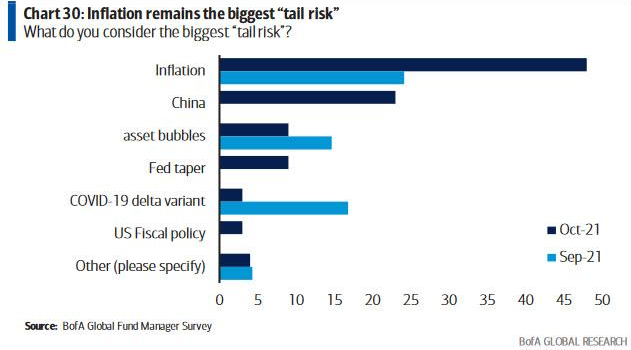
To explain, inflationary concerns have surged in October. And while the spread between institutional investors’ concerns over “Inflation” and the “Fed taper” is quite the oxymoron, persistent inflation makes another hawkish surprise even more likely. Moreover, with the death of QE unlikely to solve the inflationary conundrum on its own, the Fed will likely forecast further tightening in 2022.
To that point, slowly but surely, institutional investors are waking up to this reality. For context, Q3 earnings calls have been riddled with mentions of inflation and many CEOs that dabble in real goods have projected a further acceleration in 2022. As a result, with the “transitory” camp now suffering a death by a thousand cuts, it will likely take a miracle for the Fed’s 2022 inflation forecast to come to fruition.
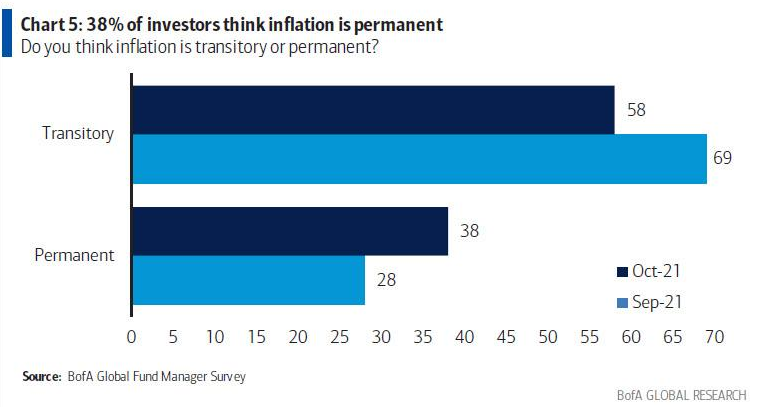
To explain, 69% (28%) of respondents viewed inflation as “transitory” (“permanent”) in September. However, the script has flipped to 58% and 38% in October. As a result, it’s likely only a matter of time before the majority of institutional investors (and the Fed) realize what’s actually happening on the ground.
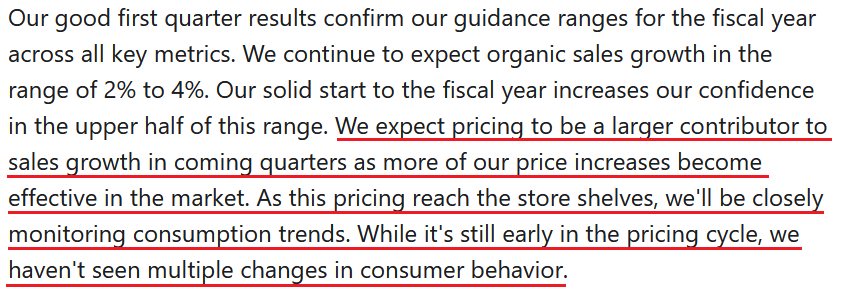
Case in point: Unilever – a consumer goods company with 149,000 employees and 400 brands that operates in more than 190 countries – released its third-quarter earnings on Oct. 21. CFO Graeme Pitkethly said that Q4 price increases should at least rival Q3 and extend into 2022:
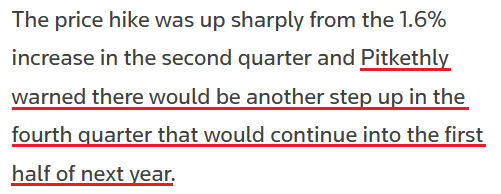 Source: Reuters
 Moreover, Unilever CEO Alan Jope told Bloomberg on Oct. 21:
“Peak inflation will be in the first half of 2022, and it will moderate as we move towards the second half…. We continue to responsibly take pricing, and that’s in relation to the very high levels of inflation we’re seeing.”
The S&P 500 Ahead of a Deep Correction
Furthermore, I highlighted on Oct. 21 that rising commodity prices over the last month should filter into the Commodity Producer Price Index (PPI) and headline Consumer Price Index (CPI) in the coming months.
I wrote:
The commodity PPI is a reliable leading indicator of the following month’s headline Consumer CPI. And if the former stays flat for the next three months (which is unlikely) – referencing releases in November 2021, December 2021 and January 2022 – the readings will still imply year-over-year (YoY) percentage increases in the headline CPI in the 4.75% to 5.50% range.
Furthermore, this is an extremely conservative forecast since the commodity PPI has increased month-over-month (MoM) for the last 17 months. Thus, it’s more likely that the headline CPI rises above 6% YoY than it falls below 4% YoY.
To that point, Union Pacific Railroad – a shipping company that operates 8,300 locomotives in 23 U.S. states – released its third-quarter earnings on Oct. 21. And with freight revenue up by 12% and average revenue per car up by 9%, EVP Kenny Rocker said that the results reflected “strong core pricing gains and higher fuel surcharge revenue.”
More importantly, though, with the input surge intensifying “over the last 30 days,” the cost-push inflationary spiral remains alive and well, and it signals something important.
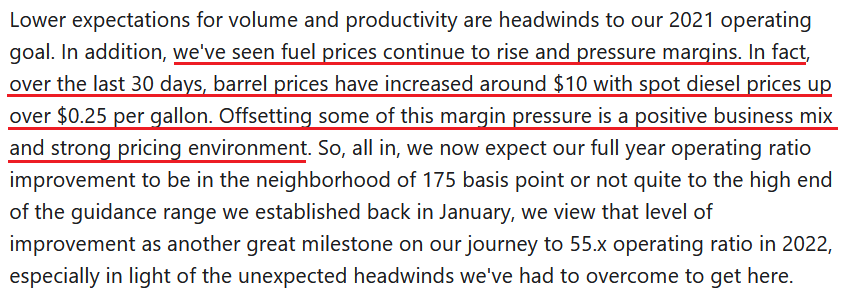 Source: Union Pacific Railroad/ The Motley Fool
Finally, the reason why inflation is so important in terms of its direct effect on the general stock market and its indirect effect on the PMs is due to the composition of the S&P 500. With information technology and communication services stocks accounting for roughly 39% of the S&P 500’s movement, deflationary assets have been the go-to source for returns since 2009. However, if the “transitory” narrative suffers a painful death, a material unwind could ensure.
Please see below:
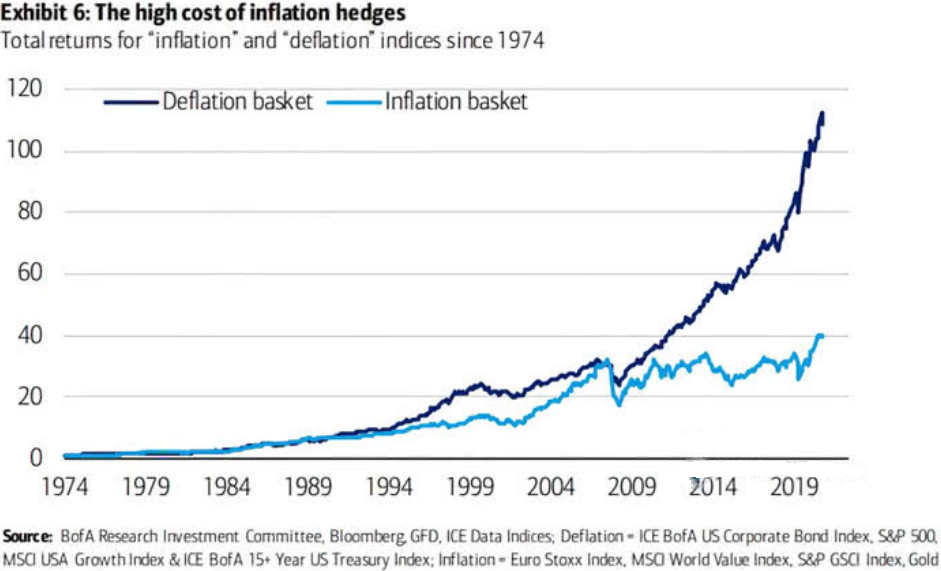
To explain, the “Deflation basket” (the dark blue line) has materially outperformed the “Inflation basket” (the light blue line) since the global financial crisis (GFC). Thus, if surging inflation encourages a reversion to the mean, immense volatility could strike the S&P 500.
The bottom line? With investors prioritizing FOMO over fundamentals, the general stock market’s recent uprising has helped uplift the PMs. However, with the Fed losing its inflation battle and the USD Index poised to benefit from more hawkish momentum over the next few months, a profound correction of the S&P 500 will only enhance the U.S. dollar’s already robust fundamentals. Moreover, with the PMs often moving inversely to the U.S. dollar, their performance should suffer along the way.
In conclusion, the PMs declined on Oct. 21, as the USD Index regained its mojo. Furthermore, the front-end of the U.S. yield curve surged (2-year yield up by 21% rounded), and the U.S. 10-Year Treasury yield closed at its highest level (1.7% rounded) since Apr. 4. Thus, while the PMs borrow confidence from the S&P 500, their fundamentals are actually deteriorating rather quickly.
Thank you for reading our free analysis today. Please note that the above is just a small fraction of the full analyses that our subscribers enjoy on a regular basis. They include multiple premium details such as the interim targets for gold and mining stocks that could be reached in the next few weeks. We invite you to subscribe now and read today’s issue right away.
Sincerely,
Przemyslaw Radomski, CFA
Founder, Editor-in-chief -
Inflation? Don’t Tell Me You Bought the Fed’s Narrative!
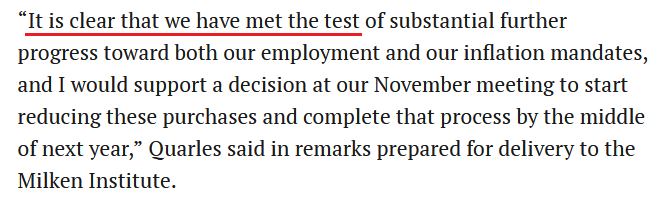
October 21, 2021, 8:43 AMWith inflation surging and the Fed in the midst of a crisis of confidence, Fed Governor Randal Quarles (a voting FOMC member) said on Oct. 20 that there are now “significant upside risks” to inflation and that “there is evidence in the past couple of months that a broader range of prices are beginning to increase at moderate rates.”
“If those dynamics should lead this ‘transitory’ inflation to continue too long, it could affect the planning of households and businesses and unanchor their inflation expectations,” he said. “This could spark a wage-price spiral that would not settle down even when the logistical bottlenecks and supply chain kinks have eased.”
More importantly, though:
 Source: Reuters
 As a result, while a November taper announcement is likely a done deal, Quarles reassured that “I do not see the [Fed] as behind the curve” and “I am confident that the monetary policy tools at our disposal can bring inflation down toward our 2% goal.”
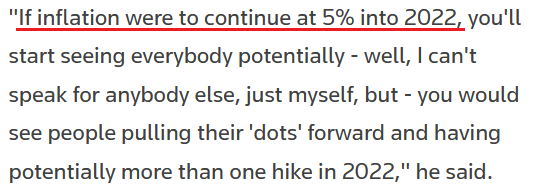
However, while investors still underestimate the hawkish implications of a completed taper “by the middle of next year,” the Fed still underestimates its inflationary problem. To explain, Fed Governor Christopher Waller (another voting FOMC member) said the following about inflation on Oct. 19:
 Source: Reuters
Well, while Quarles remains confident that the Fed’s tools “can bring inflation down toward our 2% goal,” unless the Fed turns the dial up a few more notches, its current hawkish stance isn’t nearly hawkish enough.
For example, the Commodity Producer Price Index (PPI) is a reliable leading indicator of the following month’s headline Consumer Price Index (CPI). And if the former stays flat for the next three months (which is unlikely) – referencing releases in November 2021, December 2021 and January 2022 – the readings will still imply year-over-year (YoY) percentage increases in the headline CPI in the 4.75% to 5.50% range.
Furthermore, this is an extremely conservative forecast since the commodity PPI has increased month-over-month (MoM) for the last 17 months. Thus, it’s more likely that the headline CPI rises above 6% YoY than it falls below 4% YoY.
Supporting this thesis, gasoline and crude oil futures prices have increased by 21.08% and 19.60% in the last month.
Please see below:
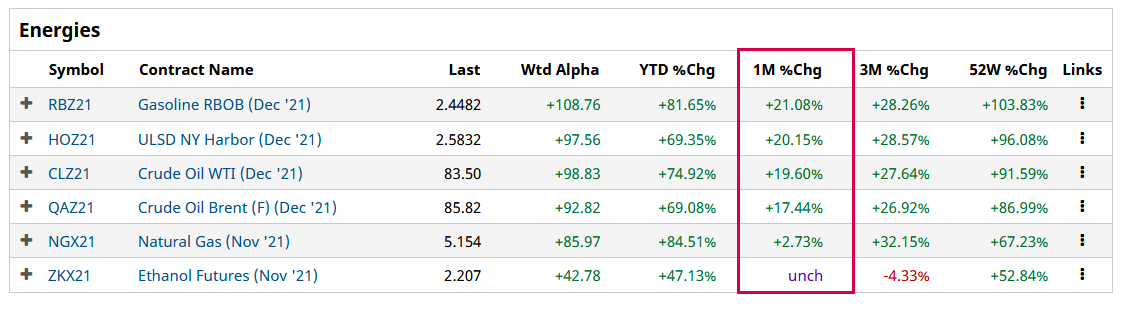 Source: Barchart.com
 Likewise, cotton, lumber and coffee futures prices have increased by 24.39%, 14.41% and 12.57% in the last month.
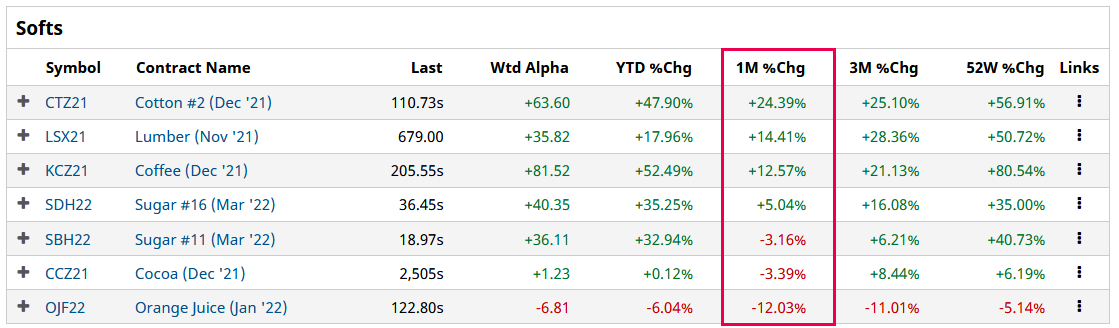 Source: Barchart.com
Furthermore, nearly all dairy and meat futures prices have increased in the last month:
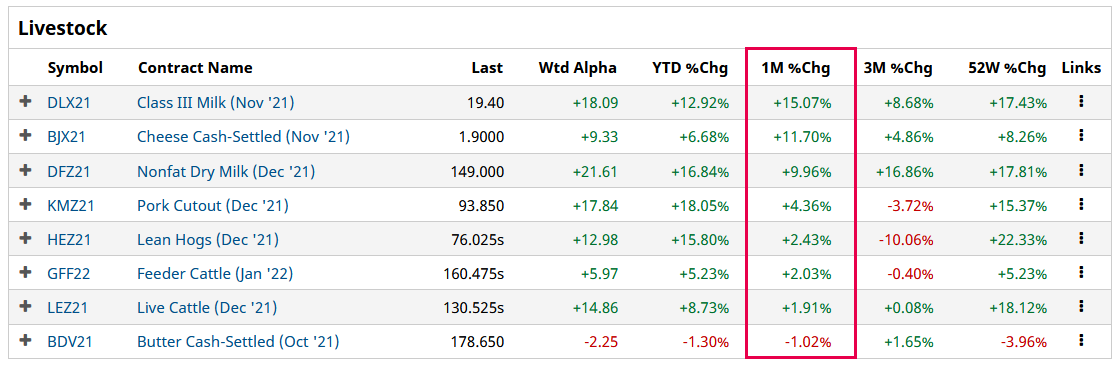 Source: Barchart.com
As a result, does it seem like the commodity PPI will decline MoM anytime soon?
To that point, Procter & Gamble (P&G) released its first-quarter earnings on Oct. 19. CFO Andre Schulten said during the company’s Q1 earnings call:
“Input costs have continued to rise since we gave our initial outlook for the year in late July. Based on current spot prices, we now estimate a $2.1 billion after-tax commodity cost headwind in fiscal 2022. Freight costs have also continued to increase. We now expect freight and transportation costs to be an incremental $200 million after-tax headwind in fiscal '22.”
More importantly, though:
 Source: P&G/The Motley Fool
Singing a similar tune, American Plastic Toys – which has manufactured toys in the U.S. since 1962 – expects abnormally high inflation to persist well into 2022. CEO John Gessert told CNBC on Oct. 18:
“It’s not going to be transitory.... I can’t imagine going back to the people that have stuck with us and saying, ‘OK, we’re going to take $1 out of your hourly wage.’ I just don’t see wage inflation retreating anytime soon.”
And what about commodity inflation?
“You have to go back to retailers and offer them an item that used to retail for $20 or $25 and it’s now retailing for $30 or $35, maybe even $40, depending on their margin requirements,” said Gessert.
Straight Talkers
Also making headlines, Danone – the world’s largest yogurt maker – projects that milk, packaging and transportation inflation will worsen in 2022:
“Like just about everyone across the sector and beyond, we see inflationary pressures across the board,” said CFO Juergen Esser. “What started as increased inflation on material costs evolved into widespread constraints impacting our supply chain in many parts of the world…. We expect 2022 at least at the same level as 2021, and maybe even higher. We need to get prepared for more supply-chain disruptions and challenges.”
For context, Danone experienced input-cost inflation of 7% in the first half of 2021 and expects that to increase to 9% in the back half of 2021.
Continuing the theme, Canadian National Railway (CN) – a North American transportation and logistics company that transports more than C$250 billion worth of goods annually across Canada and mid-America – released its third-quarter earnings on Oct. 19:
And with CN’s labor costs up by 12% YoY (“mostly driven by increased wages”) and fuel costs up by 40% (“driven by a nearly 50% increase in price”), how is the management dealing with the inflationary pressures?
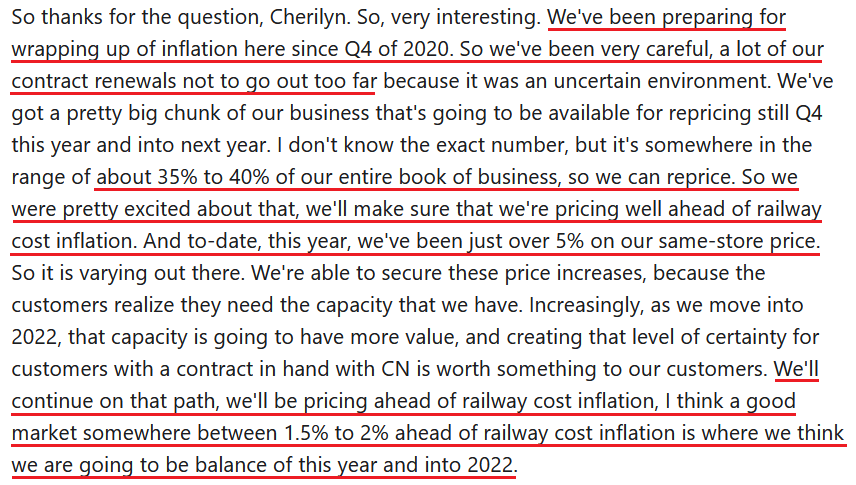 Source: CN/The Motley Fool
For context, the “railway cost inflation” that CN’s management is referencing pertains to the Association of American Railroads’ (AAR) All-Inclusive Index (which excludes fuel). In the latest quarterly release (on Sep. 16), AAR data showed that “railway cost inflation” increased by 0.81% quarter-over-quarter (QoQ) and by 7.4% YoY. Thus, if CN is pricing “ahead” of that (plus the additional fuel costs) in 2022, the Fed’s 2022 inflation target is likely wishful thinking.
Finally, to hear it straight from the horse’s mouth, the Fed released its latest Beige Book on Oct. 20. The report revealed:
“The majority of Districts reported robust wage growth. Firms reported increasing starting wages to attract talent and increasing wages for existing workers to retain them. Many also offered signing and retention bonuses, flexible work schedules, or increased vacation time to incentivize workers to remain in their positions.”
More importantly, though:
“Most Districts reported significantly elevated prices, fueled by rising demand for goods and raw materials. Reports of input cost increases were widespread across industry sectors, driven by product scarcity resulting from supply chain bottlenecks. Price pressures also arose from increased transportation and labor constraints as well as commodity shortages.
“Prices of steel, electronic components, and freight costs rose markedly this period. Many firms raised selling prices indicating a greater ability to pass along cost increases to customers amid strong demand. Expectations for future price growth varied with some expecting price to remain high or increase further while others expected prices to moderate over the next 12 months.”
The bottom line? While the deflationists have receded into the background and the Fed is hoping that 2022 will be kinder to its “transitory” narrative, inflation is still accelerating. And while the death of QE should help calm some of the fervor, an accelerated taper that concludes “by the middle of next year” is extremely bullish for the USD Index. Moreover, with the Fed still materially behind the inflation curve, hawkish whispers of further tightening should hit the wire in the coming months.
In conclusion, the PMs rallied on Oct. 20 as misguided narratives have helped underwrite their recent optimism. And while the USD Index seems like the odd man out in investors’ latest game of musical chairs, the greenback’s fundamentals are actually stronger now than they were in September (during the rally). As a result, the tables will likely turn over the next few months, and the PMs’ optimism should reverse sharply as the colder weather approaches.
Thank you for reading our free analysis today. Please note that the above is just a small fraction of the full analyses that our subscribers enjoy on a regular basis. They include multiple premium details such as the interim targets for gold and mining stocks that could be reached in the next few weeks. We invite you to subscribe now and read today’s issue right away.
Sincerely,
Przemyslaw Radomski, CFA
Founder, Editor-in-chief -
USDX, Gold, Silver: A Confluence of Signs This Week
October 20, 2021, 8:55 AMWith silver outperforming and key supports for the USDX holding, what’s in store for the precious metals in the upcoming months?
Yesterday’s session was informative. Very. I already indicated some of the specific developments during yesterday’s (pre-market) trading (and I talked about silver and bitcoin in another video as well), but having the closing prices, and knowing what happened on a day-to-day basis adds a new dimension to the signals that we saw.
Let’s jump into charts.
What Was So Important About Yesterday?
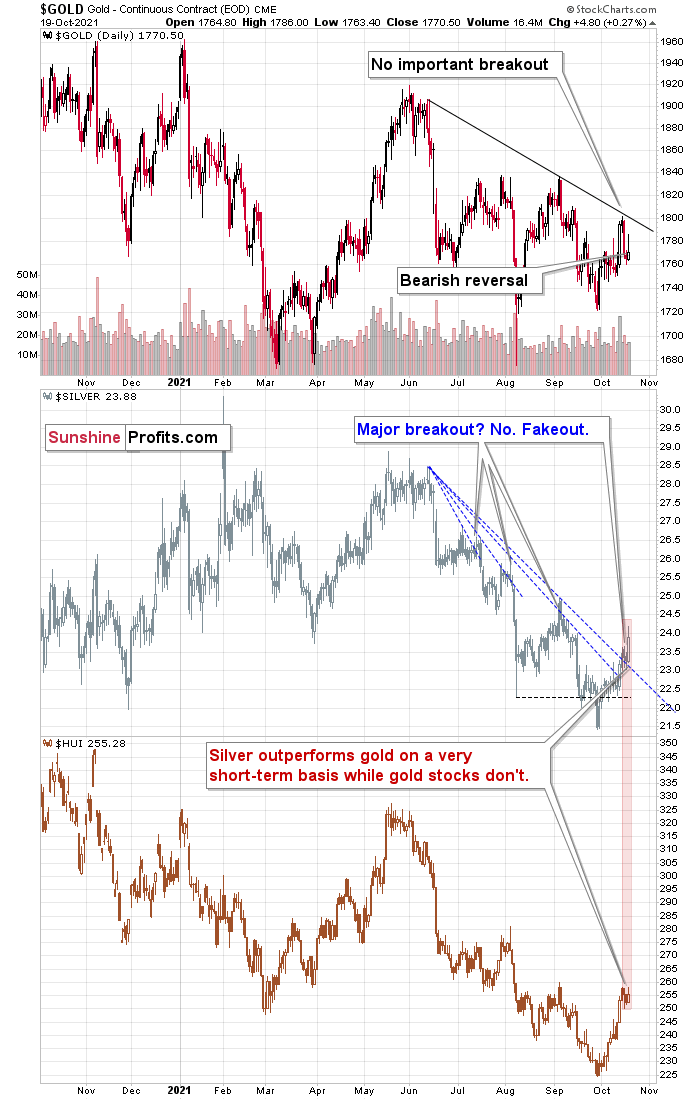
The key thing that happened yesterday was that silver rallied profoundly while gold stocks didn’t. The latter moved just a little higher, just like gold. This tells us that the rally has most likely either run its course completely or that its end is just around the corner. I’ve been emphasizing this many times before, but it’s so important (and so ignored) that I’m going to repeat it once again – silver tends to outperform in the final part of a rally in the precious metals market. This – by itself – is one of key indications that a top is just around the corner or that we have already seen one.
Yesterday’s daily reversal in gold only adds to the bearish implications of the session. Despite the attempt to move much higher, gold ended the day a mere $4.80 higher.
The key development, though, happened not in the precious metals market, but in the USD Index. Namely, the USD Index managed not to close back below the previous 2021 highs in terms of the closing prices.
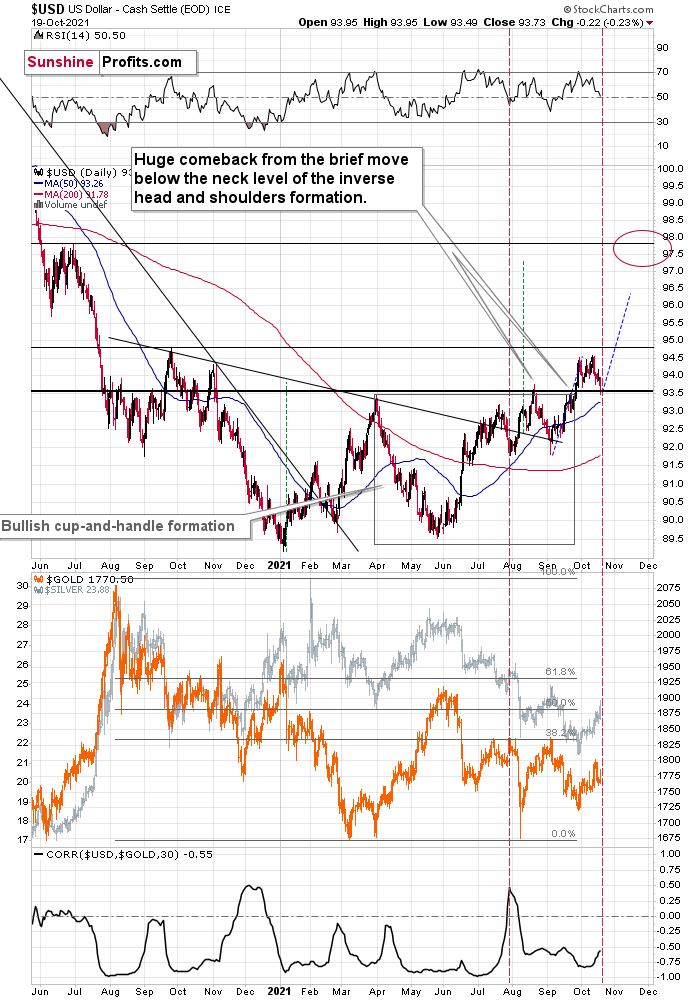
The U.S. currency did end the day lower, but it was after a recovery from a much bigger intraday decline. The August top in terms of the daily closing prices is 93.59, and while yesterday’s intraday lows was 93.49, the USDX closed the day at 93.73. The key support held and – obviously – that’s a bullish development for the USDX. Since the latter tends to move in the opposite way to the gold price and silver price, we can say that the above is bearish for the precious metals sector.
The lower part of the above charts shows the correlation between the USDX and gold (based on the previous 30 trading days) and as you can see, the correlation is almost always negative, and usually strongly negative – below -0.5.
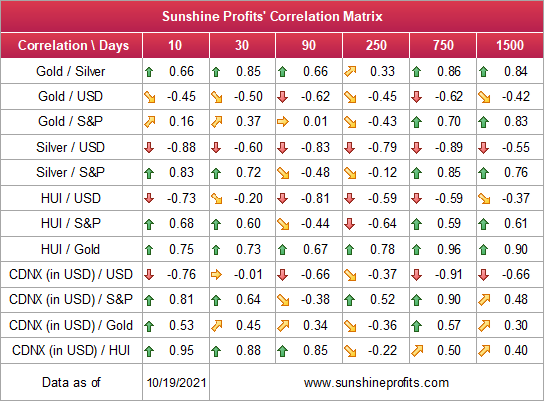
As you can see in the above Correlation Matrix (second row from the top), gold is negatively correlated with the USD Index also in the medium term and in the long term, so this link is quite stable, even though there are exceptions (for example, at times gold shows strength despite the USD’s rallies and it indicates great buying opportunities for gold).
The correlation now moved higher, but please note that we saw something similar (to an even bigger extent) in late July, and that was when gold and the USDX itself were performing similarly to what we saw recently. Even the RSI indicator (upper part of the chart) was close to 50 in both cases.
Gold and silver are slightly up in today’s pre-market trading, but it doesn’t change any of the above. The USD Index is still above the highest daily close that we saw in August.
Consequently, while yesterday’s session might have appeared to be something major, it turned out to be just a combination of factors that we saw at the final days of short-term rallies many times before. It seems that the medium-term downtrend will resume any day now.
Thank you for reading our free analysis today. Please note that the above is just a small fraction of the full analyses that our subscribers enjoy on a regular basis. They include multiple premium details such as the interim targets for gold and mining stocks that could be reached in the next few weeks. We invite you to subscribe now and read today’s issue right away.
Sincerely,
Przemyslaw Radomski, CFA
Founder, Editor-in-chief -
EUR/USD Tug-Of-War Poised to Affect Gold Prices
October 19, 2021, 9:07 AMWith a tug-of-war for USD Index supremacy unfolding at the 94 level, the PMs are anxiously awaiting the final outcome. And because the EUR/USD is the head of the dollar basket’s snake – due to the fact that the currency pair accounts for nearly 58% of the USD Index’s movement – confusion has arisen over why the euro is strengthening when its fundamental prospects are so weak.
Well, with short-term bursts of optimism par for the course, it’s important to remember that asset prices rarely move in a straight line. Moreover, when analyzed in the context of the EUR/USD’s YTD performance, the recent uptick is largely immaterial.
Please see below:
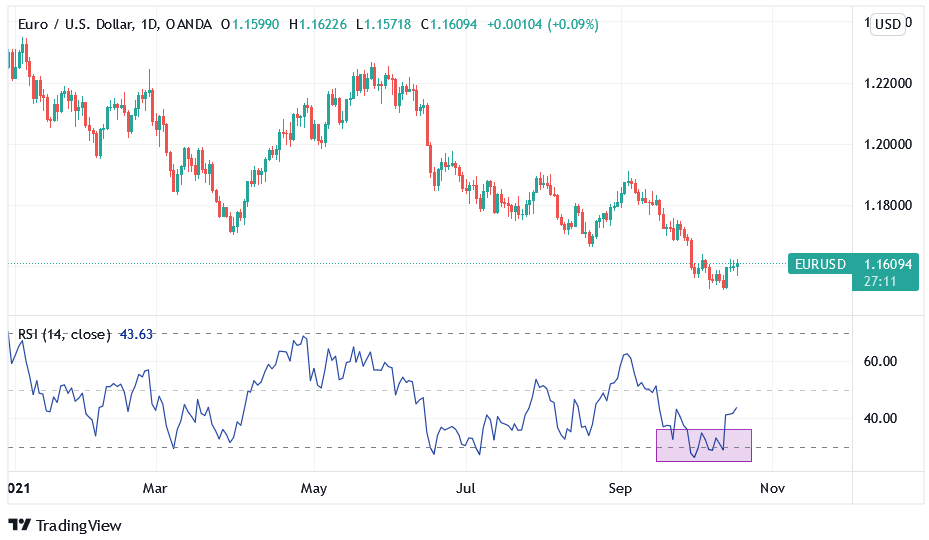
To explain, the candlestick chart above tracks the EUR/USD’s YTD movement. And with each enthusiastic rally eventually thwarted by fundamental realities, euro bulls have suffered mightily in 2021.
More importantly, though, if you analyze the shaded purple box on the bottom half of the chart, you can see that the EUR/USD’s RSI (Relative Strength Index) dipped below 30 (oversold conditions) and triggered a relief rally. Likewise, while similar oversold bounces occurred earlier in 2021, lower lows have plagued the currency pair throughout the year anyway. As a result, the small uptick has done nothing to dent our bearish medium-term (!) fundamental thesis for gold and silver.
To that point, the euro is the third-worst-performing currency within the USD Index YTD. For context, the SEK (not listed below) is the second-worst performer, but the USD/SEK only accounts for 4.2% of the USD Index’s movement.
Please see below:
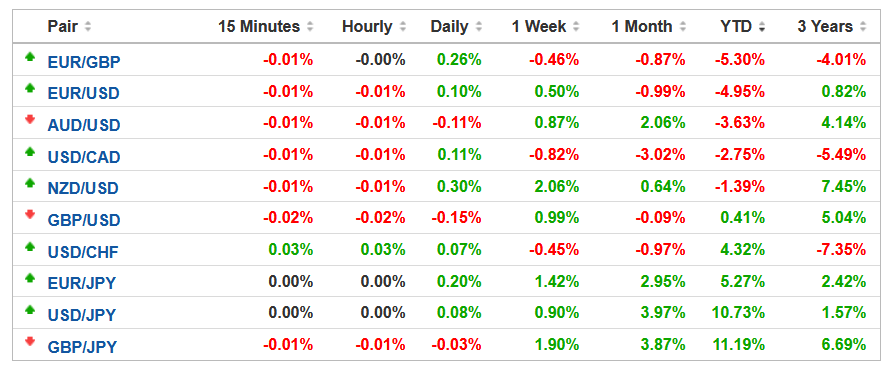 Source: Investing.com
To explain, if you analyze the column above labeled “YTD,” you can see that the EUR/USD has declined by 4.95% in 2021. Moreover, the USD/JPY (13.6% of the USD Index’s movement) holds the top spot, with the currency pair appreciating by 10.73% and implying that the JPY has depreciated by roughly 10% versus the U.S. dollar.
Furthermore, with the Fed poised to announce its taper timeline at its Nov. 2/3 policy meeting, and the ECB running in the opposite direction, a sharp decline in the Fed/ECB ratio should weigh on the EUR/USD over the medium term. For context, the Fed/ECB ratio has already declined by 3.75% in 2021.
To explain, I wrote on Oct. 15:
The Fed/ECB ratio – which measures the relative money printing of the two central banks – stands at roughly 1.02. And since 2015, if we exclude the EUR/USD’s outlier strength in 2017-2018, when the Fed/ECB ratio sunk below 1, the EUR/USD spent most of its time in the 1.100 to 1.150 range. Moreover, when the Fed/ECB ratio sunk to an all-time low of 0.81 in September 2019, the EUR/USD closed the week at 1.1029.
Please see below:
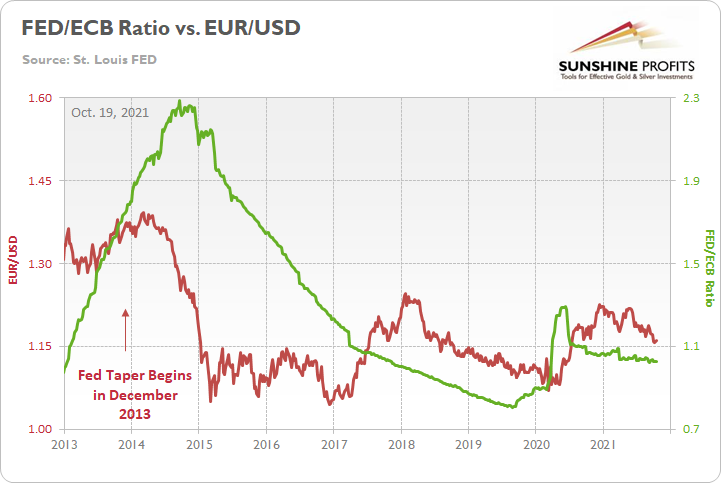
To explain, the red line above tracks the EUR/USD, while the green line above tracks the Fed/ECB ratio. If you focus your attention on the left side of the chart, the red arrow depicts when the Fed began reducing its bond-buying program in 2013. Moreover, if you analyze the performance of both variables, you can see that the EUR/USD fell off a cliff soon after and the Fed/ECB ratio plunged after a roughly 12-month delay.
However, unlike in 2013, this time around, the Fed/ECB ratio should decline immediately. And with the ratio likely to fall materially throughout 2022, the EUR/USD (excluding the abnormal strength that we witnessed in 2017-2018) has been unable to record lasting rallies when the ECB is outprinting the Fed. As a result, 1.1500 should break over the medium term, and assuming that the Fed/ECB ratio approaches its all-time low, the EUR/USD’s fair value likely lies in the 1.100 to 1.1250 range.
Circling back to the currency pairs’ performance chart, the GBP (11.9% of the USD Index’s movement) and the CAD (9.1% of the USD Index’s movement) have actually strengthened versus the U.S. dollar in 2021. For context, like the USD/JPY, the USD/CAD uses the U.S. dollar as the base currency and a YTD decline means that the Canadian dollar has strengthened.
What Do You Say, Canada?
To that point, while the Bank of England has turned hawkish and potential interest rate hikes put a fundamental floor under the GBP, the CAD is a different story. To explain, Canada is the fourth-largest oil-producing country in the world, and with WTI gunning for its ninth-straight week of weekly gains, rising oil prices have uplifted the Canadian dollar.
Please see below:
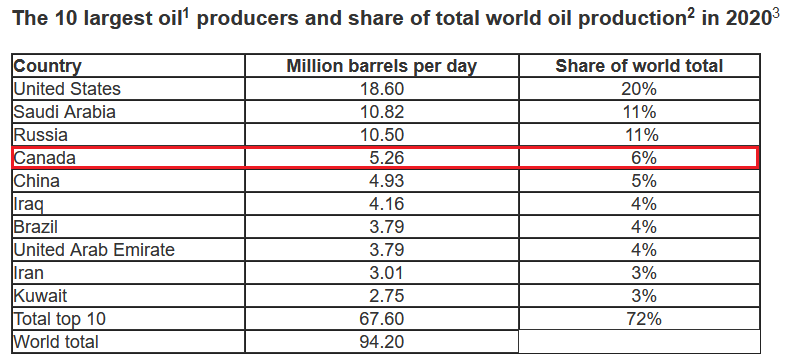 Source: the U.S. Energy Information Administration (EIA)
Conversely, while crude’s fervor is bullish for the Canadian dollar and bearish for the USD/CAD, a continuation of the theme is mutually exclusive to the Fed’s 2% inflation goal.
To explain, I wrote on Sep. 30:
Powell’s only hope to curb inflation is to strengthen the U.S. dollar and weaken commodity prices. For context, major futures contracts are priced in U.S. dollars. And when the dollar rallies, it’s more expensive for foreign buyers (in their currency) to purchase the underlying commodities. As a result, a stronger U.S. dollar often stifles demand. And with the current supply/demand dynamics favoring higher commodity prices, Powell will have to work his magic, strengthen the dollar and reduce commodities demand if he wants his inflation problem to subside.
Please see below:
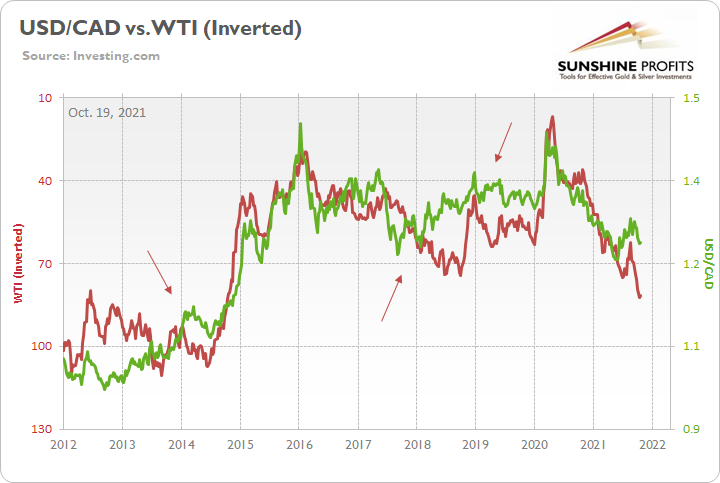
To explain, the green line above tracks the USD/CAD, while the red line above tracks the inverted WTI futures price. For context, inverted means that the latter’s scale is flipped upside down, and that a rising red line represents falling crude prices, while a falling red line represents rising crude prices. If you analyze the relationship, you can see that a stronger USD/CAD often stifles WTI’s bull markets.
To that point, if you focus your attention on the three red arrows, you can see that when the WTI rallied alongside the USD/CAD, the divergences ended with crude oil reversing sharply within three to nine months. As a result, with the Fed no longer ‘all in’ on “transitory” and a November taper announcement likely a done deal, the central bank needs the green line to rise to help calm the inflationary pressures. Thus, with a stronger USD/CAD poised to help Powell achieve his goal, his days of talking down the U.S. dollar are likely over.
As further evidence, the chart below demonstrates how the entire commodities complex makes a living off of a weaker U.S. dollar.
Please see below:
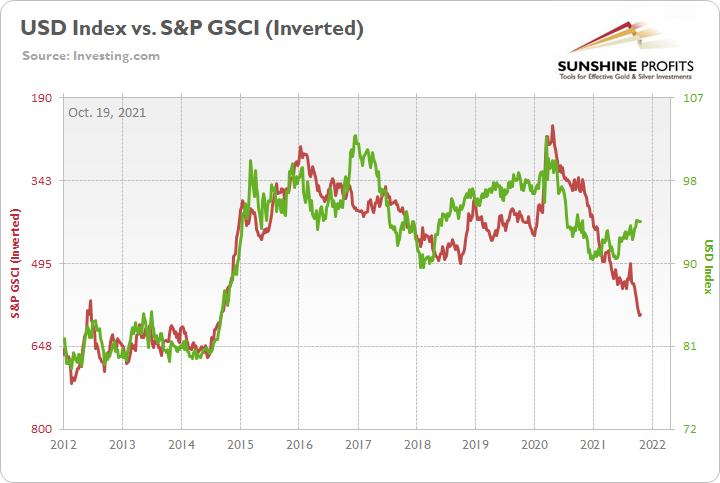
To explain, the green line above tracks the USD Index, while the red line above tracks the inverted S&P Goldman Sachs Commodity Index (S&P GSCI). For context, the S&P GSCI contains 24 commodities from all sectors: six energy products, five industrial metals, eight agricultural products, three livestock products and two precious metals. However, energy accounts for roughly 54% of the index’s movement.
If you analyze the relationship, you can see that a stronger USD Index often curbs commodity inflation. And while the S&P GSCI has surged in recent weeks, even as the USD Index has strengthened, the relationship has stood the test of time — the sharp rally (plunge) in the USD Index (S&P GSCI) in 2014-2015 is a cautionary tale of how quickly things can change.
The bottom line? If Powell allows the U.S. dollar to weaken, his inflationary problem will only intensify. Thus, not only does the greenback have technicals, fundamentals and sentiment (speculative futures positioning) on its side, but the Fed will likely become the U.S. dollar’s staunchest ally. And unless Fed officials want to see 6% and 7% year-over-year prints on the headline Consumer Price Index (CPI), their days of playing ‘PMs up, USD Index down’ are likely over.
In conclusion, the PMs traded in the red on Oct. 18 as U.S. Treasury yields rallied across much of the curve. And while the EUR/USD has strengthened in recent days, lower lows should still materialize over the medium term. Moreover, with the Fed’s taper announcement likely to commence in the coming weeks, the forthcoming liquidity drain is fundamentally bullish for the U.S. dollar. And with the PMs often moving in the opposite direction, a stronger greenback will likely weigh on the PMs’ performance over the next few months.
Thank you for reading our free analysis today. Please note that the above is just a small fraction of the full analyses that our subscribers enjoy on a regular basis. They include multiple premium details such as the interim targets for gold and mining stocks that could be reached in the next few weeks. We invite you to subscribe now and read today’s issue right away.
Sincerely,
Przemyslaw Radomski, CFA
Founder, Editor-in-chief -
Gold Miners: Will Investors Dump the Laggards?
October 18, 2021, 9:46 AMMining stocks were picked up by investors in the latest bullish wave. But these bad performers may be dumped just as quickly as they were bought.
After the HUI Index rallied back above the neckline of its bearish head & shoulders pattern, a new bull market for mining stocks has finally begun. Or has it? Well, after an identical development occurred in 2000, the HUI Index soon invalidated the breakout (and once again confirmed the breakdown) and a sharp decline followed.
Please see below:
As further evidence, stock market strength often follows the aphorism that ‘a rising tide lifts all boats.’
And while gold mining stocks rode the bullish wave, the sentiment high will likely reverse over the medium term.
To explain, silver and mining stocks are some of the worst performers when volatility strikes the general stock market. And with mining stocks’ recent bout of optimism underwritten by the ‘everything rally’ that we witnessed last week, when market participants ‘panic buy’ everything in sight, they often gobble up the major laggards (with the goal of capitalizing on potential mean reversion). Moreover, with silver and mining stocks some of the worst-performing assets YTD, the excessive optimism helped uplift these laggards last week.
To that point, with last week’s move largely driven by sentiment and not fundamental or technical realities, silver and mining stocks’ rallies are unlikely to hold over the medium term. Furthermore, it’s important to remember that cheap assets are often cheap for a reason. And with the marginal buyer of silver and mining stocks buying momentum and not fundamentals, they’ll likely end up holding the bag if/when sentiment reverses once again.
In other words, it was probably buying from the general public that helped to lift gold stocks higher – the kind of investors that enter the market at the end of the upswing, buying what’s cheap regardless of the outlook. And these are also the kind of investors that tend to lose money.
If you really think that gold stocks were strong last week, please compare their performance to the one of copper, for example. The latter moved sharply higher, while miners simply corrected from their yearly lows.
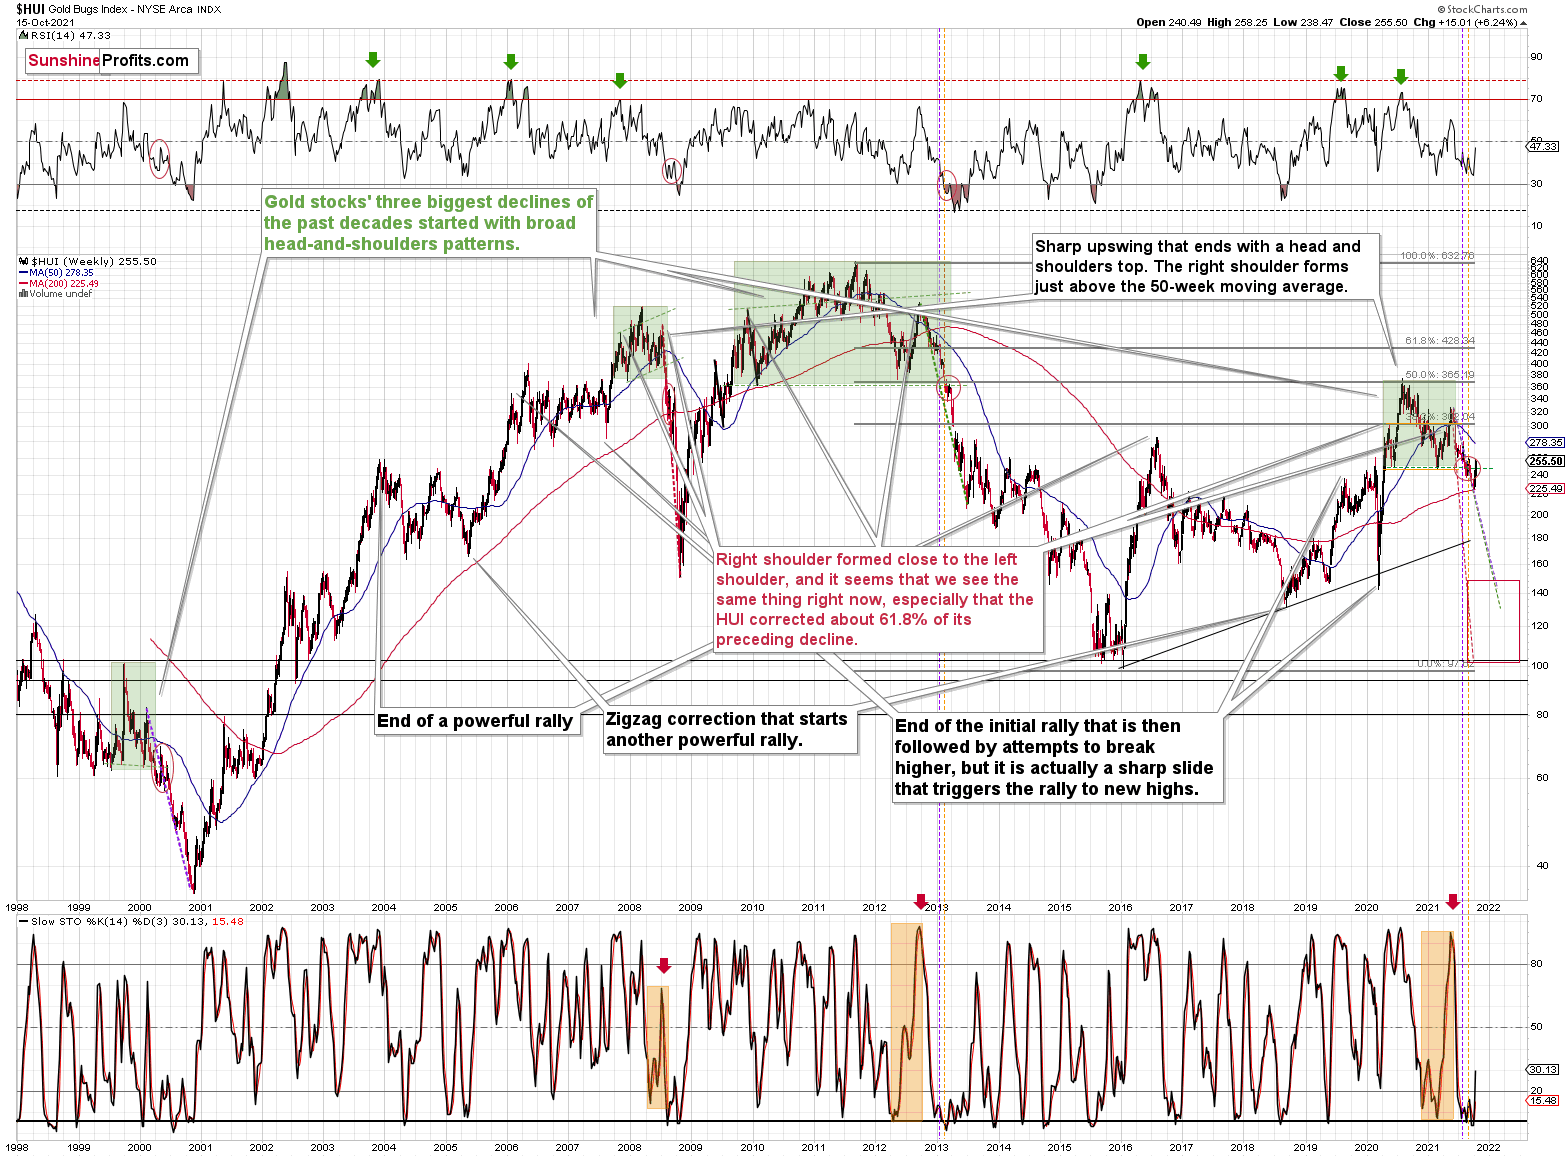
In addition, while I’ve also been warning about the ominous similarity to 2012-2013, the HUI Index continues to hop into the time machine. To explain, the vertical, dashed lines above demonstrate how the HUI Index is following its 2012-2013 playbook. For example, after a slight buy signal from the stochastic indicator in 2012, the short-term pause was followed by another sharp drawdown. For context, after the HUI Index recorded a short-term buy signal in late 2012 – when the index’s stochastic indicator was already below the 20 level (around 10) and the index was in the process of forming the right shoulder of a huge, medium-term head-and-shoulders pattern – the index moved slightly higher, consolidated, and then fell off a cliff. Thus, the HUI Index is quite likely to decline to its 200-week moving average (or so) before pausing and recording a corrective upswing. That’s close to the 220 level. Thereafter, the index will likely continue its bearish journey and record a final medium-term low some time in December.
Furthermore, I warned previously that the miners’ drastic underperformance of gold was an extremely bearish sign. There were several weeks when gold rallied visibly, and the HUI Index actually declined modestly. And now, gold stocks are trading close to their previous 2021 lows, while gold is almost right in the middle between its yearly high and its yearly low.
And why is this so important? Well, because the bearish implications of gold stocks’ extreme underperformance still remain intact.
Let’s keep in mind that the drastic underperformance of the HUI Index also preceded the bloodbath in 2008 as well as in 2012 and 2013. To explain, right before the huge slide in late September and early October 2008, gold was still moving to new intraday highs; the HUI Index was ignoring that, and then it declined despite gold’s rally. However, it was also the case that the general stock market suffered materially. If stocks didn’t decline so profoundly back then, gold stocks’ underperformance relative to gold would have likely been present but more moderate.
Nonetheless, broad head & shoulders patterns have often been precursors to monumental collapses. For example, when the HUI Index retraced a bit more than 61.8% of its downswing in 2008 and in between 50% and 61.8% of its downswing in 2012 before eventually rolling over, in both (2008 and 2012) cases, the final top – the right shoulder – formed close to the price where the left shoulder topped. And in early 2020, the left shoulder topped at 303.02. Thus, three of the biggest declines in the gold mining stocks (I’m using the HUI Index as a proxy here) all started with broad, multi-month head-and-shoulders patterns. And in all three cases, the size of the declines exceeded the size of the head of the pattern. As a reminder, the HUI Index recently completed the same formation.
Yes, the HUI Index moved back below the previous lows and the neck level of the formation, which – at face value – means that the formation was invalidated, but we saw a similar “invalidation” in 2000 and in 2013. Afterwards, the decline followed anyway. Consequently, I don’t think that taking the recent move higher at its face value is appropriate. It seems to me that the analogies to the very similar situation from the past are more important.
As a result, we’re confronted with two bearish scenarios:
- If things develop as they did in 2000 and 2012-2013, gold stocks are likely to bottom close to their early-2020 low.
- If things develop like in 2008 (which might be the case, given the extremely high participation of the investment public in the stock market and other markets), gold stocks could re-test (or break slightly below) their 2016 low.
In both cases, the forecast for silver, gold, and mining stocks is extremely bearish for the next several months.
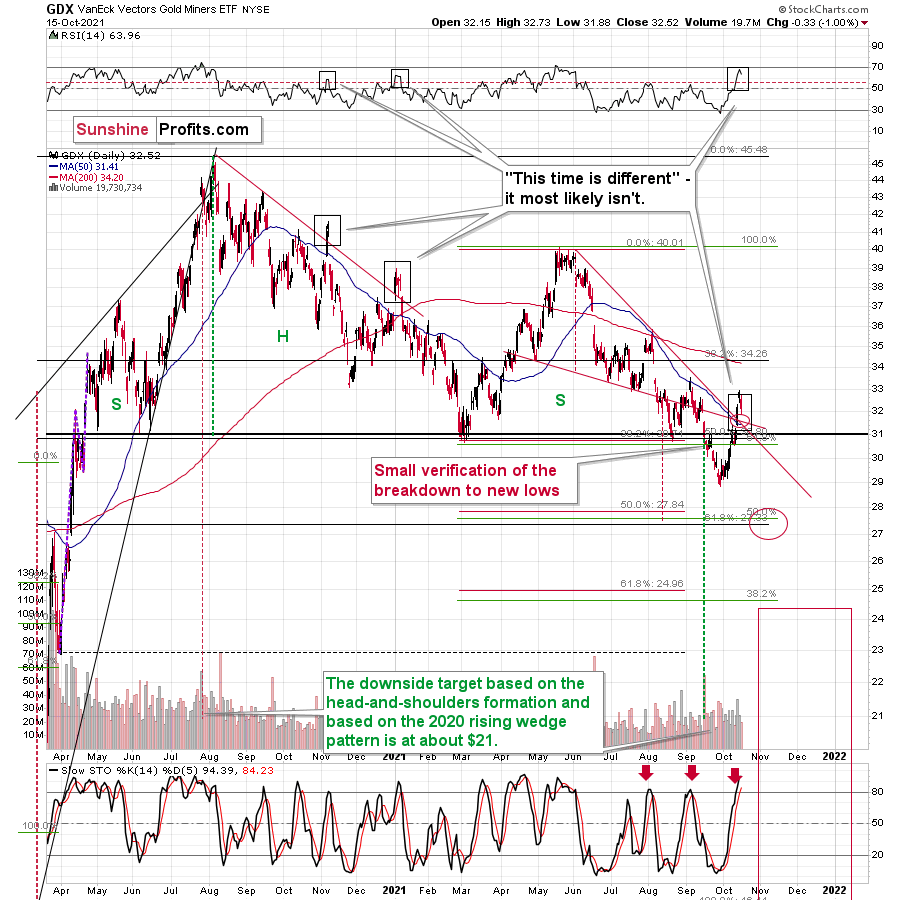
For even more confirmation, let’s compare the behavior of the GDX ETF and the GDXJ ETF. Regarding the former, the GDX ETF’s small breakout mirrors what we witnessed during the senior miners’ downtrend in late 2020/early 2021. Moreover, when the GDX ETF’s RSI (Relative Strength Index) approached 70 (overbought conditions) back then, the highs were in (or near) and sharp reversals followed.
Please see below:
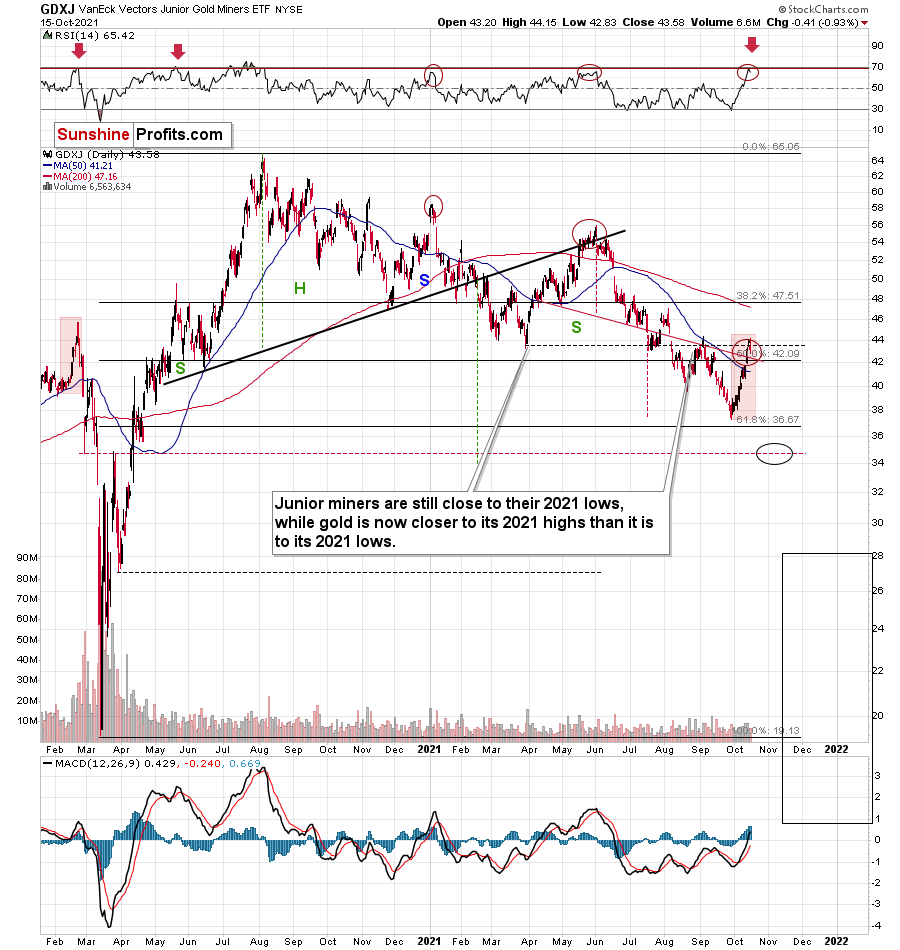
As for the GDXJ ETF, the gold junior miners’ RSI also signals overbought conditions and history has been unkind when similar developments have occurred.
To explain, I wrote on Oct. 15:
It is quite interesting when you consider how high the RSI is right now, and when in the past both the RSI and the GDXJ itself were trading at today’s levels.
That was in late February 2020. Back then, juniors were after a short-term rally from below $40, and they topped above $44. The RSI approached 70 — just like what we see today. And then the GDXJ declined below $20 in less than a month. I think the decline will take place longer this time, but the outlook is still extremely bearish.
By the way, the last time when the RSI was as high as it is right now was… right at the 2020 top. That’s yet another indication for gold that signals that the top is in or at hand.
Please see below:
Also noteworthy, while mining stocks outperformed gold on Oct. 15, their relative strength requires further verification to be considered material. For example, gold declined by 1.65% on Oct. 15, while the GDX ETF and the GDXJ ETF were down by roughly 1%. Moreover, this occurred with the USD Index largely flat. However, mining stocks will likely play catch-up over the next few months and their relative strength should reverse over the medium term.
In other words, it’s not correct to simply compare gold stocks and gold right now and say that the former were strong. It should be noted that the USD Index did nothing on Friday (Oct. 15) and gold stocks declined anyway. Consequently, it’s just the case that gold was the “odd man out” on Friday, while other markets were relatively normal. The USD Index verified its breakout, but it hasn’t moved visibly higher yet, so miners didn’t move visibly lower yet. Yet.
Finally, while I’ve been warning for months that the GDXJ/GDX ratio was destined for devaluation, the ratio has fallen precipitously in 2021. And while a tiny breakout occurred last week, the price action actually mirrors what we witnessed in early 2020 – right before the ratio fell off a cliff. As a result, further downside likely lies ahead.
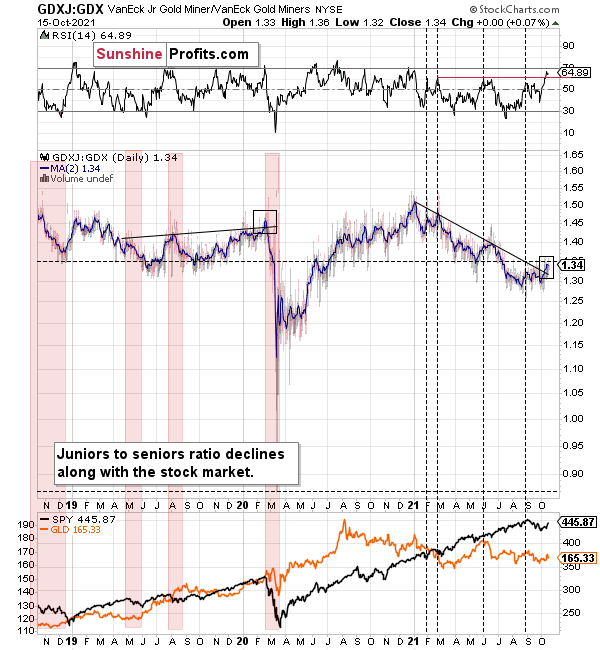
The bottom line?
If the ratio is likely to continue its decline, then on a short-term basis we can expect it to decline to 1.27 or so. If the general stock market plunges, the ratio could move even lower, but let’s assume that stocks decline moderately (just as they did in the last couple of days) or that they do nothing or rally slightly. They’ve done all the above recently, so it’s natural to expect that this will be the case. Consequently, the trend in the GDXJ to GDX ratio would also be likely to continue, and thus expecting a move to about 1.26 - 1.27 seems rational.
If the GDX is about to decline to approximately $28 before correcting, then we might expect the GDXJ to decline to about $28 x 1.27 = $35.56 or $28 x 1.26 = $35.28. In other words, ~$28 in the GDX is likely to correspond to about $35 in the GDXJ.
Is there any technical support around $35 that would be likely to stop the decline? Yes. It’s provided by the late-Feb. 2020 low ($34.70) and the late-March high ($34.84). There’s also the late-April low at $35.63.
Consequently, it seems that expecting the GDXJ to decline to about $35 is justified from the technical point of view as well.
In conclusion, gold, silver, and mining stocks are doing what they often do: with short-term oversold conditions eliciting countertrend rallies, investors that ignore history, technicals, and fundamentals are hoping that this is the rally where the precious metals finally deliver on all of their promises. However, with each corrective upswing akin to ‘The Boy Who Cried Wolf,’ investors are often left disappointed when they run to the precious metals rescue. As a result, a similar outcome will likely materialize this time around.
Thank you for reading our free analysis today. Please note that the above is just a small fraction of the full analyses that our subscribers enjoy on a regular basis. They include multiple premium details such as the interim targets for gold and mining stocks that could be reached in the next few weeks. We invite you to subscribe now and read today’s issue right away.
Sincerely,
Przemyslaw Radomski, CFA
Founder, Editor-in-chief


Gold Investment News
Delivered To Your Inbox
Free Of Charge
Bonus: A week of free access to Gold & Silver StockPickers.
Gold Alerts
More-
Status
New 2024 Lows in Miners, New Highs in The USD Index
January 17, 2024, 12:19 PM -
Status
Soaring USD is SO Unsurprising – And SO Full of Implications
January 16, 2024, 8:40 AM -
Status
Rare Opportunity in Rare Earth Minerals?
January 15, 2024, 2:06 PM

