

Briefly: in our opinion, full (300% of the regular position size) speculative short positions in junior mining stocks are justified from the risk/reward point of view at the moment of publishing this Alert.
Very little happened in the precious metals sector yesterday, and practically everything that I wrote yesterday and in Monday’s flagship analysis remains up-to-date.
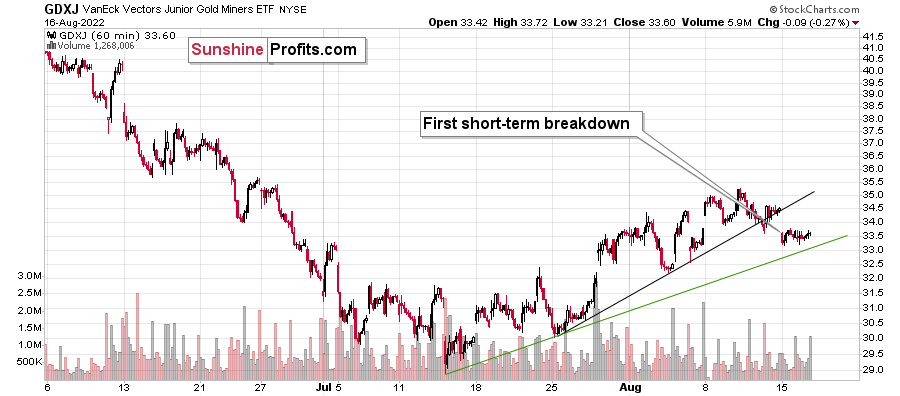
Let’s start with a quick update on the GDXJ’s very short-term chart.
Yesterday, I wrote the following:
Gold declined yesterday, and it did so in tune with what we saw in 2013. The back-and-forth trading continues, but we have some signs that it’s getting close to being over. In other words, it’s likely the case that we won’t have to wait for the decline to re-start much longer.
One of those signs comes from the very short-term GDXJ ETF chart.
Junior miners are after a breakdown below their rising black support line, and the move above the early-August high was clearly invalidated. This means that we saw two small sell signals.
Once the GDXJ declines below the rising, green support line, it will be a good indication that the next big move lower is already underway. Right now, it’s quite possible, but not very likely. In other words, if we see more back-and-forth movement this week, it would still be normal in light of the analogy to 2013 and it would not be something bullish.
Indeed, the junior miners’ ETF moved slightly lower, but overall it stayed between the two support lines. Once we see a breakdown below the green line, we’ll likely “know” (there are no certainties in any market) that the next big move lower has just started.
Gold and silver haven’t done much, and the USD Index declined a little.
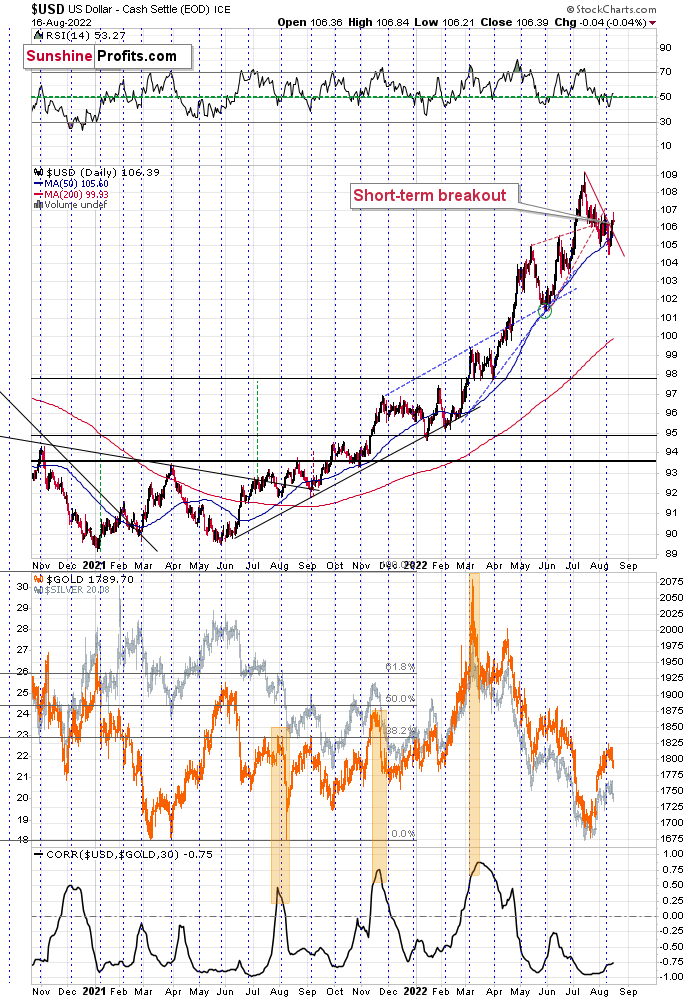
This tiny decline is perfectly normal given the recent short-term breakout. It’s most likely just its verification. Consequently, my previous comments on the above chart remain up-to-date:
Another indication comes from the USD Index, which just moved above its declining red resistance line. It’s up by about 0.3 in today’s pre-market trading, which indicates that the move is likely to continue.
This fits the subtle clues coming from gold and junior miners – the top might already be in.
Even if it’s not, I think it remains a good idea to be well positioned to take advantage of lower prices in the precious metals sector, especially in the junior mining stocks.
One thing that I would like to add today is that the general stock market is approaching a combination of strong resistance levels.
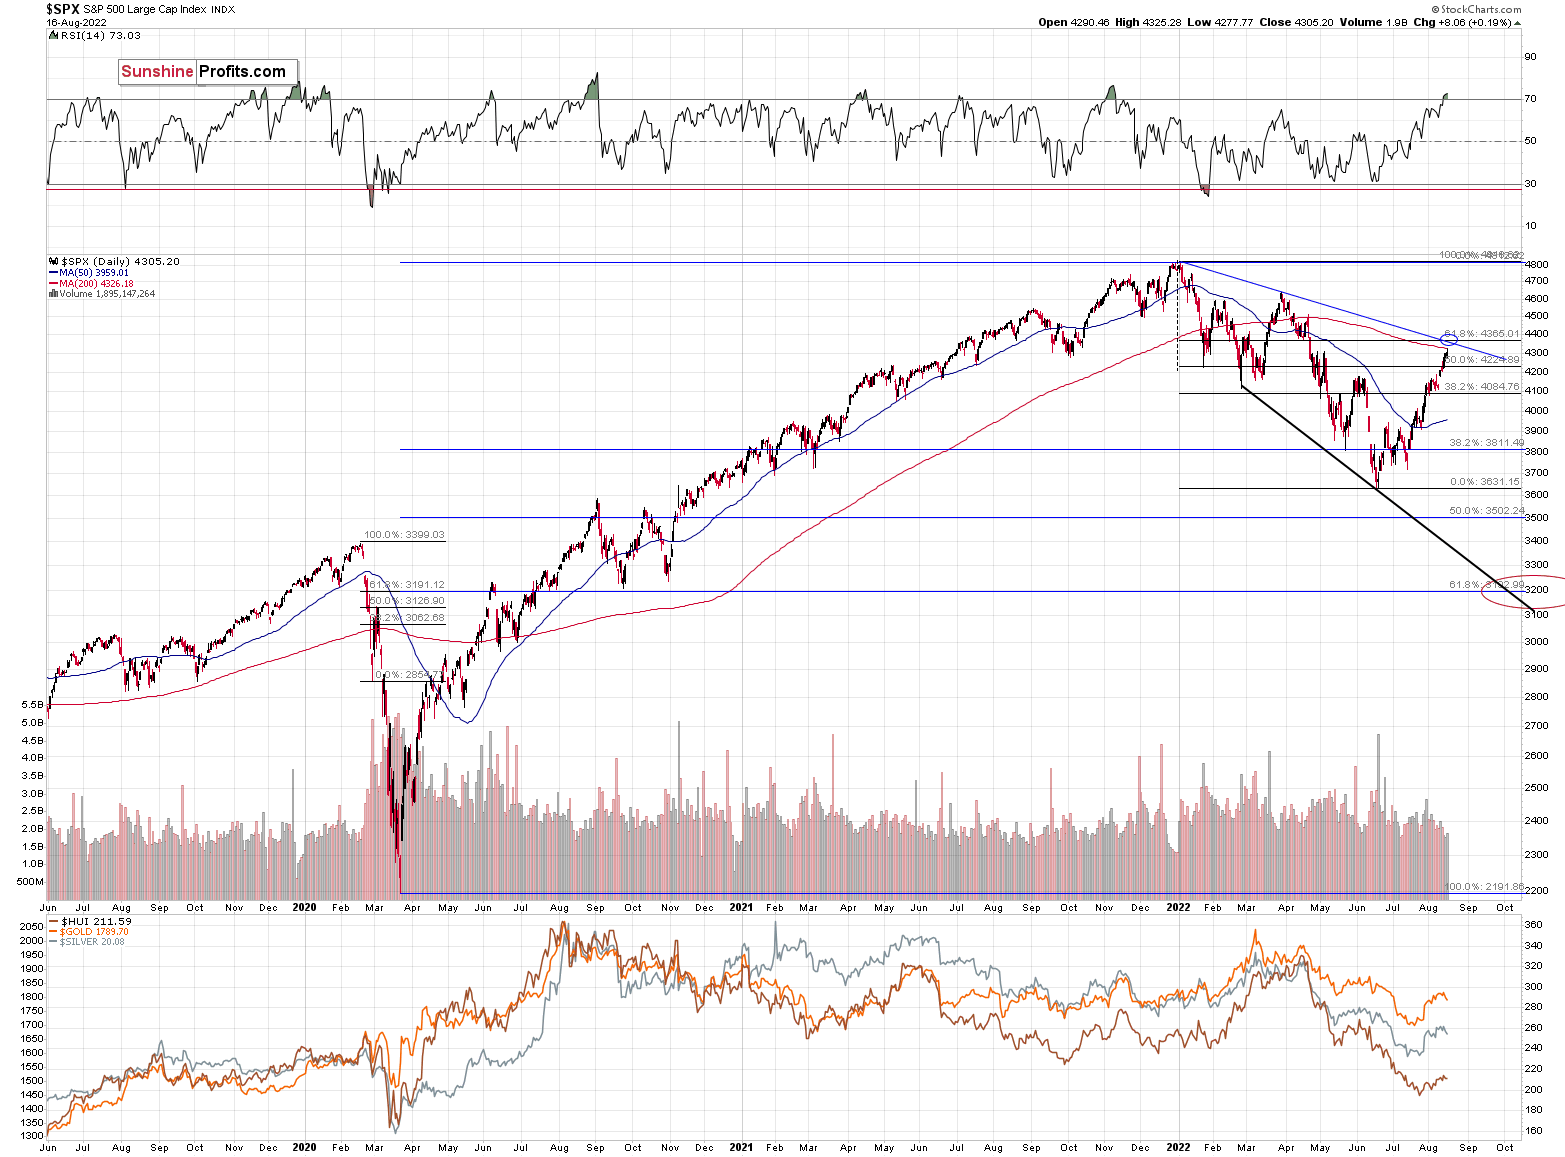
One of them is provided by the all-important 61.8% Fibonacci retracement level based on the entire 2022 decline. The other is the declining resistance line based on the previous 2022 highs. These levels coincide just slightly above the current values of the S&P 500 index – at around 4,365 – implying that the S&P 500 index’s short-term upside is very limited.
The best (here: most bearish) thing about the above chart is not only the above. It’s also a fact that the precious metals sector has already stopped reacting to higher stock market values. Consequently, when stocks finally decline, it’s likely that they will contribute to lower PM values, but at the same time, if they keep rallying, it’s not necessarily likely to make PMs move higher.
This is just one of the factors that creates a great risk-to-reward situation for a short position in the precious metals sector, especially in junior mining stocks. As a quick reminder, the prices of junior miners are more correlated with other stocks than the rest of the precious metals sector.
Having said that, let’s take a look at the markets from a more fundamental angle.
Battle Lines
With gold, silver and the GDXJ ETF underperforming the S&P 500 on Aug. 16, commodities have suffered mightily in recent days. Moreover, with geopolitical tensions between the U.S., Russia, and China festering, the implications could be negative for the PMs.
For context, these issues will likely play out over a long time horizon, so the chess game shouldn’t impact the PMs’ medium-term paths. However, the battle for global supremacy has some important ramifications.
For example, it’s well known that Russia is a major exporter of oil and gas and other commodities like coal and gold. Therefore, while crude and gold have given back all of their war-induced gains, the invasion highlighted how these events can move markets.
To that point, the 2019 U.S. Geological Survey showed that China imported 80% of rare earth metals. As a result, lower prices could benefit Shanghai. However, the region also held 44 million tons of reserves in 2019, which accounted for roughly 37% of global inventories. As such, what’s beneficial on the import side is harmful on the export side. For context, the U.S. only had 1.4 million tons of reserves.
Please see below:
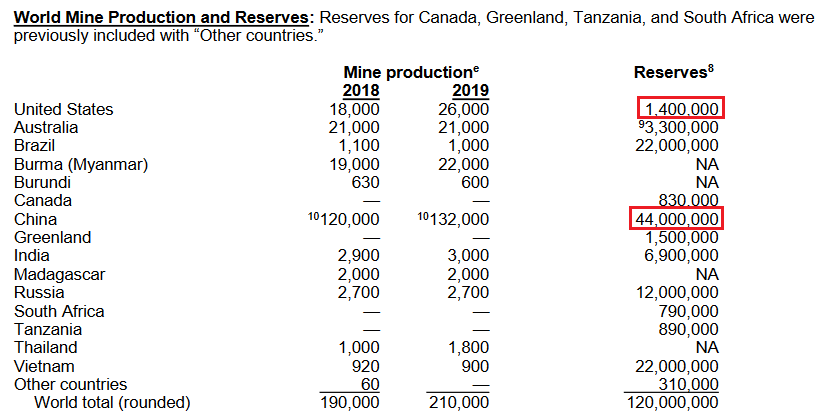 Source: U.S. Geological Survey
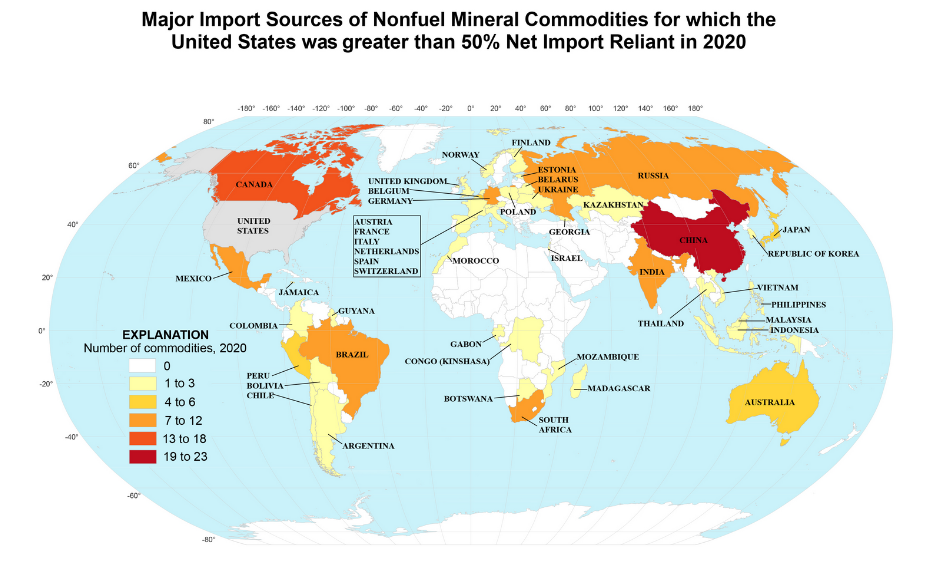
To that point, with the U.S. heavily reliant on Chinese nonfuel mineral commodities imports, lower prices could have a net-negative impact on China by reducing U.S. inflation and the value of China’s reserves.
Please see below:
 Source: U.S. Geological Survey
To explain, the colored areas above highlight regions where the U.S.' nonfuel mineral commodities net imports are greater than 50%. If you analyze the dark red region on the right side of the chart, you can see that China supplies 19 to 23 commodities to the U.S., where the latter depends on them for more than 50% of its net imports. Likewise, the U.S. similarly relies on Russia for seven to 12 commodities.
Therefore, the U.S. would benefit from lower commodity prices and may have the incentive to weaken various contracts. If so, the developments would be bearish for gold, silver, and mining stocks.
However, it's important to remember that these actions go both ways, and if China and Russia anticipate the U.S.'s actions, they could restrict exports and leave America with a large supply deficit.
As evidence, Helima Croft, Global Head of Commodity Strategy at RBC Capital Markets, warned on Aug. 11 that Russia is "cutting gas flows into Europe" and "the Russians have every intention of making this as painful for Europe as possible." As a result, with Europe implementing Russian sanctions in December to support Ukraine, the region's reliance on Russian oil and gas has become a significant hindrance.
Likewise, Russian state gas company Gazprom said on Aug. 16: "European spot gas prices have reached $2,500 (per 1,000 cubic metres). According to conservative estimates, if such a tendency persists, prices will exceed $4,000 per 1,000 cubic metres this winter."
Please see below:
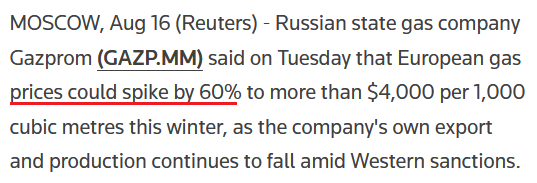 Source: Reuters
Thus, the alarming situation confronting Europe highlights the dangers of starting a commodities war with Russia and/or China. Since the U.S. is much less reliant on Russian oil and gas, Americans can support Ukraine with a lower economic impact than what’s felt in the Eurozone. In contrast, the U.S. imports more goods from China than any other region, so a commodities war is likely not in America’s best interests.
All in all, geopolitical tensions can move markets in the short term, and the eroding relations between the U.S., Russia and China – especially after House Speaker Nancy Pelosi’s Taiwan visit – could affect the PMs in the years to come. However, the technical and domestic fundamental developments are more relevant when projecting the weeks and months ahead.
Don’t Poke the Bear
With the S&P 500 enjoying another green close on Aug. 16, the dip buyers are eager to step in at any point of weakness. However, with investors underestimating the fundamental challenges that lie ahead, they assume that a resilient U.S. labor market signals the all-clear. Yet, I warned on Aug. 12 that bear markets don’t end with the U.S. unemployment rate at a ~50-year low; they begin with the metric at a ~50-year low. I wrote:
The U.S. unemployment rate hit a new 2022 low of 3.5% in July. However, the metric always bottoms before a recession.
Please see below:
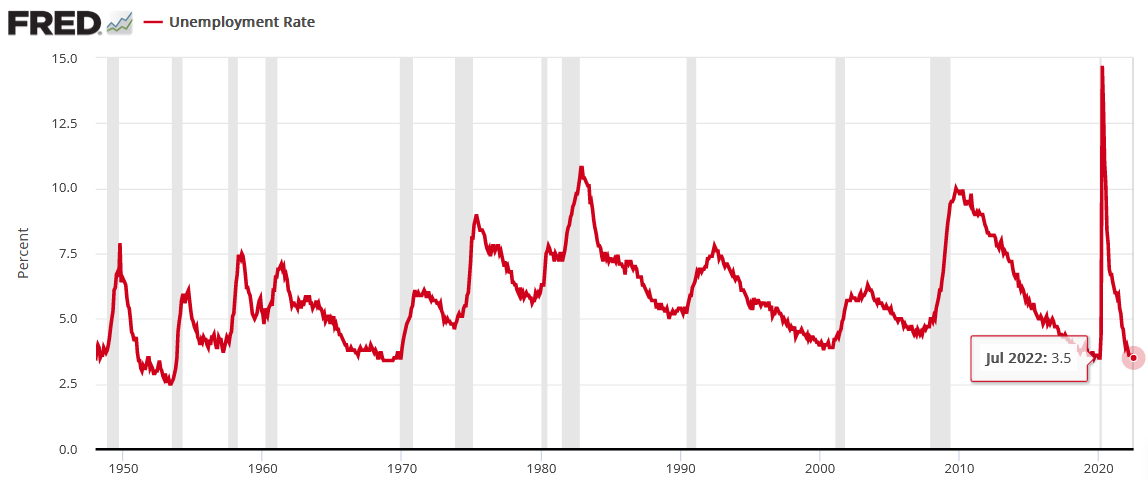
To explain, notice how the U.S. unemployment rate always troughs and then steadily rises before a recession hits. Thus, with the metric heading south in July, the bearish turn still awaits us. Of course, the uninformed crowd assumes that this time is different.
To that point, if we compare the historical troughs with the S&P 500’s historical performance, the data highlights how rough times should confront the index in the months ahead.
Please see below:
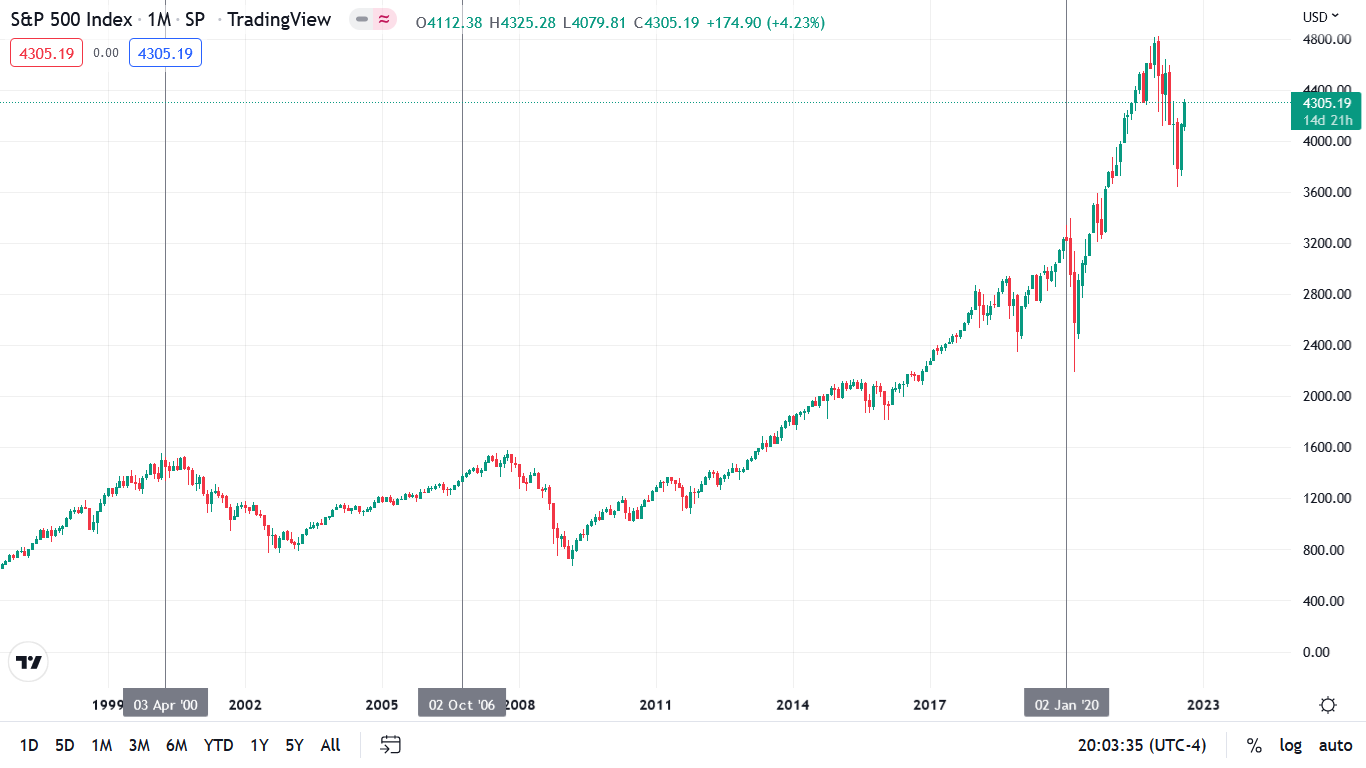
To explain, the vertical gray lines on the monthly chart above show how the U.S. unemployment rate hit cycle lows in 2020, 2006 and 2000 before major S&P 500 bear markets. Moreover, while some short-term upside was present in 2007, the S&P 500 was much closer to the top than the bottom.
Likewise, if we travel back further in time, the data paints a similar portrait.
Please see below:
To explain, the U.S. unemployment rate’s cycle low in 1989 didn’t culminate in a bear market. However, the S&P 500’s rally stalled soon after the trough, and the index gave back all of its gains before a new bull market resumed. Similar results were also present in 1979, as the S&P 500 rallied into the February 1980 peak before giving back all of those gains.
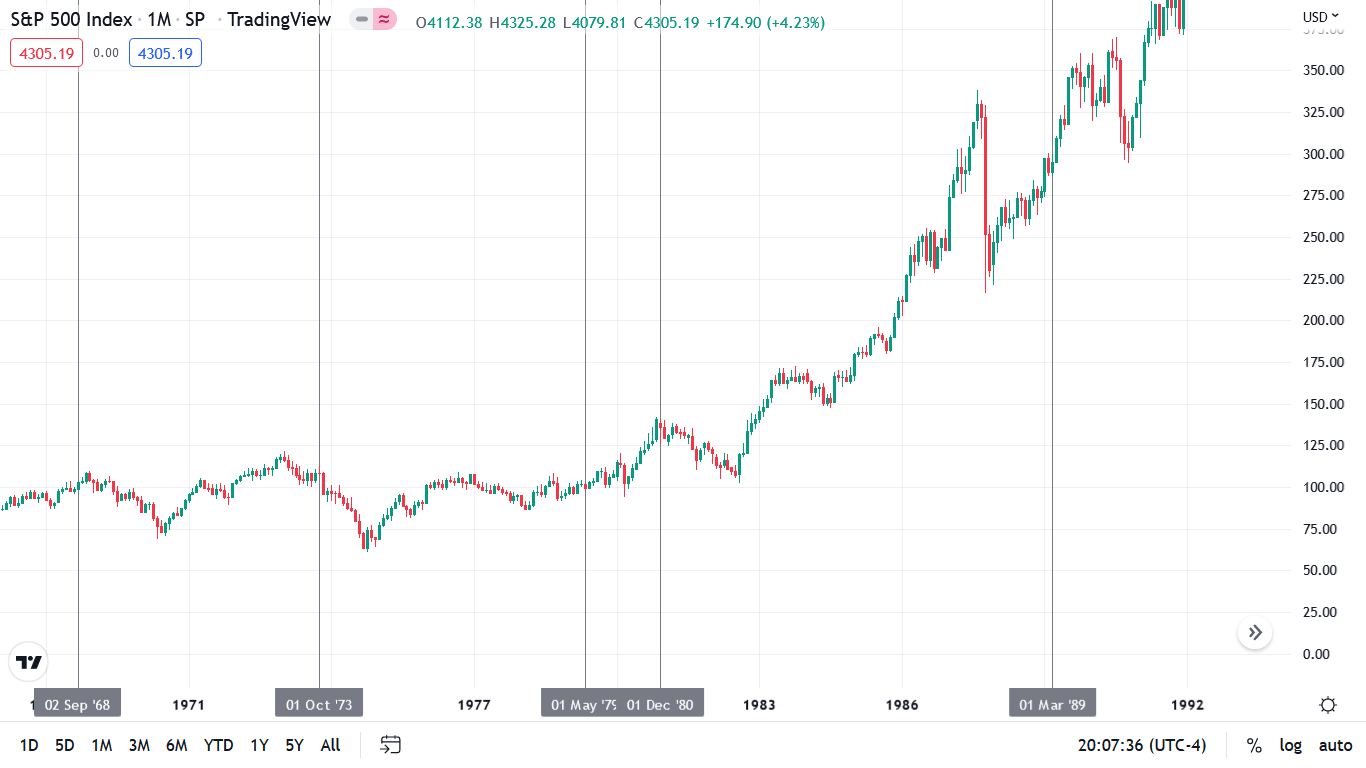
More importantly, the U.S. unemployment rate’s troughs in 1980, 1973, and 1968 occurred before/alongside major bear markets. As a result, the consensus has misconstrued the ramifications of the U.S. labor market’s strength (low unemployment = late cycle).
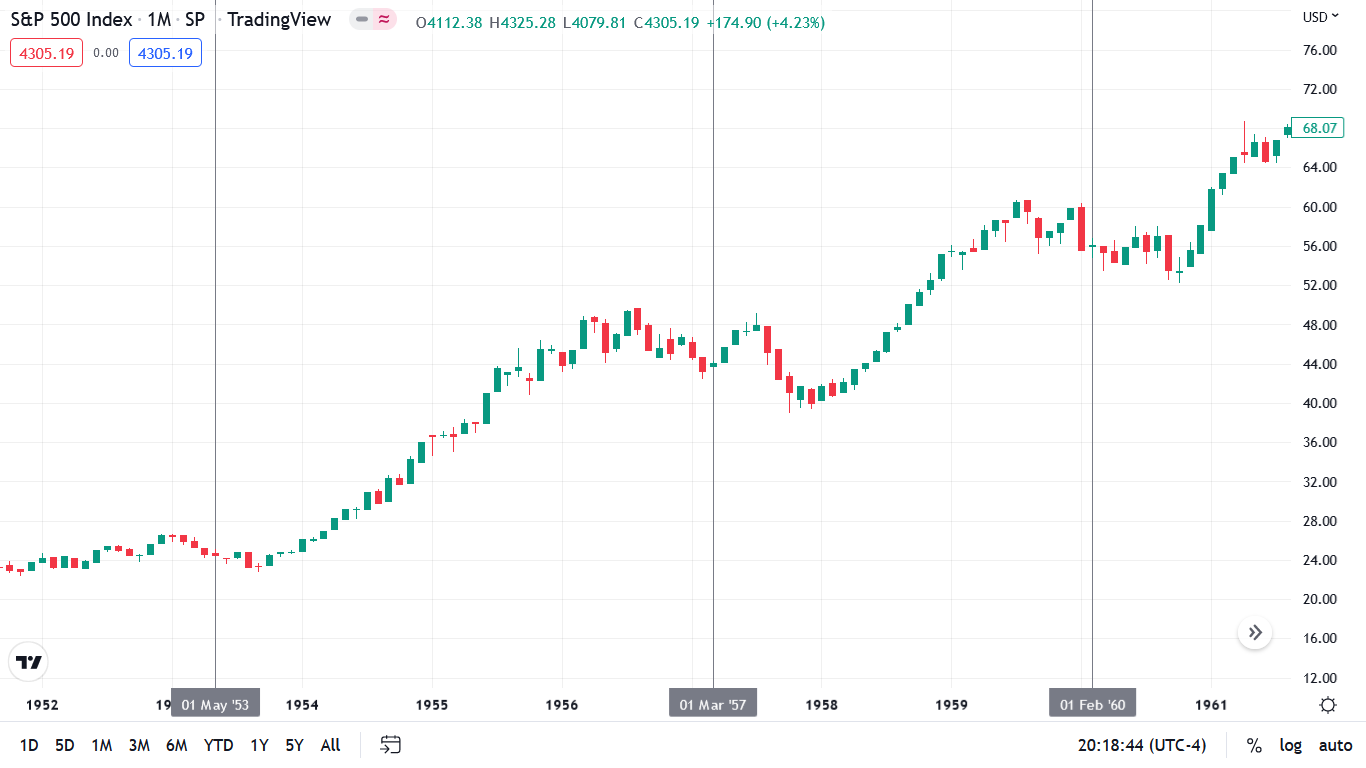
Continuing the theme, similar inflection points (though much less severe) also occurred (or were near) in 1960, 1957, and 1953.
Please see below:
Therefore, the data confirms that the 11 instances of abnormally low U.S. unemployment rates since 1950 were bearish, not bullish. Furthermore, six readings occurred before/alongside profound S&P 500 bear markets, while five readings resulted in the S&P 500 giving back all of its prior gains. As a result, even if the latter occurs, the S&P 500 ended June at ~3.785, which implies more than 12% downside from the Aug. 16 close if the optimistic scenario unfolds.
However, with asset prices still in bubble territory and unanchored inflation forcing the Fed to tighten monetary policy at a torrent pace (rate hikes + QT), a soft landing is highly unlikely. Moreover, with the 1970s and 1980s highlighting the destruction that unfolds when inflation reaches unanchored levels, the bulls have a laundry list of excuses that only hold if ‘this time is different.’
The Bottom Line
While gold, silver and the GDXJ ETF declined on Aug. 16, the dip buyers helped rally the GDXJ ETF off its lows and helped the GDX ETF close in the green. However, with investors assuming that “peak inflation” means all is well, they misunderstand the economic pain that must unfold to reach the Fed’s 2% target. As such, since history provides a clear roadmap of what’s to come, the dip buyers should regret their willingness to disregard fundamental precedent.
In conclusion, the PMs were mixed on Aug. 16, as the GDX ETF ended the day higher. However, with gold, silver and mining stocks underperforming the S&P 500 during its recent upswing, the relative weakness is profoundly bearish. Moreover, with the USD Index regaining its mojo and U.S. real yields climbing once again, the stock market’s optimism is more isolated than it seems.
Overview of the Upcoming Part of the Decline
- It seems to me that the corrective upswing is either over or about to be over, and that the next big move lower is about to start.
- If we see a situation where miners slide in a meaningful and volatile way while silver doesn’t (it just declines moderately), I plan to – once again – switch from short positions in miners to short positions in silver. At this time, it’s too early to say at what price levels this could take place and if we get this kind of opportunity at all – perhaps with gold prices close to $1,600.
- I plan to exit all remaining short positions once gold shows substantial strength relative to the USD Index while the latter is still rallying. This may be the case with gold prices close to $1,400. I expect silver to fall the hardest in the final part of the move. This moment (when gold performs very strongly against the rallying USD and miners are strong relative to gold after its substantial decline) is likely to be the best entry point for long-term investments, in my view. This can also happen with gold close to $1,400, but at the moment it’s too early to say with certainty.
- The above is based on the information available today, and it might change in the following days/weeks.
You will find my general overview of the outlook for gold on the chart below:
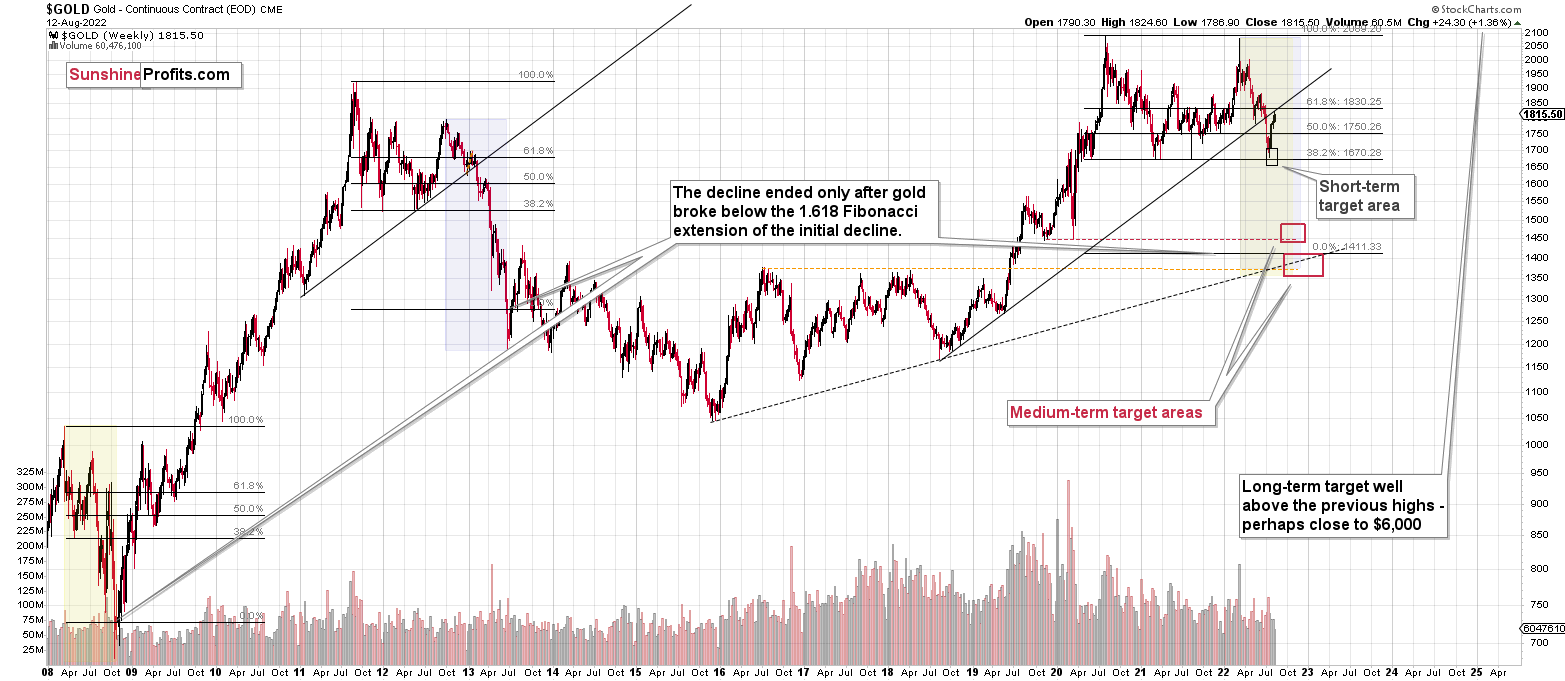
Please note that the above timing details are relatively broad and “for general overview only” – so that you know more or less what I think and how volatile I think the moves are likely to be – on an approximate basis. These time targets are not binding nor clear enough for me to think that they should be used for purchasing options, warrants, or similar instruments.
Letters to the Editor
Q: I'm thinking about the best products to buy when the metals market goes bullish. I like the leverage and more upside with ETFs, but am concerned with the possibility of an ETF going BK or something similar with a lack of gold backing it. Individual mining stocks will be part of my position, but selecting the correct stocks is critical. Your thoughts?
A: Initially, I plan to focus on mining stocks, so the ETFs (like GDX and GDXJ) are backed by mining stock shares, not gold or silver.
I will personally use ETFs, and I’m not going to provide individual stock positions. I found that my energy is best spent on timing and focusing on relative valuations between various parts of the precious metals sector (especially silver vs. mining stocks), and therefore, I’m not going to dedicate time to researching the fundamentals behind individual mining companies.
Also, if you’re concerned with the backing of ETFs with physical metals, you might want to consider the ETFs that allow for in-kind redemption of PMs as well as geographical diversification (also trading under different jurisdictions). Some symbols that you might find interesting are:
- JBGOUA, 4GLD (for gold);
- PHSP, SIVR (for silver);
- CEF (for both).
I will personally (most likely) focus on mining stock ETFs first, and then I’ll likely gradually move to physically-backed funds (e.g. the above) as well as physical holdings.
Q: Dear PR, I'm a paid subscriber to your gold analysis service and am thoroughly enjoying and profiting from your advice and analysis. Yours is the most complete and insightful analysis I've come across so far. Recently, you recommended a sell on gold based on the possibility of continued rate hikes by Powell, but this newsletter from John Mauldin suggests a higher possibility of the Fed stopping the rate hike cycle sooner and actually starting cutting rates in order to try a soft landing, which would be bullish for PMs. Moreover, from a price action point of view, gold is showing signs of strength and staying near or above 1800 throughout the week and closed above it on a weekly basis. In the light of these factors, what are your views on likely scenarios.
A: Thanks for the kind words! I greatly appreciate them!
To clarify, I haven’t recommended any trades - I’m simply writing what I find justified from the risk to reward point of view (in general).
I simply disagree with John Mauldin’s views. The key (and also simplest) reason is that inflation is political and there are elections next year. The actions will most likely be aimed at what voters are most concerned with – and that’s inflation. So, monetary conditions are likely to tighten.
Also, please note that gold can bottom before the rates peak, as it’s getting too low too fast. In fact, I view this as a likely scenario.
As for the technicals, and gold trading close to $1,800, everything that I wrote in recent days remains up-to-date. It’s most likely just a part of the 2013-like pause before the big slide.
Q: The attached trade was on a show a few days ago. I think the trade you recommended is dead till Sept 16? Please comment.
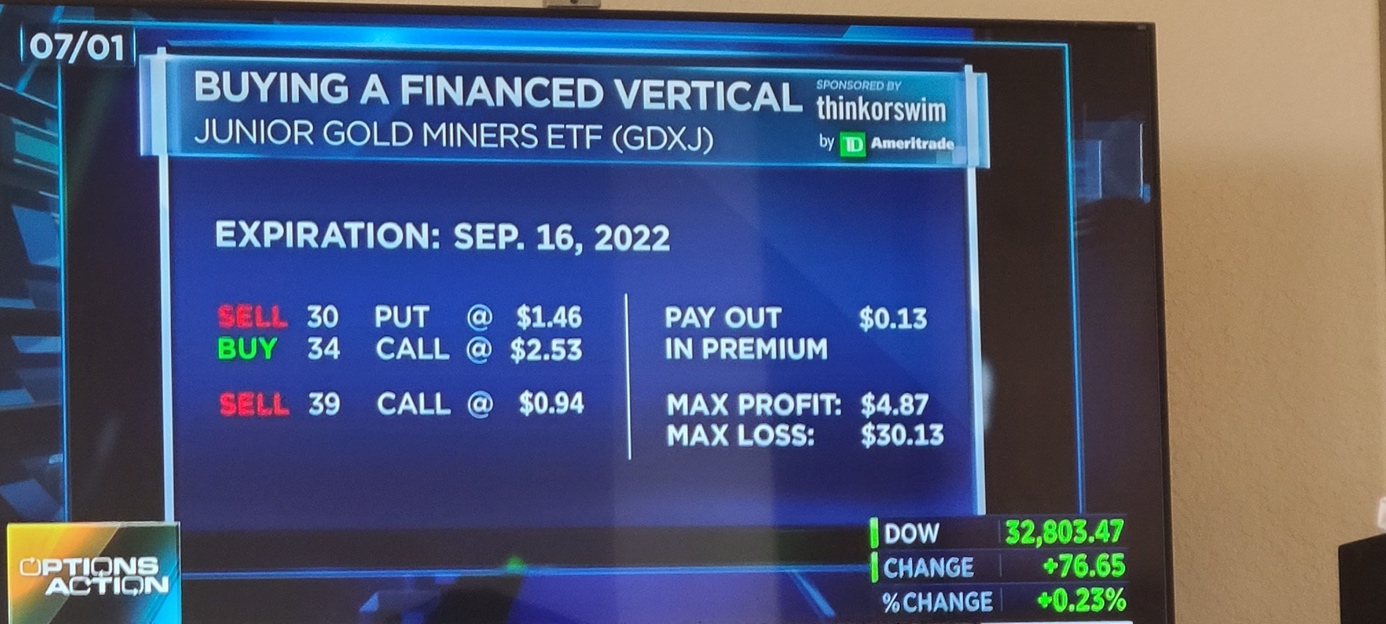
A: I don’t know what made the author of this trade think that it was justified. Consequently, I can’t really discuss it.
I don’t think that just because someone had a specific idea for an options play has any implications for the outlook for any market, including the GDXJ ETF.
In other words, it doesn’t change anything regarding the analogy to 2013 that I’ve been describing for months (and which has been in place for months). Based on this analogy, we are currently in a relatively boring period, which most likely is just the calm before the storm. It seems that this period is ending. I won’t rule out the possibility that it would take another month before the slides materialize, but I don’t think it’s likely. Another 0-2 weeks of back-and-forth trading seems much more realistic in my view.
Summary
Summing up, it seems that the corrective upswing is over (or close to being over), which means that the powerful medium-term downtrend can now resume.
Two weeks ago, we closed yet another profitable trade in a row. This year’s profits are already enormous, but it seems likely to me that they will grow even more in the following weeks and months. In particular, I expect the profits on the current short positions to be really profound.
After the final sell-off (that takes gold to about $1,350-$1,500), I expect the precious metals to rally significantly. The final part of the decline might take as little as 1-5 weeks, so it's important to stay alert to any changes.
As always, we'll keep you – our subscribers – informed.
To summarize:
Trading capital (supplementary part of the portfolio; our opinion): Full speculative short positions (300% of the full position) in junior mining stocks are justified from the risk to reward point of view with the following binding exit profit-take price levels:
Mining stocks (price levels for the GDXJ ETF): binding profit-take exit price: $20.32; stop-loss: none (the volatility is too big to justify a stop-loss order in case of this particular trade)
Alternatively, if one seeks leverage, we’re providing the binding profit-take levels for the JDST (2x leveraged). The binding profit-take level for the JDST: $29.87; stop-loss for the JDST: none (the volatility is too big to justify a SL order in case of this particular trade).
For-your-information targets (our opinion; we continue to think that mining stocks are the preferred way of taking advantage of the upcoming price move, but if for whatever reason one wants / has to use silver or gold for this trade, we are providing the details anyway.):
Silver futures downside profit-take exit price: $12.32
SLV profit-take exit price: $11.32
ZSL profit-take exit price: $79.87
Gold futures downside profit-take exit price: $1,504
HGD.TO – alternative (Canadian) 2x inverse leveraged gold stocks ETF – the upside profit-take exit price: $19.87
HZD.TO – alternative (Canadian) 2x inverse leveraged silver ETF – the upside profit-take exit price: $49.87
Long-term capital (core part of the portfolio; our opinion): No positions (in other words: cash)
Insurance capital (core part of the portfolio; our opinion): Full position
Whether you’ve already subscribed or not, we encourage you to find out how to make the most of our alerts and read our replies to the most common alert-and-gold-trading-related-questions.
Please note that we describe the situation for the day that the alert is posted in the trading section. In other words, if we are writing about a speculative position, it means that it is up-to-date on the day it was posted. We are also featuring the initial target prices to decide whether keeping a position on a given day is in tune with your approach (some moves are too small for medium-term traders, and some might appear too big for day-traders).
Additionally, you might want to read why our stop-loss orders are usually relatively far from the current price.
Please note that a full position doesn't mean using all of the capital for a given trade. You will find details on our thoughts on gold portfolio structuring in the Key Insights section on our website.
As a reminder - "initial target price" means exactly that - an "initial" one. It's not a price level at which we suggest closing positions. If this becomes the case (as it did in the previous trade), we will refer to these levels as levels of exit orders (exactly as we've done previously). Stop-loss levels, however, are naturally not "initial", but something that, in our opinion, might be entered as an order.
Since it is impossible to synchronize target prices and stop-loss levels for all the ETFs and ETNs with the main markets that we provide these levels for (gold, silver and mining stocks - the GDX ETF), the stop-loss levels and target prices for other ETNs and ETF (among other: UGL, GLL, AGQ, ZSL, NUGT, DUST, JNUG, JDST) are provided as supplementary, and not as "final". This means that if a stop-loss or a target level is reached for any of the "additional instruments" (GLL for instance), but not for the "main instrument" (gold in this case), we will view positions in both gold and GLL as still open and the stop-loss for GLL would have to be moved lower. On the other hand, if gold moves to a stop-loss level but GLL doesn't, then we will view both positions (in gold and GLL) as closed. In other words, since it's not possible to be 100% certain that each related instrument moves to a given level when the underlying instrument does, we can't provide levels that would be binding. The levels that we do provide are our best estimate of the levels that will correspond to the levels in the underlying assets, but it will be the underlying assets that one will need to focus on regarding the signs pointing to closing a given position or keeping it open. We might adjust the levels in the "additional instruments" without adjusting the levels in the "main instruments", which will simply mean that we have improved our estimation of these levels, not that we changed our outlook on the markets. We are already working on a tool that would update these levels daily for the most popular ETFs, ETNs and individual mining stocks.
Our preferred ways to invest in and to trade gold along with the reasoning can be found in the how to buy gold section. Furthermore, our preferred ETFs and ETNs can be found in our Gold & Silver ETF Ranking.
As a reminder, Gold & Silver Trading Alerts are posted before or on each trading day (we usually post them before the opening bell, but we don't promise doing that each day). If there's anything urgent, we will send you an additional small alert before posting the main one.
Thank you.
Przemyslaw Radomski, CFA
Founder, Editor-in-chief

