

Briefly: in our opinion, full (300% of the regular position size) speculative short positions in junior mining stocks are justified from the risk/reward point of view at the moment of publishing this Alert. I’m (ONCE AGAIN) moving the binding take-profit levels for the current short position in mining stocks lower, and I’m also lowering the target for silver.
In short, practically everything that I wrote in yesterday’s analysis remains up-to-date. Based on the relative valuations and pre-market price movement, I wrote that junior miners were likely to decline below their rising support line, and I moved the exit price for the current short position in the GDXJ lower (it seems that it will gain even more shortly).
Indeed, the GDXJ fell like a stone in the water, and it pierced through the above-mentioned support line without looking back. Thanks to remaining in the short position, we were able to benefit from the breakdown below the support line.
What’s next? Well, what was likely yesterday remains likely today. Markets appear to be approaching, but not yet at, their short-term corrections. Let’s take a closer look, starting with the USD Index.
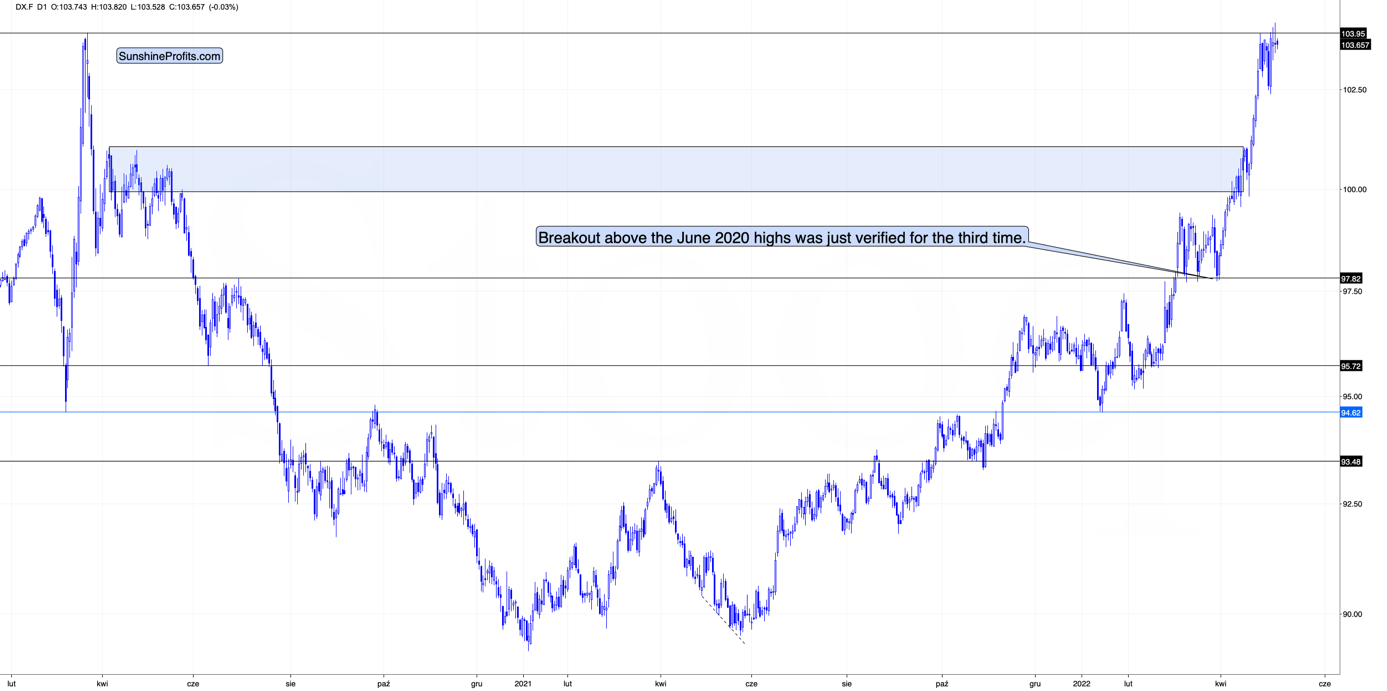
As you can see above, the USD Index just moved above its 2020 high and above its recent highs, but it failed to close in the green. Actually, the USDX declined slightly during yesterday’s session. So, while gold was initially strong relative to the USDX, it ended up being very weak. This tells us that if the USD Index moved a bit higher here, gold might launch another quick decline.
Given how the USD Index performed after a similar breakout (in 2014), it seems that we might see a corrective move soon (perhaps after an additional rally). I previously described it in the following way:
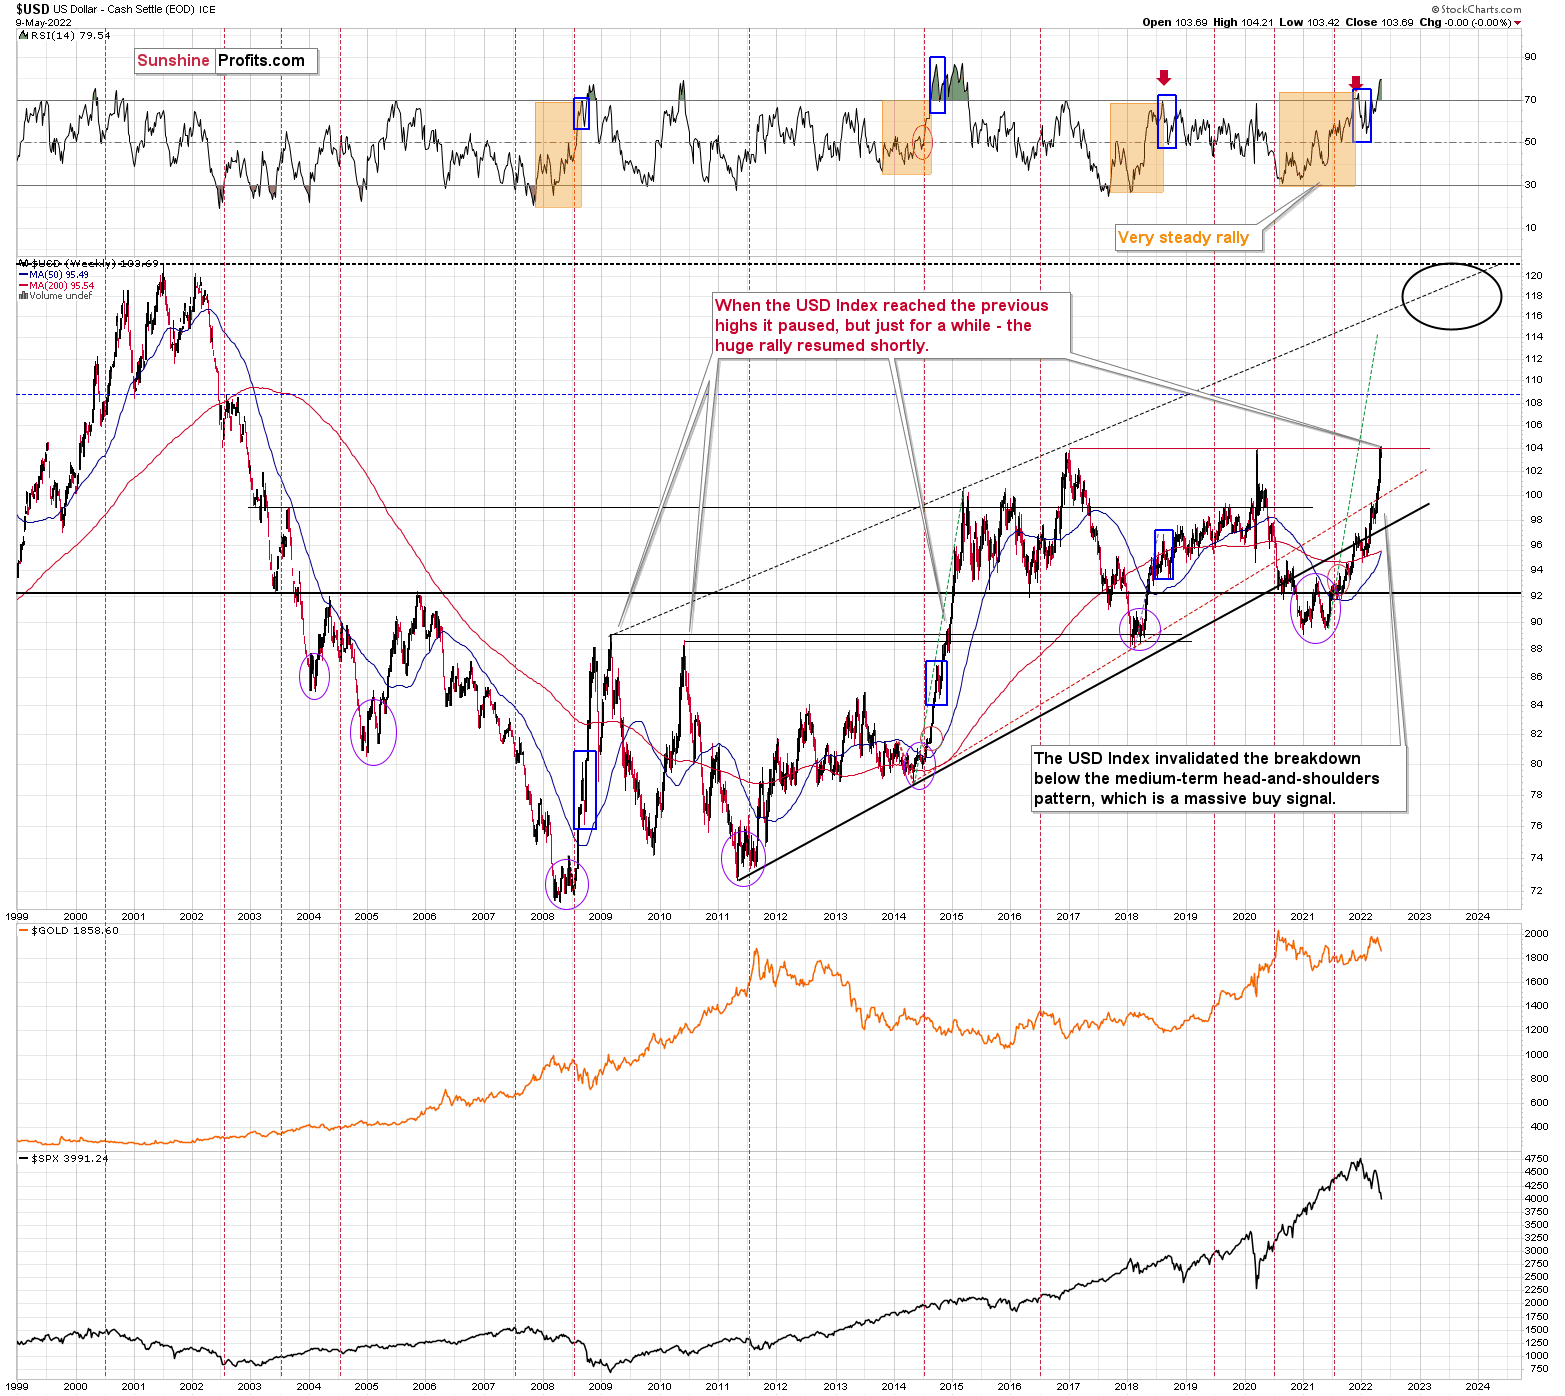
I would like to add one important detail. Back in 2014, the USD Index didn’t correct after reaching its previous high. It corrected after moving above it. The higher of the highs was the March 2009 high, at 89.11.
The higher of the recent highs is at 103.96 right now, so if the analogy to 2014 is to remain intact, the USD Index could now top at close to 104.5 or even 105.
Yesterday’s high was 104.2, so the USDX could still move higher before correcting.
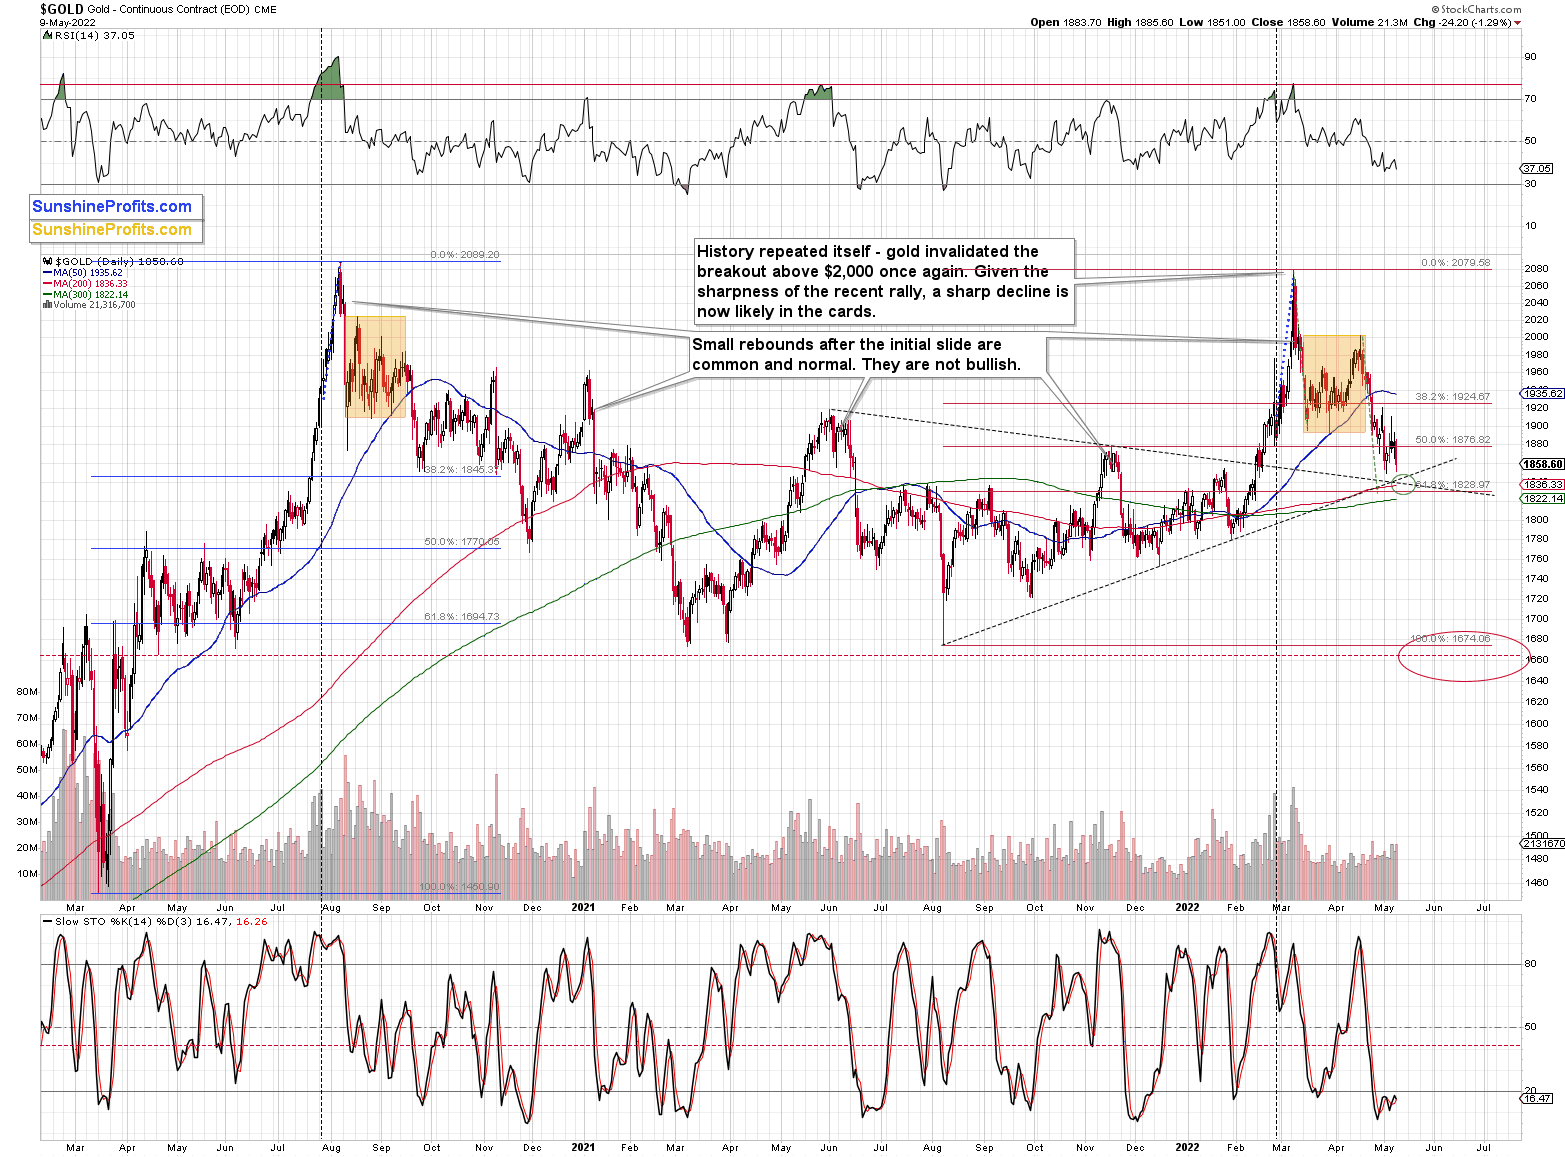
Gold moved lower – to its previous lows – but didn’t reach its downside target area (marked with green), where we have a few support levels:
- rising support line,
- declining support line,
- early-2022 high,
- the 61.8% Fibonacci retracement based on the 2021-2022 rally at about $1,829,
- 200- and 300-day moving averages (back in March 2020, gold bottomed between both averages).
Also, the RSI indicator is close to 30 but not yet at it.
Consequently, if gold declines some more here, it will have very good reasons to rally in the short term, but it doesn’t have those reasons yet.
The situation in silver is also very interesting.
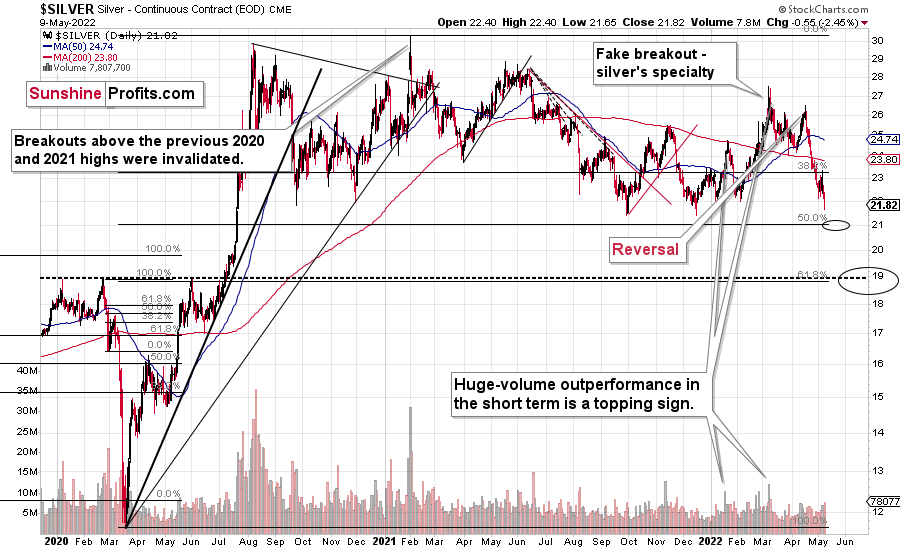
The white metal moved lower, and its intraday low was just 2 cents above our profit-take price.
Since gold is likely to move lower, and the general stock market is likely to move lower, I’m moving the downside target lower – slightly above the 50% Fibonacci retracement level based on the entire 2020-2021 decline. That’s the next strong support that’s below the 2021 lows, and that would more or less correspond to the size of the above-mentioned short-term decline in gold (at least that seems realistic to me).
It seems that mining stocks are likely to slide in the very near term too – and then they are likely to correct (probably providing an opportunity for a quick long position), quite possibly sharply.
Let’s take a look at the junior mining stocks.
In short, just like in the case of silver, I decided to move our exit prices lower – a bit below the previous lows.
Why? Because that’s where there’s the next really strong support – provided by the 61.8% Fibonacci retracement and because it seems that the general stock market will decline a bit more before correcting.
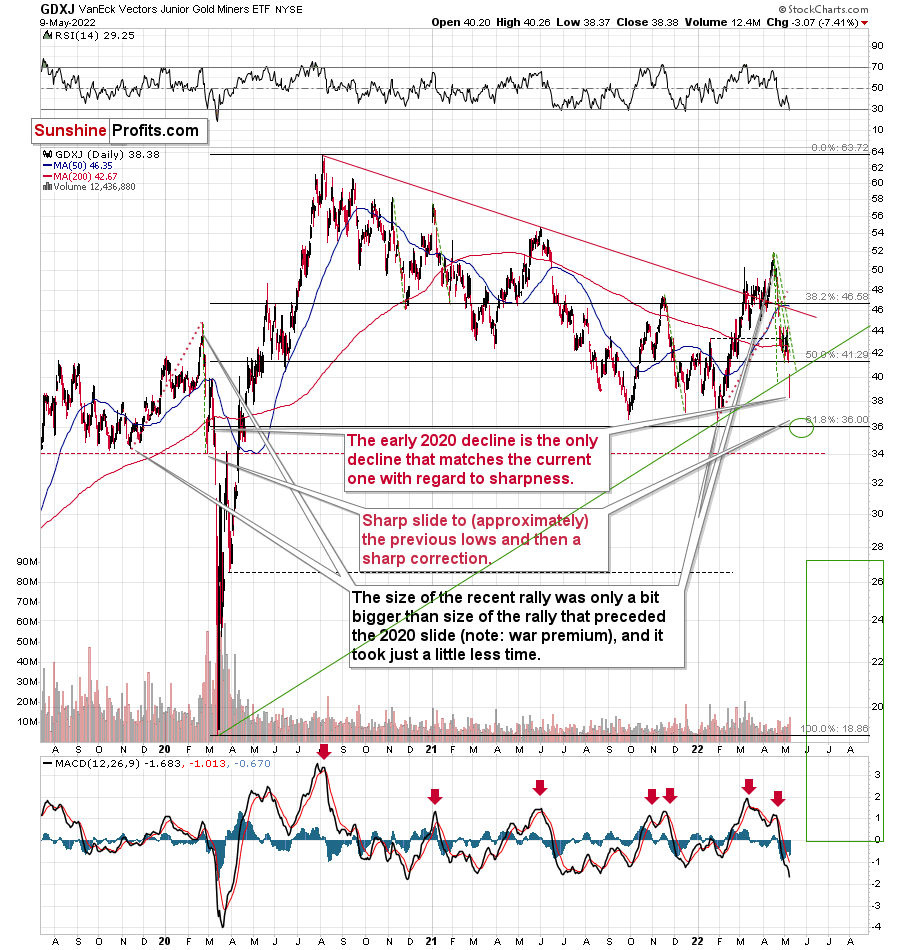
I mean, I expected juniors to decline along with the general stock market, but the huge size of juniors’ decline was more than I had expected to happen during just one session compared to what happened in the S&P 500.
If stocks have more to fall (much more than just a repeat of yesterday’s decline) and gold could repeat its yesterday’s decline, it seems that junior miners could more than repeat their slide. Since they fell by over $3 yesterday, juniors can now decline by at least another $3. This would bring them below their previous lows and below the previous target of about $37.
In fact, given the strength of the momentum, I wouldn’t even rule out the scenario in which miners slide to ~$34. Then again, let’s not forget that miners tend to show some kind of strength before rallying, so the pace of their decline would be likely to diminish before the turnaround. Therefore, expecting the sharpness of the decline to continue all the way down is not realistic. Consequently, ~$36 seems more realistic as a short-term downside target than $34 is.
Besides, the GDXJ’s 4-hour chart also suggests a move to this area.
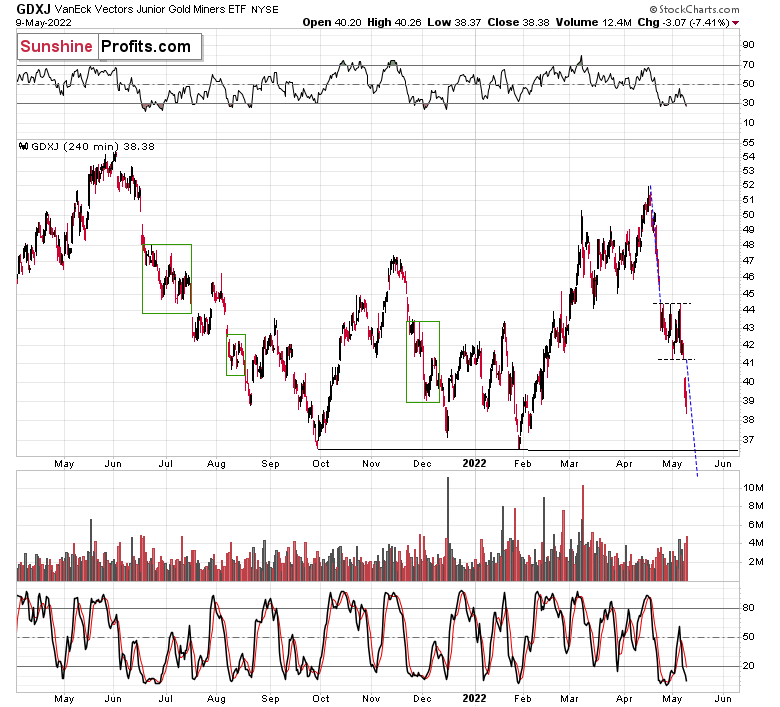
Consolidations tend to be followed by price moves that are similar to the moves that preceded them. Applying this to the letter provides us with a target that’s slightly below $36.
Also, in today’s pre-market trading, the S&P 500 futures have corrected about a third of yesterday’s decline, but the GDXJ (in London trading) corrected about 4% of yesterday’s decline (almost nothing). This suggests that junior miners really want to decline more.
Consequently, I’m moving our exit targets lower.
As far as the general stock market is concerned, my previous comments remain up-to-date despite today’s pre-market correction:
After the immediate “phew-its-not-a-0.75-rate-hike rally”, we saw a “hold-up-rates-are-still-soaring-aaah-decline”. Is the relief rally already over?
That, ladies and gentlemen, is the key question right now.
It could be the case that one rally is over, but it doesn’t mean that another one couldn’t start from just slightly lower levels.
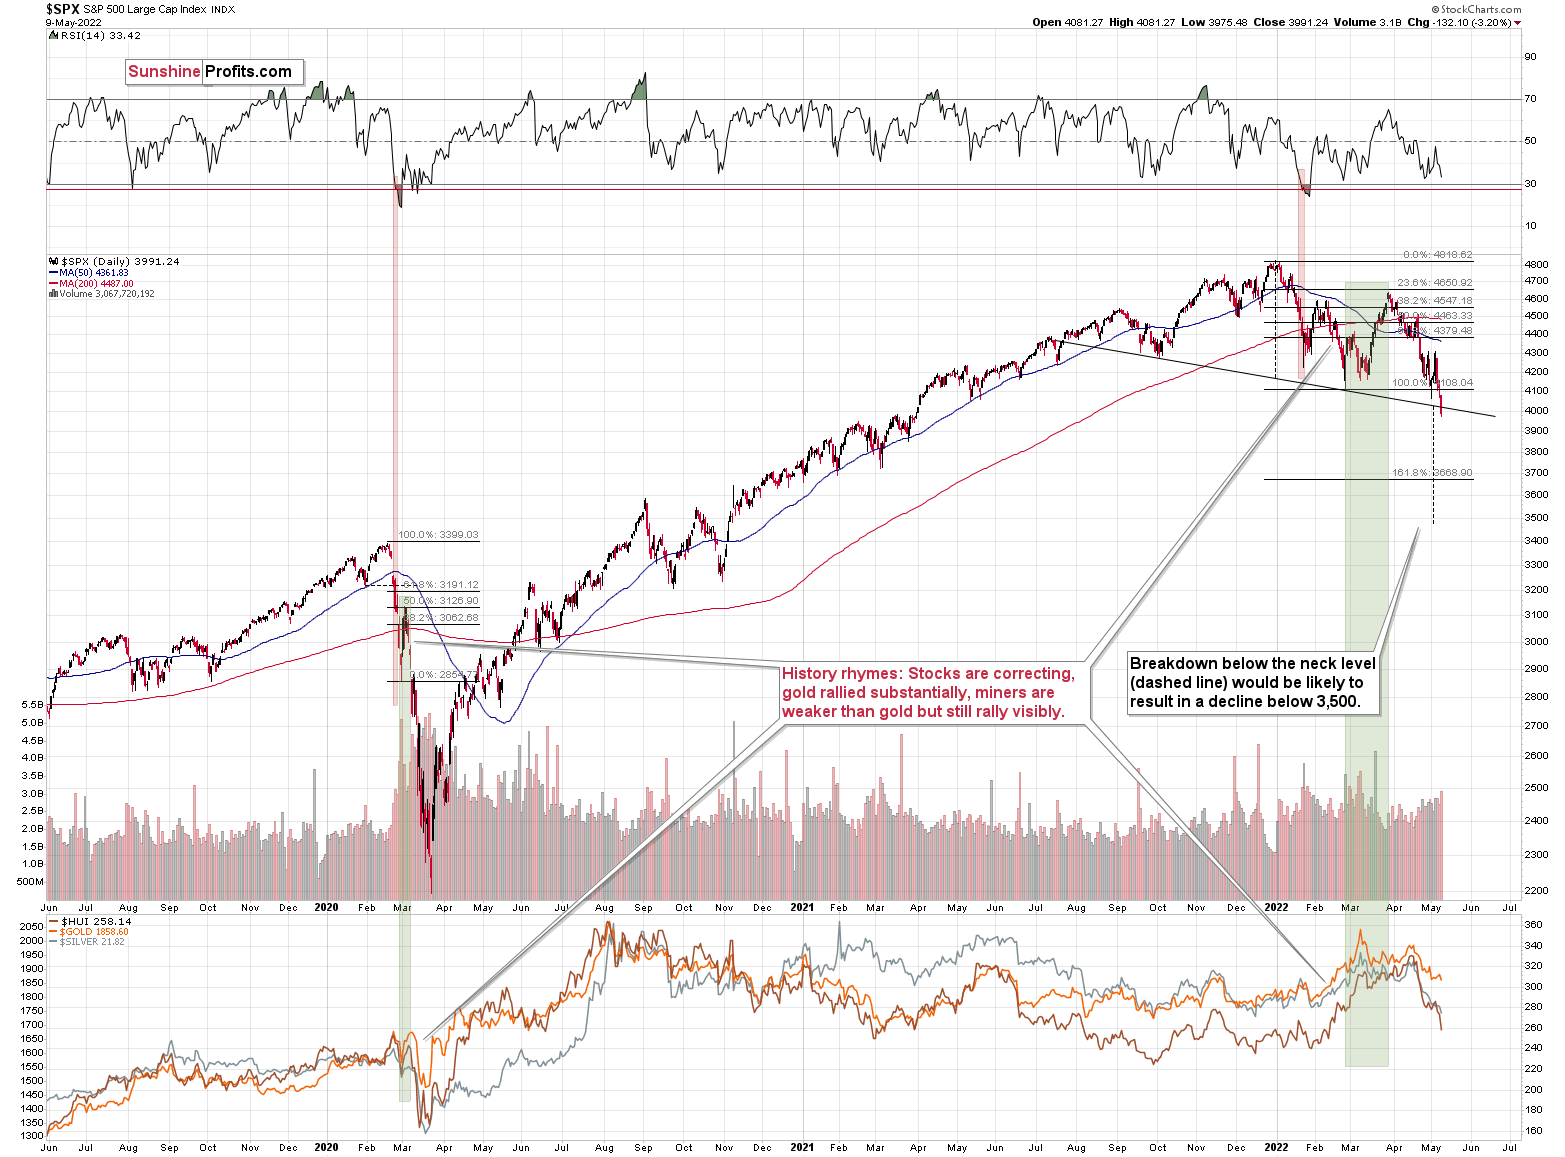
The S&P 500 is currently forming a (potential so far) head and shoulders pattern, and once it moves below its neck level (slightly above 4,000), the formation will be complete, and the next target will be below 3,500. So, yes, I expect the S&P 500 to decline below its 2021 lows in the near future.
Still, it doesn’t mean that we can’t get another brief rally in the meantime. In fact, the head and shoulders formations are often immediately followed by a brief corrective upswing – one that takes the market close to or right back to the previously broken neck level of the H&S pattern. Seeing this kind of rally would perfectly correspond to the scenario in which S&P rallies when the RSI indicator moves to 30, and it would perfectly match other potential price moves that I mentioned earlier today.
In other words, if stocks decline somewhat and then correct, it could translate into the same thing in gold, silver, and mining stocks. Given the stronger link between stocks and silver and miners duo, the latter could correct more visibly.
The chart below features the S&P 500 futures chart.
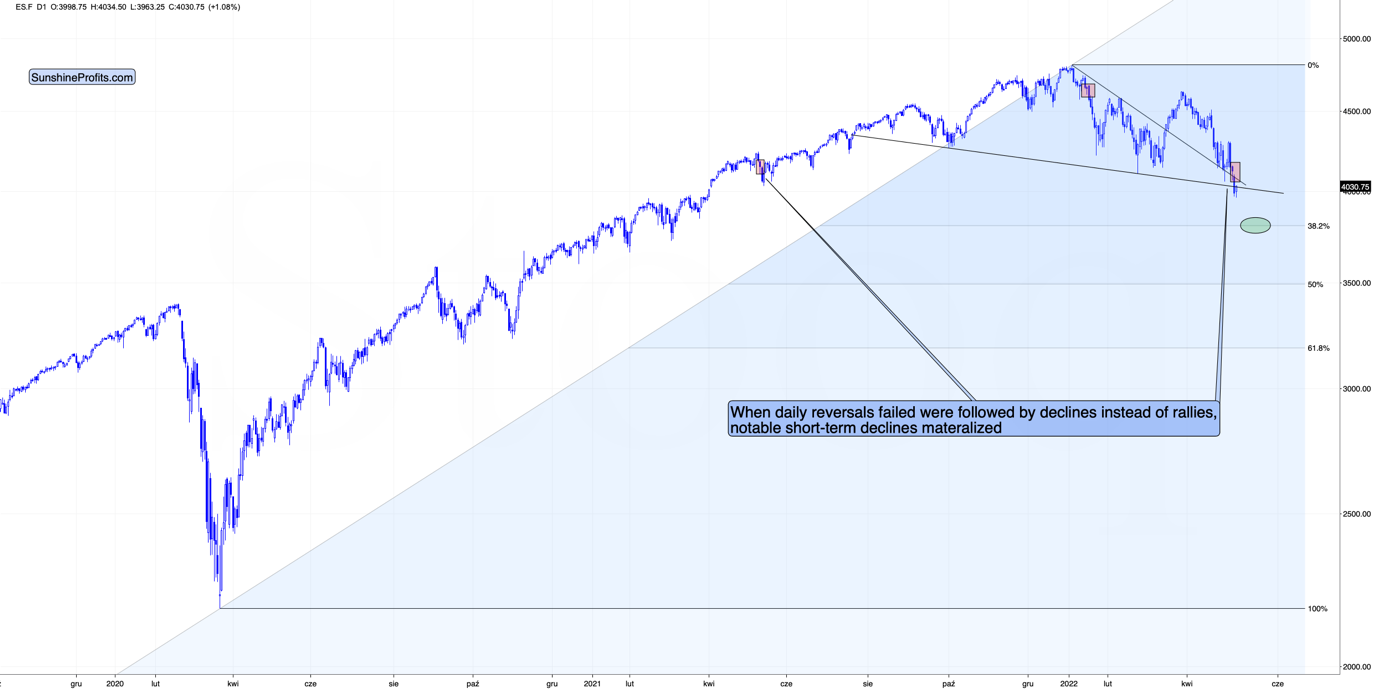
On Friday, the S&P 500 had its lowest daily close of the year. While investors might not see many technical patterns, they’ll definitely notice something like that. That’s bearish – it could trigger some panic selling among investors, and today’s pre-market decline indicates that it might already be taking place.
Interestingly, Friday’s session was a daily reversal, so it seems that stocks should be rallying today, but… they are not. Technically, it’s the futures market that shows declines, not the index itself, but futures can be used as the index’s proxy here.
That’s where the situation gets really interesting. There were very few cases when a daily reversal was followed by a decline below the reversal’s low. In fact, in the recent past, there were just two such cases, and I marked them with red rectangles. In both cases, short-term declines followed. What’s notable is that this was the way in which the January decline started, and the decline that followed was sizable.
if stocks are about to decline (continuing their pre-market decline), then they would do so after a consolidation that took the form of a flag. Thus, the price would be likely to fall by about the same amount as it had fallen before the pattern. One could argue when the previous short-term decline started (at the recent top or at the very recent top before the decline accelerated), but overall, it seems that stocks would be likely to decline below the neck level of their head and shoulders formation, and then decline some more.
Is there any nearby support level that would be strong enough to stop this short-term decline? Yes: it’s the 38.2% Fibonacci retracement level based on the 2020-2022 rally.
Back in 2020, the very first decline erased 50% of the preceding rally, but back then the market was much more volatile than it is right now, so it’s understandable.
If we see a decline to the 38.2% Fibonacci retracement and then a comeback to the previously broken neck level of the head and shoulders pattern, it would fit practically everything that I wrote above.
It would trigger a sizable decline in junior mining stocks in the near term.
If so, then it’s unlikely that junior miners are bottoming right now, as one might expect based on the chart that I featured earlier today.
Having said that, let’s take a look at the markets from a fundamental point of view.
Crashing the Party
With investors expecting a perpetually dovish Fed despite rampant inflation, they initially assumed that lower-for-longer interest rates would materialize indefinitely. However, with the harsh realities of further rate hikes rattling the bulls, I warned on Dec. 23 that 2022 would be full of hawkish surprises. I wrote:
Please note that when the Fed called inflation “transitory,” I wrote for months that officials were misreading the data. As a result, I don’t have a horse in this race. However, now, they likely have it right. Thus, if investors assume that the Fed won’t tighten, their bets will likely go bust in 2022.
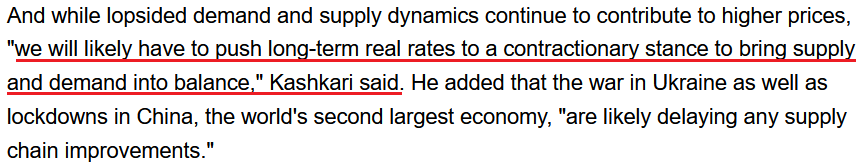
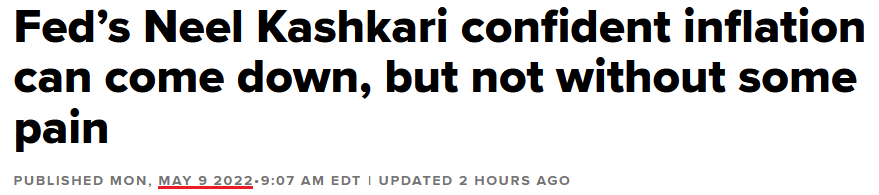
As such, with turmoil unfolding on Wall Street, the Fed’s war with inflation should continue to crush sentiment over the medium term. Case in point: I noted that Minneapolis Fed President Neel Kashkari (a major dove) stated the importance of raising real interest rates on May 8. He said:
 Source: Seeking Alpha
Likewise, speaking with CNBC on May 9, he added:
“This is a difficult challenge I think for all of us, but we also know that letting inflation stay at these very high levels, it’s not good for anybody and it’s not good for the economy’s long-run potential for anybody across the income distribution….
“I’m confident we are going to get inflation back down to our 2% target. But I am not yet confident on how much of that burden we’re going to have to carry versus getting help from the supply side.”
As a result, with killing demand the only tool in the Fed’s toolbox, the unintended consequences of QE have come to bear.
Please see below:
 Source: CNBC
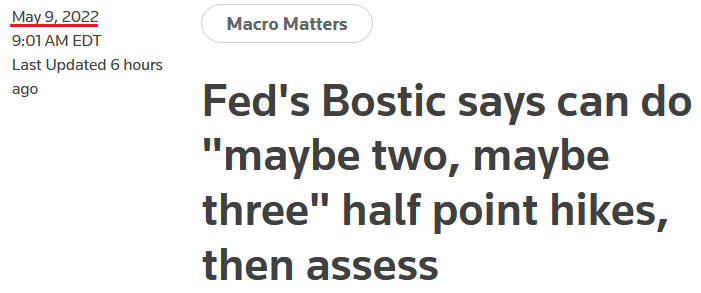
Upping the hawkish ante, Atlanta Fed President Raphael Bostic said on May 9: “The first thing on my mind is that inflation is too high and we need to act definitively and purposefully to try to get that under control ...).”
“In my view, we are going to move a couple times – maybe two, maybe three times – see what happens, see how the economy responds, see if inflation continues to move closer to our 2% target,” Bostic said. “And then we can really take a pause and see how things are going.”
Therefore, with Bostic advocating for “maybe two, maybe three” more 50 basis point rate hikes at the next few FOMC meetings, the sun is setting on Wall Street’s days of easy money.
Please see below:
 Source: Reuters
Furthermore, it was only ~six months ago that Chairman Jerome Powell was parroting his “transitory” doctrine and preaching monetary patience. Now “transitory” has turned into “expeditiously,” and investors (and eventually the U.S. economy) are suffering the consequences of their short-sighted faith in the Fed. To explain, I wrote on Nov. 4:
With Fed Chairman Jerome Powell still searching for his inflationary shooting star, the FOMC chief isn’t ready to label inflation as problematic. “I don’t think that we’re behind the curve,” he said. “I actually believe that policy is well-positioned to address the range of plausible outcomes, and that’s what we need to do.”
As a result, while taper clouds have hovered over the PMs for months and helped upend their YTD performance, have we finally reached the fundamental ‘all-clear?’ Well, in a word, no.
The reality is: while Powell has taken the path of least resistance to help calm inflation (the taper), his inability to understand the realities on the ground leaves plenty of room for hawkish shifts in the coming months (interest rate hikes).
Thus, while bonds are oversold and the stock market is near a breaking point, investors continue to ask, “Where is the Fed put?” However, with inflation and employment still running hot, the Fed’s pain threshold is likely a lot lower than the S&P 500 and the GDXJ ETF’s current levels.
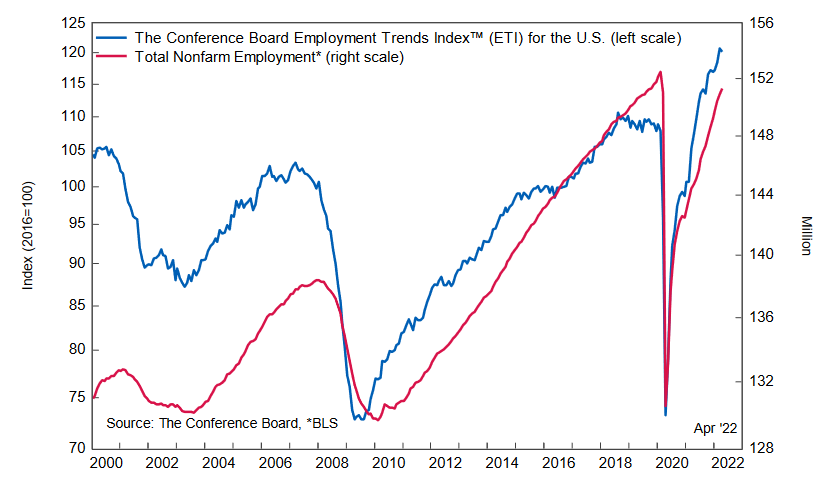
For example, The Conference Board released its Employment Trends Index (ETI) on May 9. The index decreased from 120.78 in March (an upward revision) to 120.18 in April. Agron Nicaj, Associate Economist at The Conference Board, said:
“The labor market is continuing to add jobs, especially in in-person services and in other industries that have yet to fully recover job losses incurred since the pandemic. We expect these industries to experience the greatest job and wage gains in the coming months as labor shortages show no signs of alleviating.”
“The unemployment rate is expected to get close to 3 percent by the end of the year, with little improvement in labor force participation. Employment is still down 1.2 million jobs compared to pre-pandemic levels, but The Conference Board expects 2.1 million more payroll employment gains this year. Wage growth will likely continue to accelerate as a result, adding further pressure on inflation.”
Please see below:
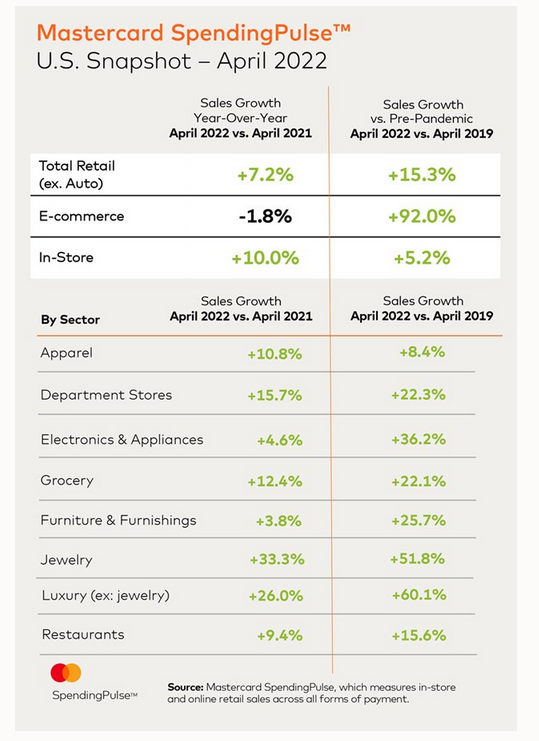
Even more noteworthy, Mastercard released its SpendingPulse U.S. retail sales report on May 5. An excerpt read:
“In-store and online retail sales across all forms of payment, total retail sales excluding auto in April increased +7.2% year-over-year (YoY) and +15.3% compared to pre-pandemic spending (2019), not adjusted for inflation. This is similar to the YoY monthly growth experienced thus far in 2022.”
Steve Sadove, senior advisor for Mastercard, added: “Whether for a family barbeque, returning to the office or senior prom, it seems like everyone is out shopping for something.”
As a result, with consumers’ spending spree driven by too much stimulus and at or near record wage inflation, the data is extremely bullish for Fed policy.
Please see below:
As further evidence, data from the U.S. Bureau of Economic Analysis (BEA) shows that card spending increased by 10.5% versus its pre-pandemic baseline for the week ended Apr. 26. Therefore, it’s another sign that the Fed’s war with inflation will be one of attrition.
Please see below:
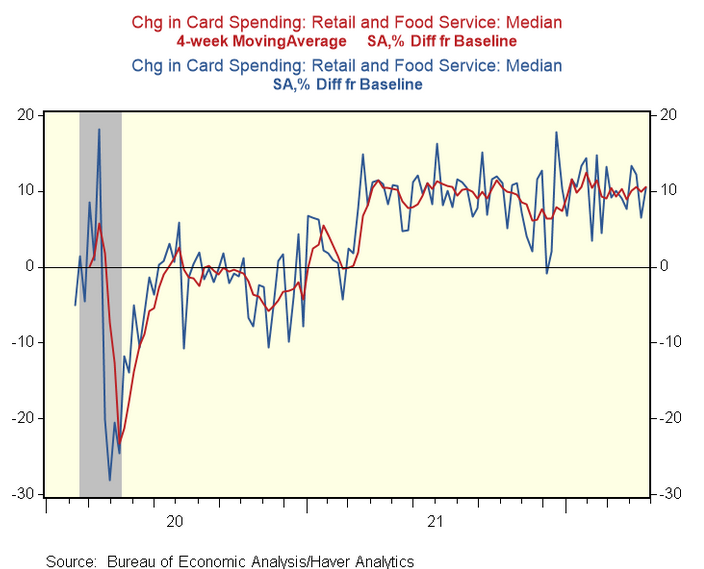
To explain, the blue line above tracks consumers’ percentage change in card spending relative to the pre-pandemic baseline, while the red line above tracks the four-week average of the same metric. If you analyze the right side of the chart, you can see that the blue line shot up when the most recent data was released. In addition, the four-week average is still well above where we were pre-COVID 19. As a result, the data adds more fuel to the hawkish fire.
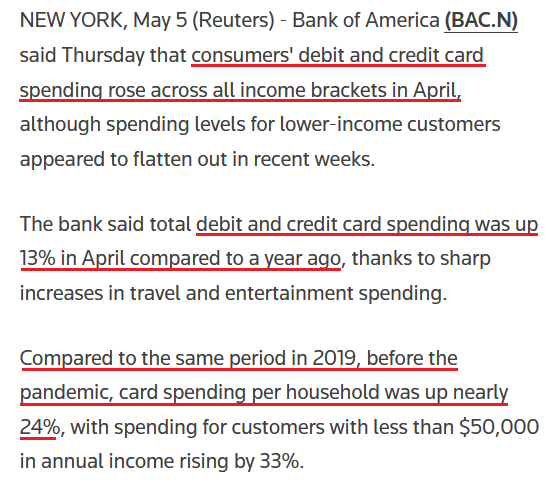
Making three of a kind, Bank of America also noted that card spending is still extremely resilient.
Please see below:
 Source: Reuters
As such, while Mastercard’s data tallies spending “across all forms of payment” and the BEA and Bank of America’s data include both debit and credit card spending, consumers are not helping the Fed dig the U.S. out of its inflationary hole. Moreover, I warned this would occur on Dec. 23. I wrote:
Anxiety has increased with U.S. monetary and fiscal spending stuck in reverse/neutral. For example, the Fed is tightening monetary policy and Americans are no longer receiving stimulus checks and enhanced unemployment benefits. Moreover, U.S. President Joe Biden’s $1.75 trillion stimulus package was torpedoed by Senator Joe Manchin. As a result, who knows if it will pass in 2022?
However, while “the Fed is trapped” crew cites these issues as reasons for an economic calamity, they often miss the forest through the trees. For example, while the fiscal spending spree may end, U.S. households are still flush with cash.
Please see below:
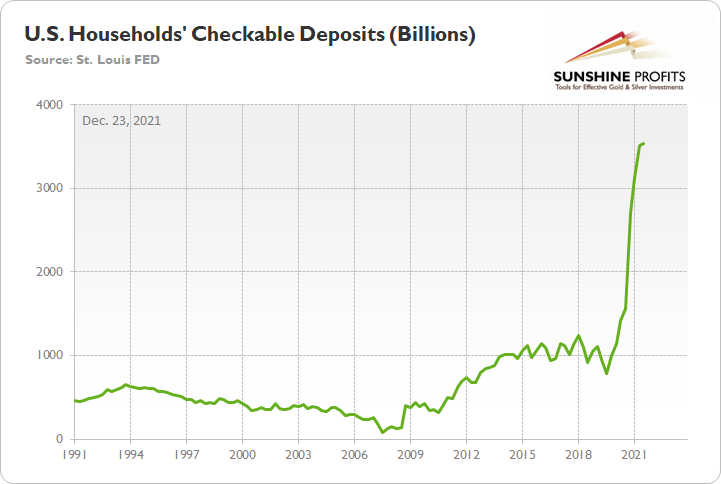
To explain, the green line above tracks U.S. households’ checkable deposits (data released on Dec. 9). In a nutshell: it’s the amount of money that U.S. households have in their checking accounts and/or demand deposit accounts.
If you analyze the vertical ascent on the right side of the chart, you can see that U.S. households have nearly $3.54 trillion in their checking accounts. For context, this is 253% more than Q4 2019 (pre-COVID-19).
I updated on Mar. 31:
There is a misnomer in the financial markets that inflation is a supply-side phenomenon. In a nutshell: COVID-19 restrictions, labor shortages, and manufacturing disruptions are the reasons for inflation’s reign. As such, when these issues are no longer present, inflation will normalize and the U.S. economy will enjoy a “soft landing.” However, investors’ faith in the narrative will likely lead to plenty of pain over the medium term.
For example, I’ve noted for some time that the U.S. economy remains in a healthy position. And with U.S. consumers flush with cash and a red hot labor market helping to bloat their wallets, their propensity to spend keeps economic data elevated. Likewise, while most investors assumed that consumer spending and inflation would fall off a cliff when enhanced unemployment benefits ended in September, the reality is that neither will die easy.
Please see below:
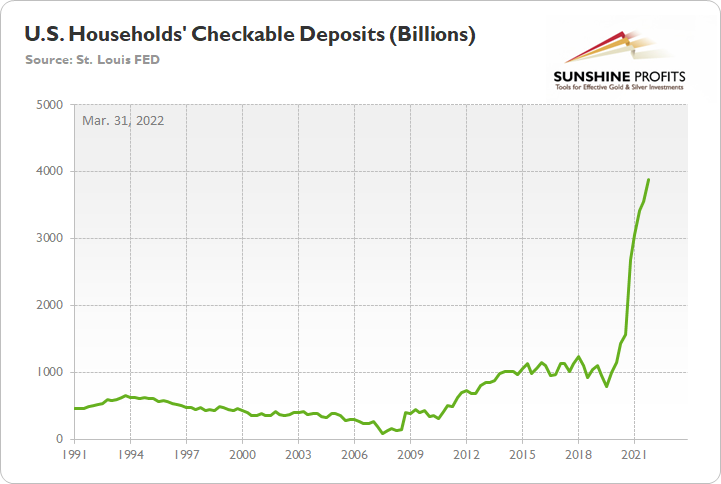
If you analyze the vertical ascent on the right side of the chart, you can see that U.S. households have nearly $3.89 trillion in their checking accounts. For context, this is 288% more than Q4 2019 (pre-COVID-19). As a result, investors misunderstand the amount of demand that’s driving inflation.
Thus, we’ve come full circle. With obvious signs of inflation overlooked by the Fed and the financial markets, the ramifications of too much stimulus are in the process of being unwound. Therefore, the roaring 2020/2021’s that coincided with record earnings beats and all-time highs for several assets – like gold, real estate, and the S&P 500 – were fueled by unprecedented stimulus. However, the liquidity circus also created the highest inflation since the 1980s. As such, reversing the latter should result in plenty of pain for the former.
Finally, while the data above highlights the strength of U.S. consumers, the warmer weather should only enhance their spending fervor. For context, I wrote on Jan. 31.
The U.S. economy is growing well ahead of its pre-pandemic trend. Moreover, while disruptions from the Omicron variant will likely slow growth in Q1, the outbreak should calm down when warmer weather arrives. With the season also allowing for patio dining, camping trips, and other outdoor activities that support economic growth, Q1’s weakness should be short-lived.
To that point, data from Kayak shows that U.S. consumers are eager for adventure.
Please see below:
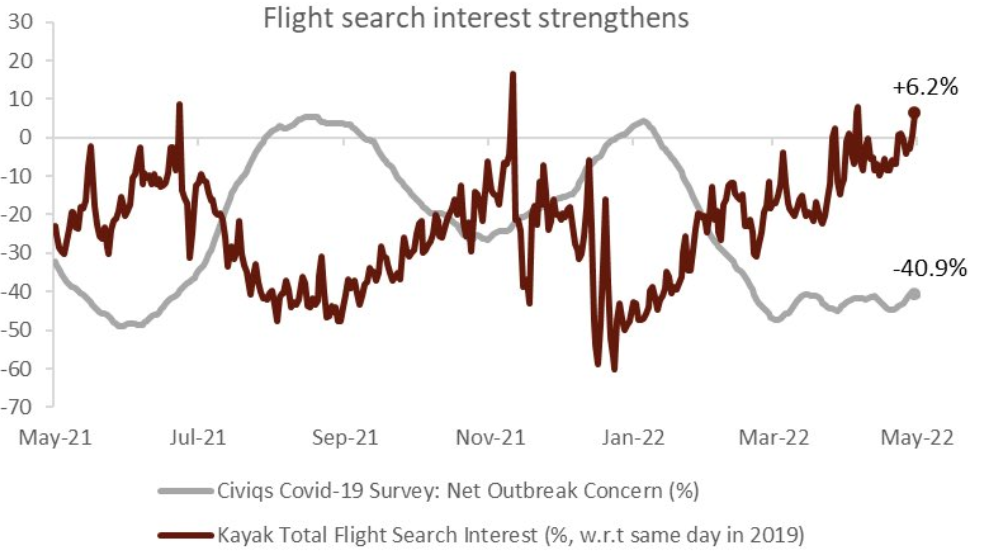 Source: Renaissance Macro
To explain, the brown line above tracks the percentage change in flight searches versus the same day in 2019, while the gray line above tracks the net percentage of Americans concerned about COVID-19. If you analyze the right side of the chart, you can see that coronavirus concerns remain low and Americans are excited about the travel season. As a result, the data supports more spending, continued inflation, and more hawkish Fed policy over the next few months.
The bottom line? The Fed has crashed the party and taken away the punch bowl. Moreover, with elevated consumer spending coupled with unanchored wage pressures, the Fed’s war on inflation should result in plenty of casualties over the medium term. Therefore, investors awaiting a dovish pivot could be waiting a long time.
In conclusion, the PMs suffered sharp drawdowns on May 9, and the GDXJ ETF was clobbered. Moreover, while the recent sell-off may present us with a short-term trading opportunity (I will keep you posted), the PMs’ medium-term outlooks remain profoundly bearish. As such, lower lows should confront gold, silver, and mining stocks over an extended time horizon.
Naturally, as always, I’ll keep you – my subscribers – informed.
Overview of the Upcoming Part of the Decline
- It seems to me that the post-decline consolidation is now over, and that gold, silver, and mining stocks are now likely to continue their medium-term decline. A brief, short-term rally could materialize soon, anyway.
- It seems that the first ( bigger ) stop for gold will be close to its previous 2021 lows, slightly below $1,800 . Then it will likely correct a bit, but it’s unclear if I want to exit or reverse the current short position based on that – it depends on the number and the nature of the bullish indications that we get at that time.
- After the above-mentioned correction, we’re likely to see a powerful slide, perhaps close to the 2020 low ($1,450 - $1,500).
- If we see a situation where miners slide in a meaningful and volatile way while silver doesn’t (it just declines moderately), I plan to – once again – switch from short positions in miners to short positions in silver. At this time, it’s too early to say at what price levels this could take place, and if we get this kind of opportunity at all – perhaps with gold close to $1,600.
- I plan to exit all remaining short positions once gold shows substantial strength relative to the USD Index while the latter is still rallying. This may be the case with gold close to $1,350 - $1,400. I expect silver to fall the hardest in the final part of the move. This moment (when gold performs very strongly against the rallying USD and miners are strong relative to gold after its substantial decline) is likely to be the best entry point for long-term investments, in my view. This can also happen with gold close to $1,375, but at the moment it’s too early to say with certainty.
- As a confirmation for the above, I will use the (upcoming or perhaps we have already seen it?) top in the general stock market as the starting point for the three-month countdown. The reason is that after the 1929 top, gold miners declined for about three months after the general stock market started to slide. We also saw some confirmations of this theory based on the analogy to 2008. All in all, the precious metals sector is likely to bottom about three months after the general stock market tops.
- The above is based on the information available today, and it might change in the following days/weeks.
You will find my general overview of the outlook for gold on the chart below:
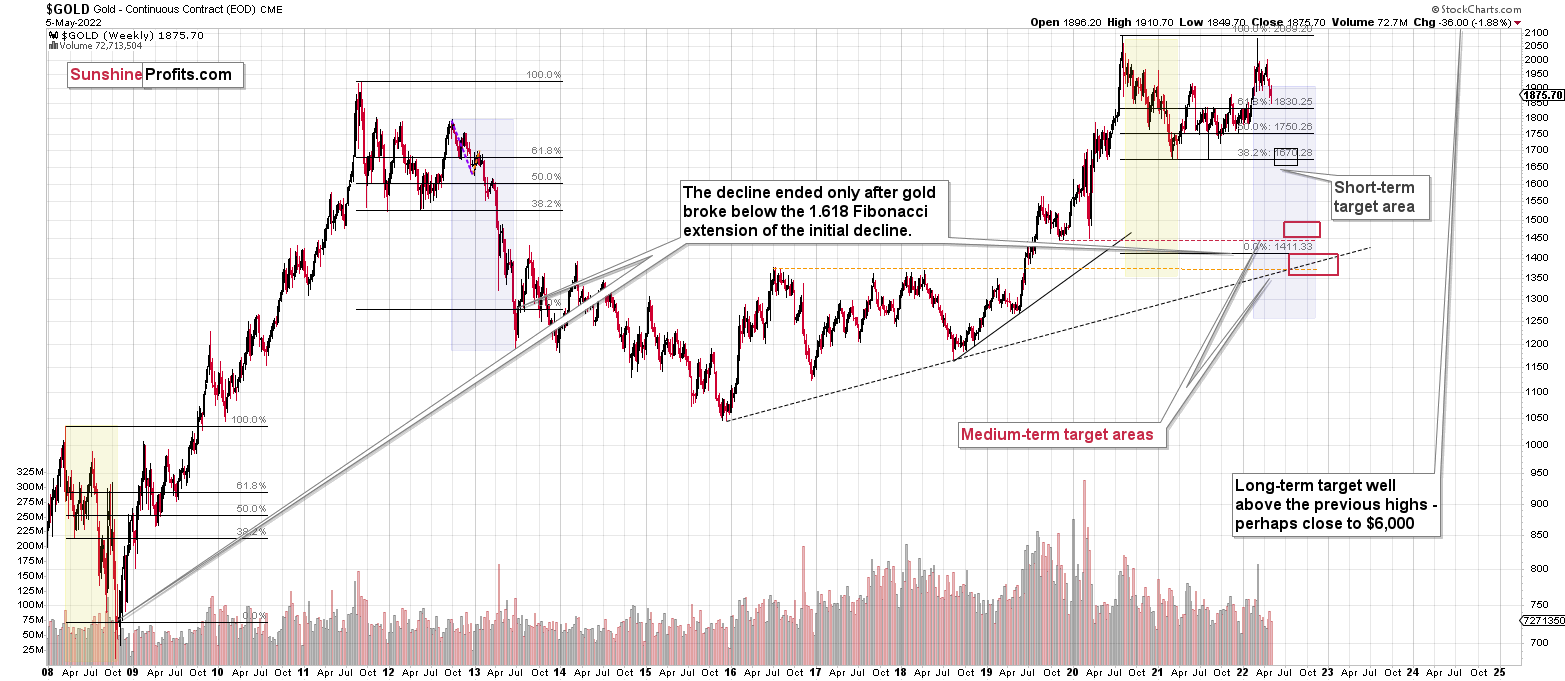
Please note that the above timing details are relatively broad and “for general overview only” – so that you know more or less what I think and how volatile I think the moves are likely to be – on an approximate basis. These time targets are not binding or clear enough for me to think that they should be used for purchasing options, warrants or similar instruments.
Letters to the Editor
Q: In accordance with your indications, I execute, perhaps somewhat prematurely: what do you think of selling the GDXD and going long on the GDXU? As always, I’m enjoying your analysis.
A: Thank you, I’m very happy to see that you’re enjoying the results of my work. In short, I think that going long mining stocks after another brief decline might be a good idea (I plan to do it). However:
- Not at this time yet.
- I wouldn’t necessarily use the GDXU for this trade as long positions are against the medium-term trend and thus are particularly risky at this time. Applying 3x leverage might not be optimal from the risk to reward point of view. The GDXJ (unleveraged might be a better choice).
On a side note, the current position is the last one for which I’m featuring any price levels for the GDXD/GDXU pair – it seems to me that featuring them might be doing more harm than good, as those who can use those instruments don’t really need specific exit levels and they will easily select them on their own, and those who really need those levels (as they can’t calculate those levels on their own), shouldn’t really be using them as they are generally too risky for beginning investors or those that have less experience in trading.
Summary
Summing up, it seems that we are about to see a short-term corrective upswing in the precious metals sector (after another very short-term move lower), even though the medium-term trend remains clearly down.
The medium-term downtrend is likely to continue shortly (perhaps after a weekly or a few-day long correction). As investors are starting to wake up to the reality, the precious metals sector (particularly junior mining stocks) is declining sharply. Here are the key aspects of the reality that market participants have ignored:
- rising real interest rates,
- rising USD Index values.
Both of the aforementioned are the two most important fundamental drivers of the gold price. Since neither the USD Index nor real interest rates are likely to stop rising anytime soon (especially now that inflation has become highly political), the gold price is likely to fall sooner or later. Given the analogy to 2012 in gold, silver, and mining stocks, “sooner” is the more likely outcome.
It seems that our profits from short positions are going to become truly epic in the coming months.
For now, I’m adjusting the exit price levels. Please note that they are “binding exit prices”, which means that I think that exiting the short positions without an additional (manual) confirmation from me is a good idea. I think that once these short positions are closed, entering long ones (100% of the regular position size) is also a good idea. If one wants to use a leveraged ETF for this long trade, the JNUG might be worth considering. However, it seems that in most cases, simply using the GDXJ would be sufficient (I’m writing about 100% of the regular position size, not 200% or 300% as I am right now in the case of the short positions). Then again, it’s your capital, and you can do with it whatever you want and are comfortable with.
Of course, if you’re not comfortable with such short-term trading, you can ignore this quick trade and focus on the bigger downturn.
After the final sell-off (that takes gold to about $1,350-$1,500), I expect the precious metals to rally significantly. The final part of the decline might take as little as 1-5 weeks, so it's important to stay alert to any changes.
As always, we'll keep you – our subscribers – informed.
To summarize:
Trading capital (supplementary part of the portfolio; our opinion): Full speculative short positions (300% of the full position) in junior mining stocks are justified from the risk to reward point of view with the following binding exit profit-take price levels:
Mining stocks (price levels for the GDXJ ETF): binding profit-take exit price: $36.23; stop-loss: none (the volatility is too big to justify a stop-loss order in case of this particular trade)
Alternatively, if one seeks leverage, we’re providing the binding profit-take levels for the JDST (2x leveraged) and GDXD (3x leveraged – which is not suggested for most traders/investors due to the significant leverage). The binding profit-take level for the JDST: $11.98; stop-loss for the JDST: none (the volatility is too big to justify a SL order in case of this particular trade); binding profit-take level for the GDXD: $15.98; stop-loss for the GDXD: none (the volatility is too big to justify a SL order in case of this particular trade).
For-your-information targets (our opinion; we continue to think that mining stocks are the preferred way of taking advantage of the upcoming price move, but if for whatever reason one wants / has to use silver or gold for this trade, we are providing the details anyway.):
Silver futures downside profit-take exit price: $21.23
SLV profit-take exit price: $19.63 (if your previous position was closed, I don’t think there is a need to reopen it now, but the final decision is up to you)
ZSL profit-take exit price: $29.55 (if your previous position was closed, I don’t think there is a need to reopen it now, but the final decision is up to you)
Gold futures downside profit-take exit price: no position (the target was already reached)
HGD.TO – alternative (Canadian) inverse 2x leveraged gold stocks ETF – the upside profit-take exit price: $7.78
HZD.TO – alternative (Canadian) inverse 2x leveraged silver ETF – the upside profit-take exit price: $22.87 (if your previous position was closed, I don’t think there is a need to reopen it now, but the final decision is up to you)
Long-term capital (core part of the portfolio; our opinion): No positions (in other words: cash
Insurance capital (core part of the portfolio; our opinion): Full position
Whether you already subscribed or not, we encourage you to find out how to make the most of our alerts and read our replies to the most common alert-and-gold-trading-related-questions.
Please note that we describe the situation for the day that the alert is posted in the trading section. In other words, if we are writing about a speculative position, it means that it is up-to-date on the day it was posted. We are also featuring the initial target prices to decide whether keeping a position on a given day is in tune with your approach (some moves are too small for medium-term traders, and some might appear too big for day-traders).
Additionally, you might want to read why our stop-loss orders are usually relatively far from the current price.
Please note that a full position doesn't mean using all of the capital for a given trade. You will find details on our thoughts on gold portfolio structuring in the Key Insights section on our website.
As a reminder - "initial target price" means exactly that - an "initial" one. It's not a price level at which we suggest closing positions. If this becomes the case (like it did in the previous trade), we will refer to these levels as levels of exit orders (exactly as we've done previously). Stop-loss levels, however, are naturally not "initial", but something that, in our opinion, might be entered as an order.
Since it is impossible to synchronize target prices and stop-loss levels for all the ETFs and ETNs with the main markets that we provide these levels for (gold, silver and mining stocks - the GDX ETF), the stop-loss levels and target prices for other ETNs and ETF (among other: UGL, GLL, AGQ, ZSL, NUGT, DUST, JNUG, JDST) are provided as supplementary, and not as "final". This means that if a stop-loss or a target level is reached for any of the "additional instruments" (GLL for instance), but not for the "main instrument" (gold in this case), we will view positions in both gold and GLL as still open and the stop-loss for GLL would have to be moved lower. On the other hand, if gold moves to a stop-loss level but GLL doesn't, then we will view both positions (in gold and GLL) as closed. In other words, since it's not possible to be 100% certain that each related instrument moves to a given level when the underlying instrument does, we can't provide levels that would be binding. The levels that we do provide are our best estimate of the levels that will correspond to the levels in the underlying assets, but it will be the underlying assets that one will need to focus on regarding the signs pointing to closing a given position or keeping it open. We might adjust the levels in the "additional instruments" without adjusting the levels in the "main instruments", which will simply mean that we have improved our estimation of these levels, not that we changed our outlook on the markets. We are already working on a tool that would update these levels daily for the most popular ETFs, ETNs and individual mining stocks.
Our preferred ways to invest in and to trade gold along with the reasoning can be found in the how to buy gold section. Furthermore, our preferred ETFs and ETNs can be found in our Gold & Silver ETF Ranking.
As a reminder, Gold & Silver Trading Alerts are posted before or on each trading day (we usually post them before the opening bell, but we don't promise doing that each day). If there's anything urgent, we will send you an additional small alert before posting the main one.
Thank you.
Przemyslaw Radomski, CFA
Founder, Editor-in-chief

