

Briefly: in our opinion, full (300% of the regular position size) speculative short positions in junior mining stocks are justified from the risk/reward point of view at the moment of publishing this Alert.
The precious metals sector moved higher last week, and even though gold moved only a bit higher on Friday, miners’ daily upswing was more noticeable. Are miners showing strength here? If so, is this the start of a new, powerful uptrend?
As you have probably realized based on the title of today’s analysis, that’s not the case.
Let’s take a look at the charts and see what really changed.
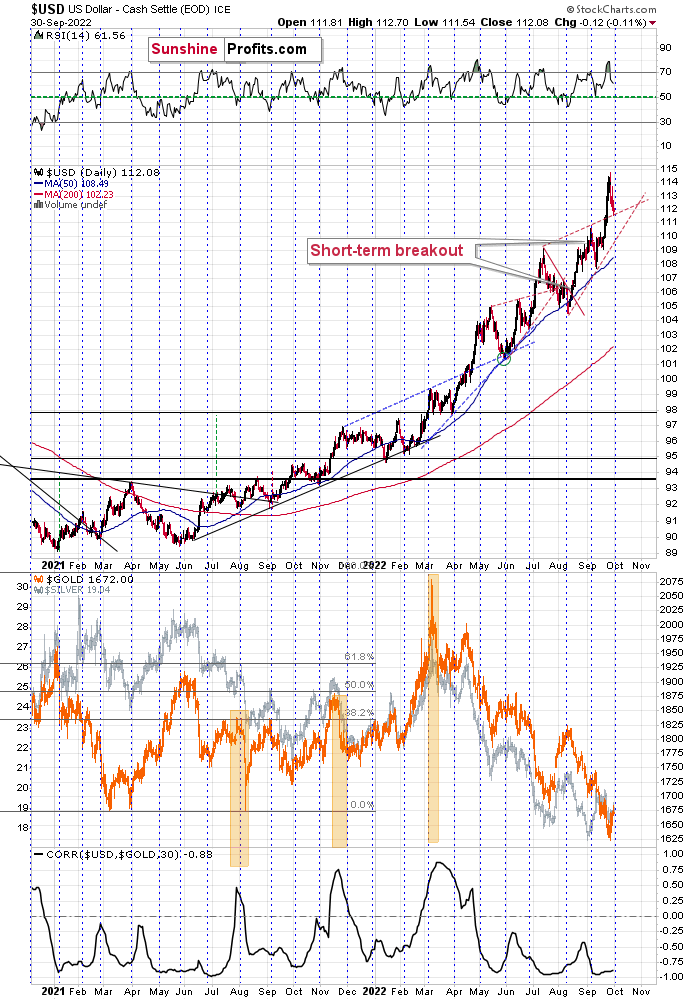
Nothing changed in the USD Index – it just verified the breakout above its rising support/resistance line. It declined close to the turn of the month, which is when it tends to reverse its course.
As the breakout held, the outlook for the U.S. dollar remains bullish, and given the above-mentioned monthly seasonality for the dollar, it seems that the rally is likely to resume any day now.
Given the strongly negative correlation between gold and the USD, the above is likely to translate into lower precious metals values.
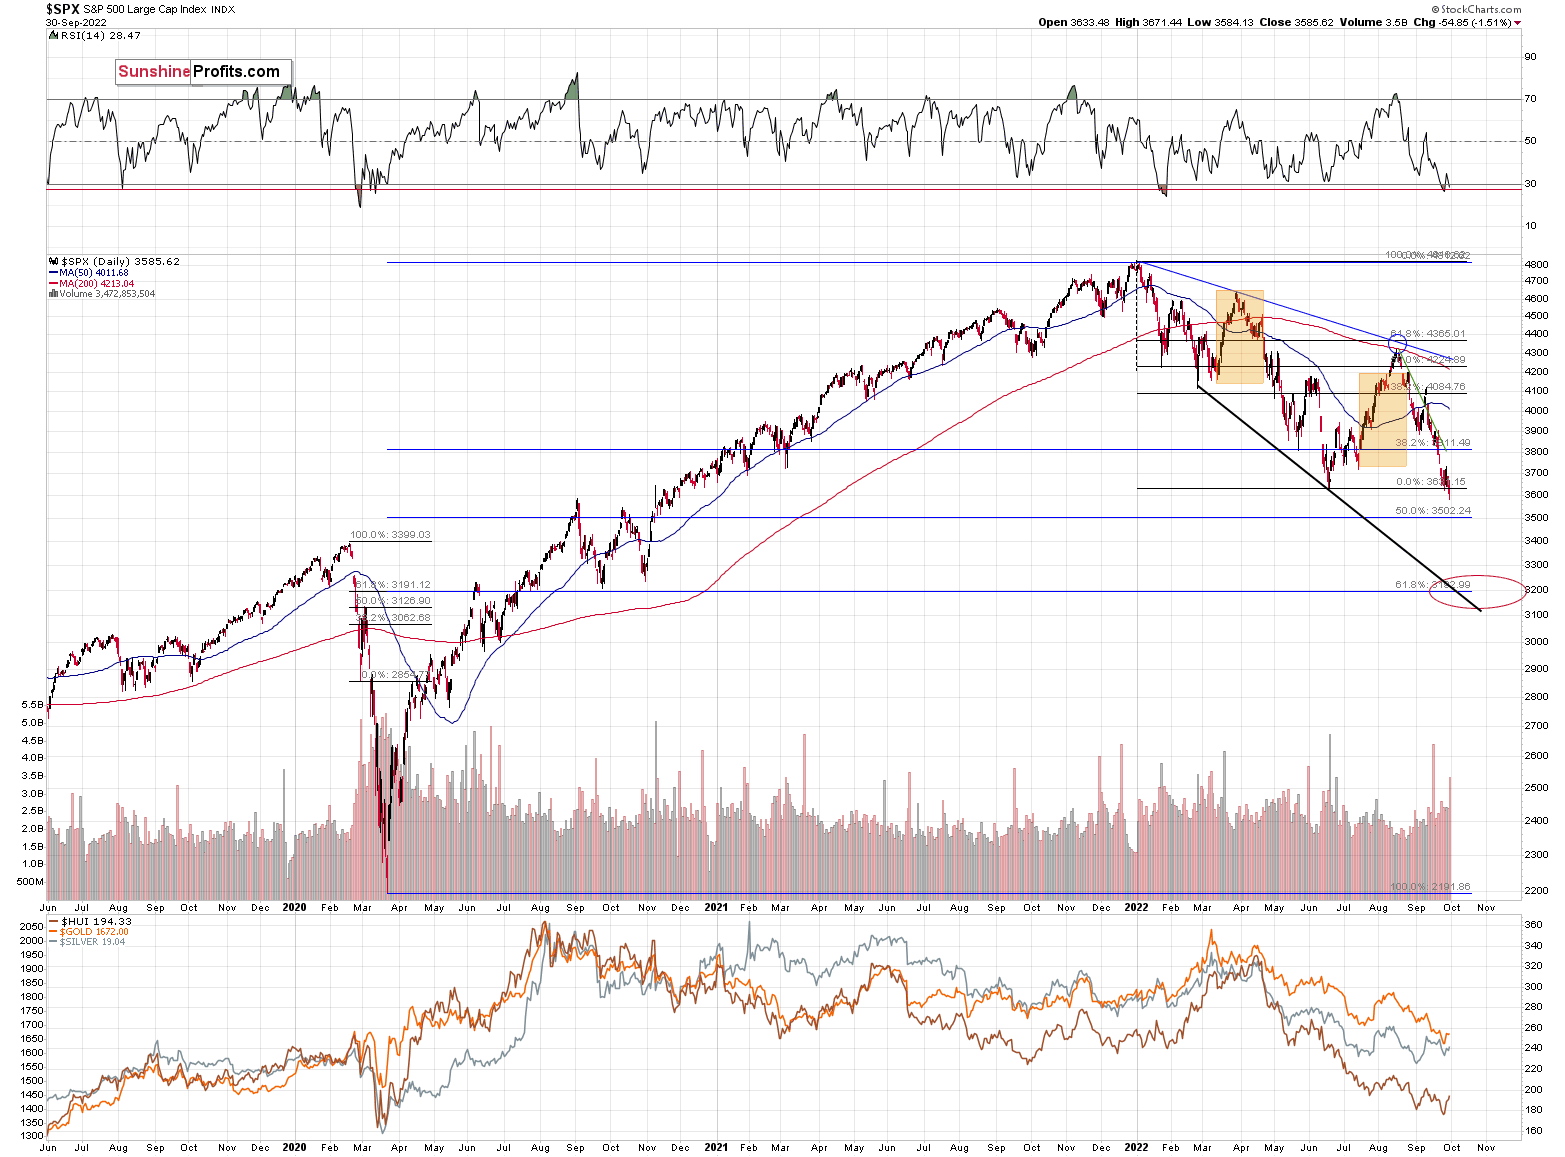
The general stock market just closed the day and the week at new yearly lows. This breakdown took place on strong volume, and the S&P 500 futures were lower in Monday’s pre-market trading.
This is a very bearish combination of factors for stocks. It’s also bearish for the parts of the precious metals market that are most aligned with stocks: silver and mining stocks. And, in particular, for junior mining stocks.
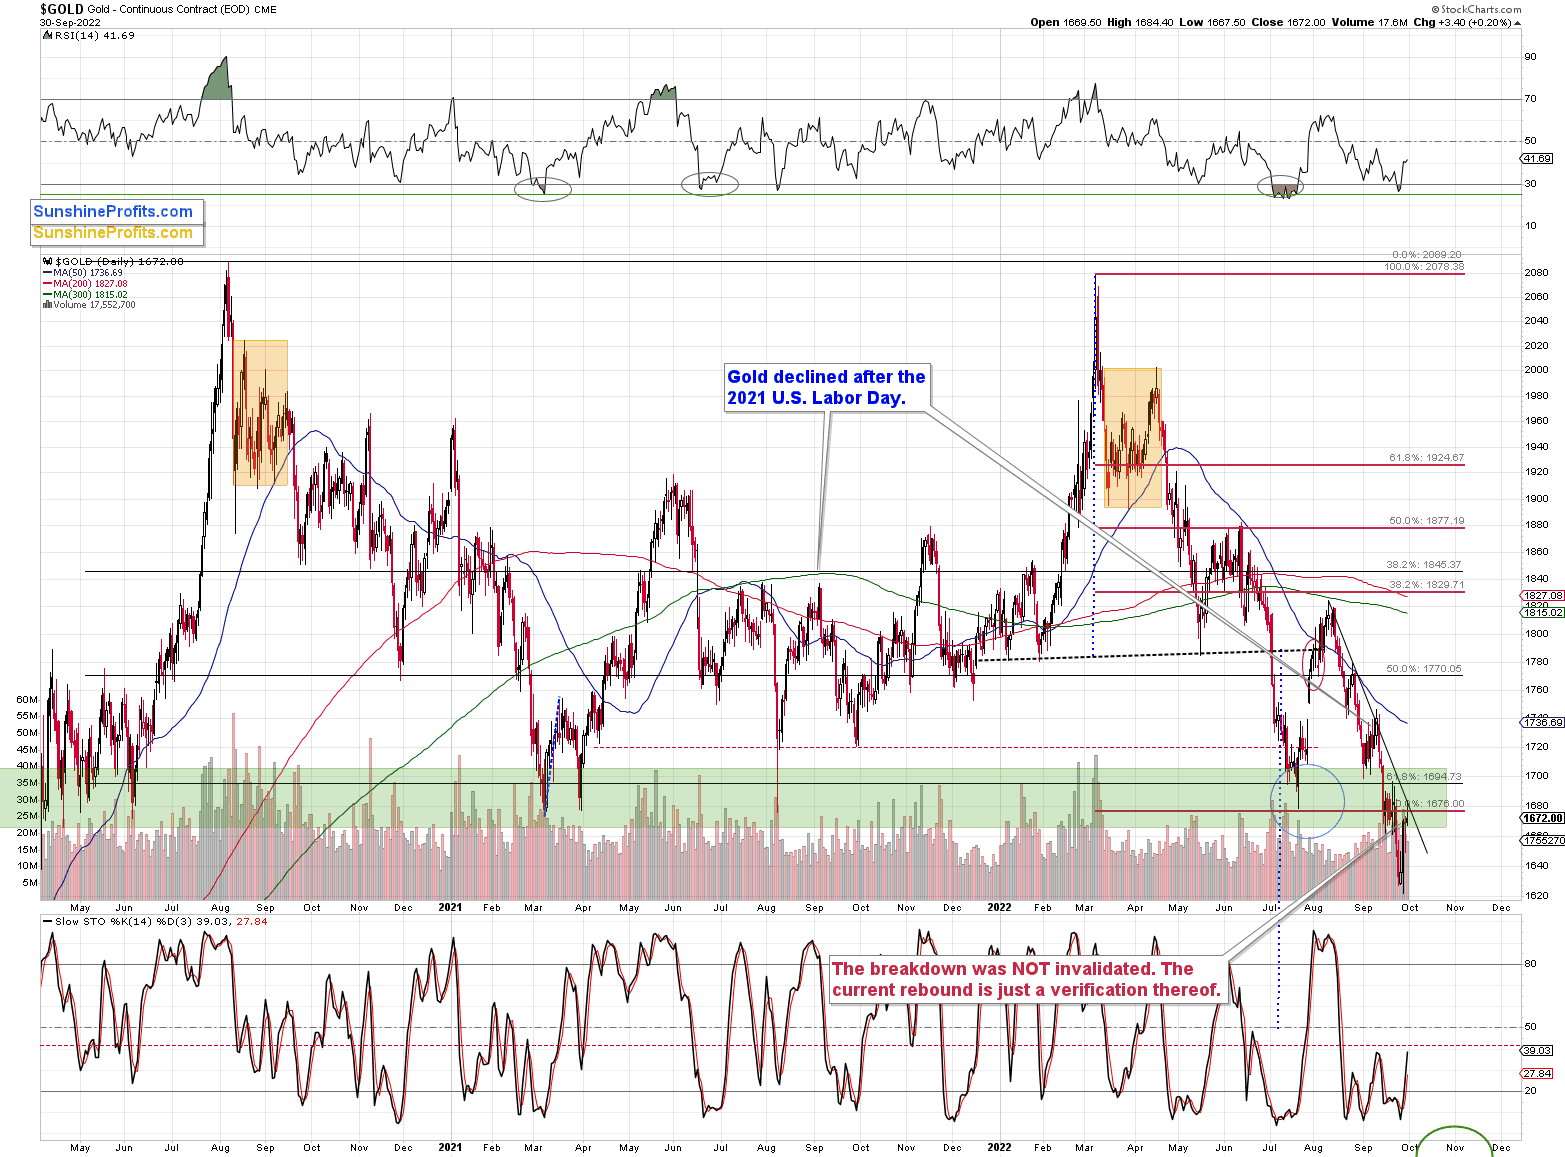
During Friday’s session, gold moved higher at first, but then reversed and ended the day only $3.40 higher. In other words, it formed a daily reversal.
Interestingly, the intraday high was very close to the declining, short-term resistance line. Do you remember what happened to the price of gold when it previously moved to this resistance line?
It happened in early September, and gold then declined by more than $100 in a rather sharp manner. I can’t promise any kind of performance, but the history tends to rhyme, right?
Actually, the situation is more bearish this time, as this time gold verified the breakdown below the green resistance zone, which opens the door wide open for really big declines – 2013 style.
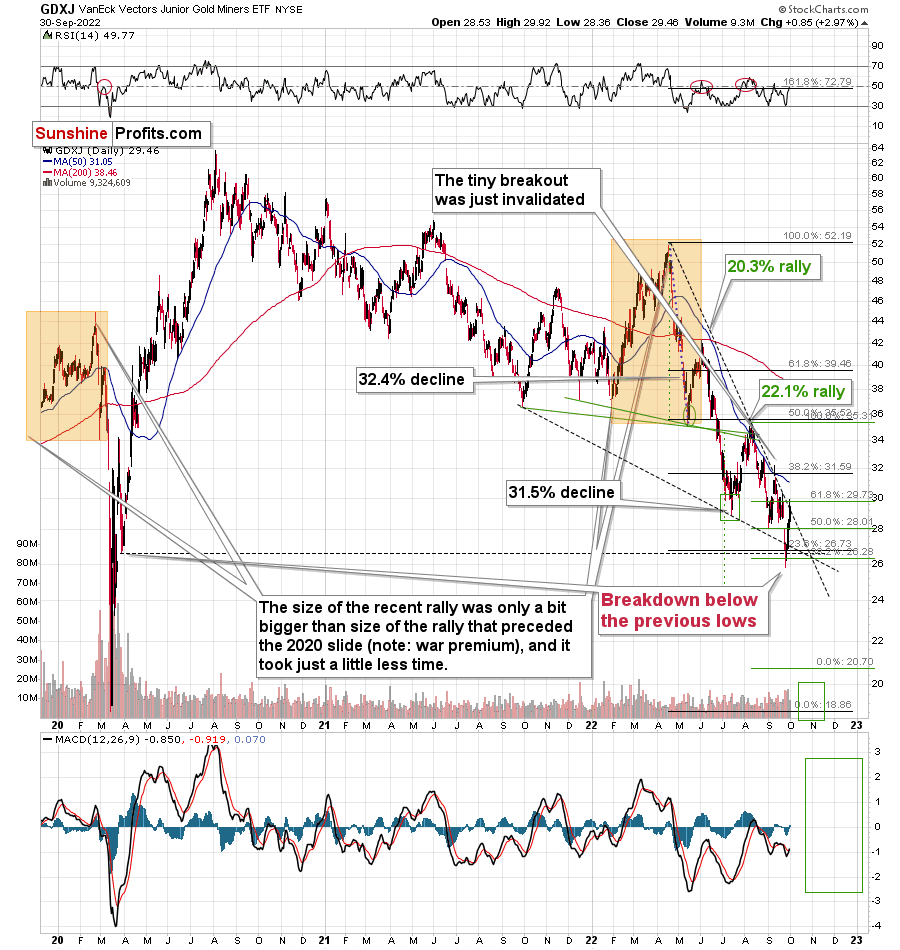
Junior mining stocks moved higher on Friday in a more visible manner, despite only a tiny rally in gold and an important decline in the general stock market.
What gives? Are they really starting to soar here?
No. Junior miners were recently a ridiculously weak market, and there’s a tendency for the weakest parts of the market to perform relatively well right before declines. Gamestop’s share price didn’t move to a new 2022 low on Friday, by the way.
Why would this be the case? Because those who have very little idea about the trends tend to buy exactly at the wrong times, and it seems that it was the case on Friday as well.
Technically, just like gold, junior miners just moved to their declining resistance line without breaking it.
Therefore, not that much changed, despite the quick rally. The downtrend remains intact.
In my previous analyses, I wrote that the GDXJ was unlikely to break back above $30, and it didn’t. Friday’s intraday high was $29.92, and it declined a bit before the end of the day.
Given gold’s and stocks’ technical situations, it’s highly likely that junior miners will reverse their course and get back to their previous downtrend shortly (thus increasing profits on our short positions in this sector).
Having said that, let’s take a look at the markets from a more fundamental point of view:
Running to the Rescue
With the Bank of England (BoE) resuming QE due to a “material risk to U.K. financial stability,” there has been some confusion about the potential impact on gold, silver, mining stocks, and the USD Index. For context, I wrote on Sep. 29:
With British pension funds implementing leveraged strategies to enhance their returns, some were caught flat-footed when bond prices tumbled amid the surge in global interest rates.
In addition, with these institutions suffering heavy losses and their brokers demanding collateral, the funds opted to sell their U.K. bonds rather than post more cash. However, with buyers nowhere to be found, further selling would have resulted in even lower bond prices, more margin calls, and a continuation of the vicious circle. Therefore, the BoE stepped in to provide liquidity amid the chaos.
However:
The U.K. Consumer Price Index (CPI) increased by 9.9% year-over-year (YoY) in August. As a result, Britain has a worse inflation problem than the U.S. Furthermore, purchasing U.K. bonds and increasing the money supply is like putting out one fire by starting another.
Second, the pound has been under immense pressure in 2022. In fact, the GBP/USD’s rally on Sep. 28 was largely immaterial when considering that the currency pair closed at an all-time low on Sep. 26. Thus, the extension of QE is profoundly bearish for the GPB.
Please see below:
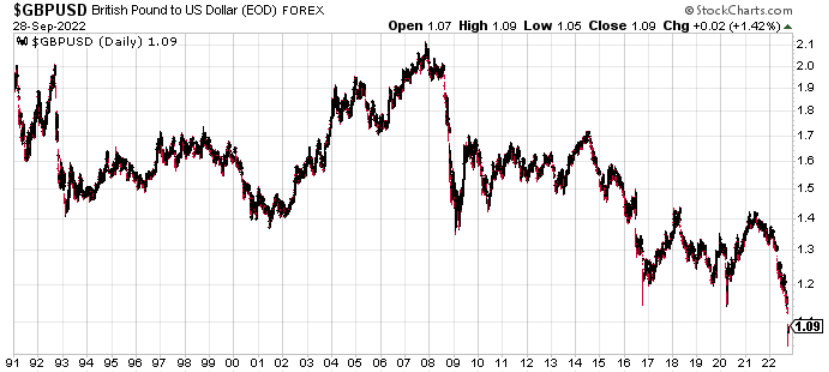
To that point, while the GBP/USD has bounced off of dramatically oversold levels, resuming QE is bearish, not bullish. Remember, QE increases the supply of British pounds, and a larger quantity diminishes the currency's value. In contrast, with the Fed implementing QT, it's reducing the supply of U.S. dollars, which is bullish for the USD Index. Likewise, since the BoE can only execute one policy at a time, enacting QE to manage interest rates should weigh on its currency over the medium term.
As evidence, Japan implements a similar strategy where it suppresses interest rates at the expense of the yen.
Please see below:
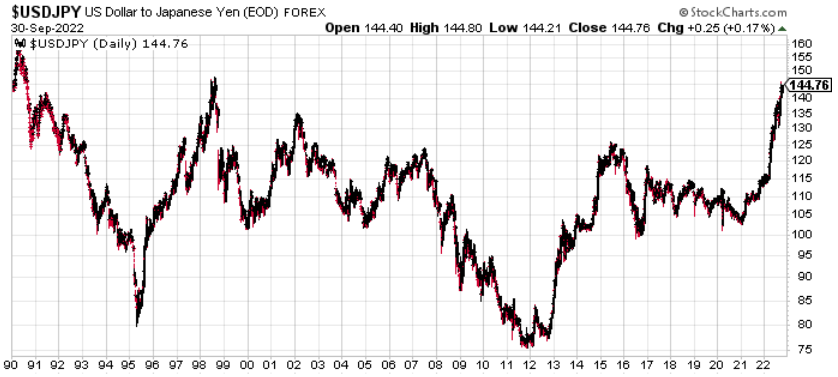
To explain, Japan’s massive QE program increases the supply of yen, and with the U.S. implementing the opposite policy, the USD/JPY has risen to levels unseen in 20+ years. So please note that these central banks only have two options.
- Implement QE, reduce interest rates, hurt their currency
- Implement QT, accept higher interest rates, and support their currency
Thus, due to low inflation, the Bank of Japan (BOJ) chose the first option with relatively few consequences. However, the U.K. has ~10% inflation, and the resumption of QE is a sign of weakness, not strength.
As a result, the dollar basket’s recent pullback is more about positioning than fundamentals. As one of the best-performing assets in 2022, countertrend pullbacks within a medium-term uptrend are normal. In addition, profit-taking by short-term traders is another reason why assets can diverge from fundamentals. Also, the USD Index’s daily RSI was above 70, and overbought conditions often precede short-term weakness.
Therefore, while the drawdown may seem significant, it’s immaterial when analyzing the fundamentals: the ECB, BOJ, and BoE are well behind the Fed, and the regions’ three currencies combine to account for 83.1% of the USD Index’s movement. As such, the greenback should resume its uptrend over the next few months, and a realization is profoundly bearish for gold, silver, and mining stocks.
Breaking Hearts
With the U.S. 10-Year breakeven inflation rate hitting its lowest level since February 2021 on Sep. 30, the Fed has capsized medium/long-term inflation expectations. Likewise, I warned on Apr. 20 that a reality check would commence. I wrote:
The next leg higher for the U.S. 10-Year real yield may occur for the opposite reasons. For example, I noted above that we don’t need nominal yields to rise for real yields to rise. Moreover, while the U.S. 10-Year Treasury yield was undervalued in 2021 and was poised to move higher, the U.S. 10-Year breakeven inflation rate is overvalued in 2022 and is poised to move lower.
Please see below:
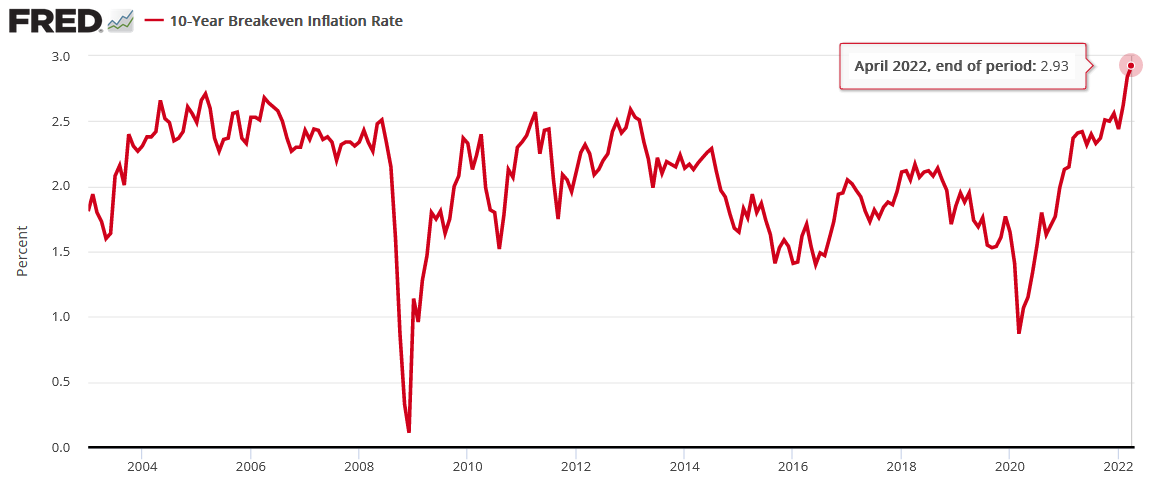
To explain, the U.S. 10-Year breakeven inflation rate ended the Apr. 19 session at 2.93%, only slightly below the all-time high of 2.95% set in March. However, like the PMs, investors’ long-term inflation expectations remain in la-la land.
With the Fed on a hawkish crusade to stifle demand and reduce inflation, the central bank can achieve this goal. The only question is how much economic pain officials are willing to tolerate to get the job done.
Thus, with the U.S. 10-Year breakeven inflation rate sinking to 2.15% on Sep. 30, the Fed’s hawkish message has been heard loud and clear.
Please see below:
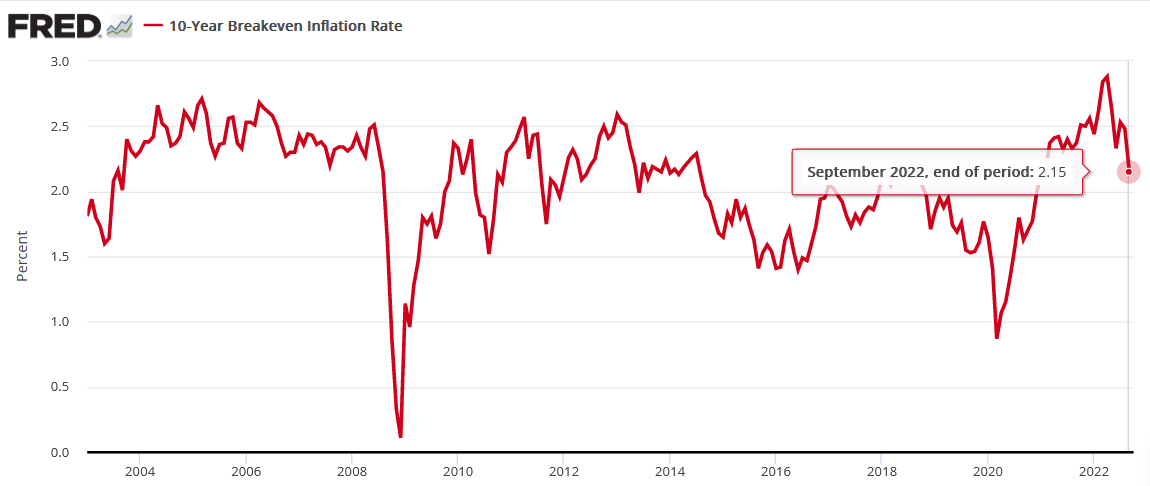
More importantly, while the U.S. 10-Year Treasury yield has declined from its recent high, the U.S. 10-Year breakeven inflation rate’s pullback has been larger. As a result, the U.S. 10-Year real yield hit a new 2022 high of 1.68% on Sep. 30.
Moreover, with the U.S. 10-Year real yield and the USD Index often following in each other’s footsteps, the former’s milestone is bullish for the latter.
In addition, Fed officials continue to amplify their hawkish threats. Fed Vice Chair Lael Brainard said on Sep. 30:
“Inflation is very high in the United States and abroad, and the risk of additional inflationary shocks cannot be ruled out (…). Monetary policy will need to be restrictive for some time to have confidence that inflation is moving back to target. For these reasons, we are committed to avoiding pulling back prematurely.”
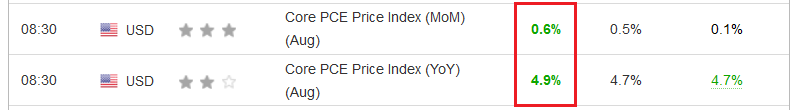
To that point, with the core Personal Consumption Expenditures (PCE) Index – the Fed’s preferred inflation gauge – outperforming expectations on Sep. 30, inflation is nowhere near the levels that support a dovish pivot.
Please see below:
 Source: Investing.com
To explain, the core PCE Index came in at 4.9% year-over-year (YoY), which exceeded economists' consensus estimate of 4.7% YoY. Also, August's print exceeded the 4.7% YoY realized in July. As such, inflation remains highly problematic.
Furthermore, I warned throughout 2021 that inflation would handcuff the Fed and noted how the consensus underestimated the demand side of the equation (and still do). Well, with Americans' personal income meeting expectations while personal spending exceeded expectations, consumers' ability and willingness to spend is why the Fed's inflation fight will be one of attrition.
Please see below:
 Source: Investing.com
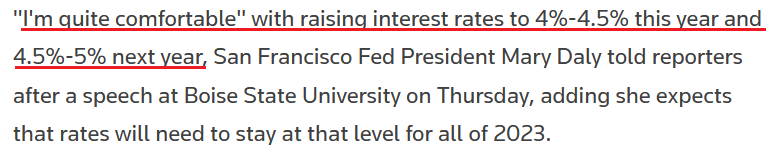
Continuing the theme, San Francisco Fed President Mary Daly said on Sep. 30:
“Our No. 1 priority is to get inflation down. I do believe we will take additional rate hikes, I just think that’s the right thing to do to bring the economy back in balance (…). What I ultimately want to know is how much have financial conditions tightened, what has this done to the global economy, how much of a headwind will that be blowing against U.S. growth, and then how does that factor in to where what we need to do in our policy.”
Therefore, Daly is “quite comfortable” making our 2023 U.S. federal funds rate (FFR) projection of 4.5% to 5.5% a reality.
Please see below:
 Source: Reuters
To that point, I warned on Jul. 25 that a sharp FFR re-rating was on the horizon. I wrote:
With more earnings calls showcasing how the situation continues to worsen, market participants don’t realize that the U.S. federal funds rate needs to hit ~4.5% or more for the Fed to materially reduce inflation. For context, the consensus expects a figure in the 2.5% to 3.5% range.
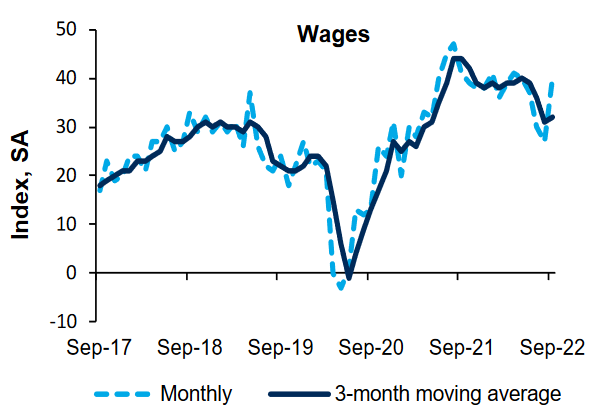
Finally, the Richmond Fed released its Fifth District Survey of Manufacturing Activity on Sep. 27. The headline index increased from -8 in August to 0 in September; and while “the average growth rate of prices paid and prices received both decreased markedly in September,” the report noted that “the wage index also increased dramatically, surpassing its July and August levels.”
Thus, while the price indexes have retreated from their highs, wages are still rising. Moreover, with higher salaries underwriting Americans’ spending ability, it’s another sign that the U.S. labor market has not experienced the demand destruction necessary to alleviate inflation.
 Source: Richmond Fed
The Bottom Line
While gold, silver, and mining stocks have outperformed the S&P 500 in recent days, the USD Index’s immaterial pullback has likely been the culprit. However, with the U.S. 10-Year real yield hitting a new 2022 high, the USD Index shouldn’t be far behind. Likewise, with Fed officials continuing to sound the hawkish alarm, the FFR needs to rise substantially to cool the U.S. labor market and reduce consumption.
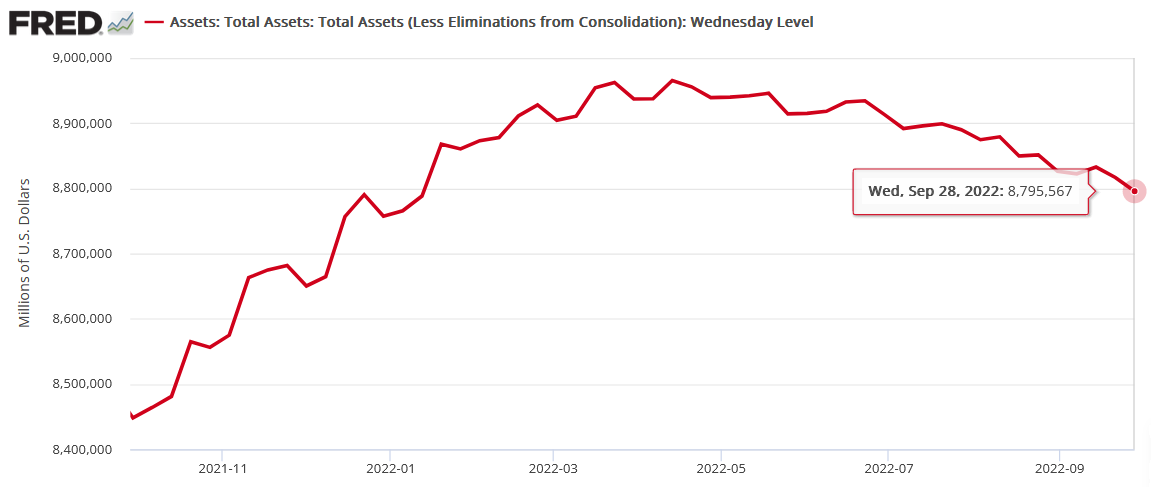
In addition, all of this doesn’t even consider the impact of QT. With the Fed’s balance sheet hitting another 2022 low on Sep. 28, the liquidity drain continues to accelerate. As such, while the PMs have mustered small countertrend rallies, their medium-term drawdowns should have more room to run.
In conclusion, the PMs rallied on Sep. 30, as gold, silver, and mining stocks diverged from the S&P 500; and while we’ve witnessed these rotation rallies before, as traders often jump from one sector/asset class to another looking for somewhere to hide, the gambit has not stopped the GDXJ ETF from hitting new lows. As a result, we expect a similar outcome in the months ahead.
Overview of the Upcoming Part of the Decline
- It seems to me that the corrective upswing is over or about to be over, and that the next big move lower is already underway.
- If we see a situation where miners slide in a meaningful and volatile way while silver doesn’t (it just declines moderately), I plan to – once again – switch from short positions in miners to short positions in silver. At this time, it’s too early to say at what price levels this could take place and if we get this kind of opportunity at all – perhaps with gold prices close to $1,600.
- I plan to switch from the short positions in junior mining stocks or silver (whichever I’ll have at that moment) to long positions in junior mining stocks when gold / mining stocks move to their 2020 lows (approximately). While I’m probably not going to write about it at this stage yet, this is when some investors might consider getting back in with their long-term investing capital (or perhaps 1/3 or 1/2 thereof).
- I plan to return to short positions in junior mining stocks after a rebound – and the rebound could take gold from about $1,450 to about $1,550, and it could take the GDXJ from about $20 to about $24.
- I plan to exit all remaining short positions once gold shows substantial strength relative to the USD Index while the latter is still rallying. This may be the case with gold prices close to $1,400 and GDXJ close to $15 . This moment (when gold performs very strongly against the rallying USD and miners are strong relative to gold after its substantial decline) is likely to be the best entry point for long-term investments, in my view. This can also happen with gold close to $1,400, but at the moment it’s too early to say with certainty.
- The above is based on the information available today, and it might change in the following days/weeks.
You will find my general overview of the outlook for gold on the chart below:
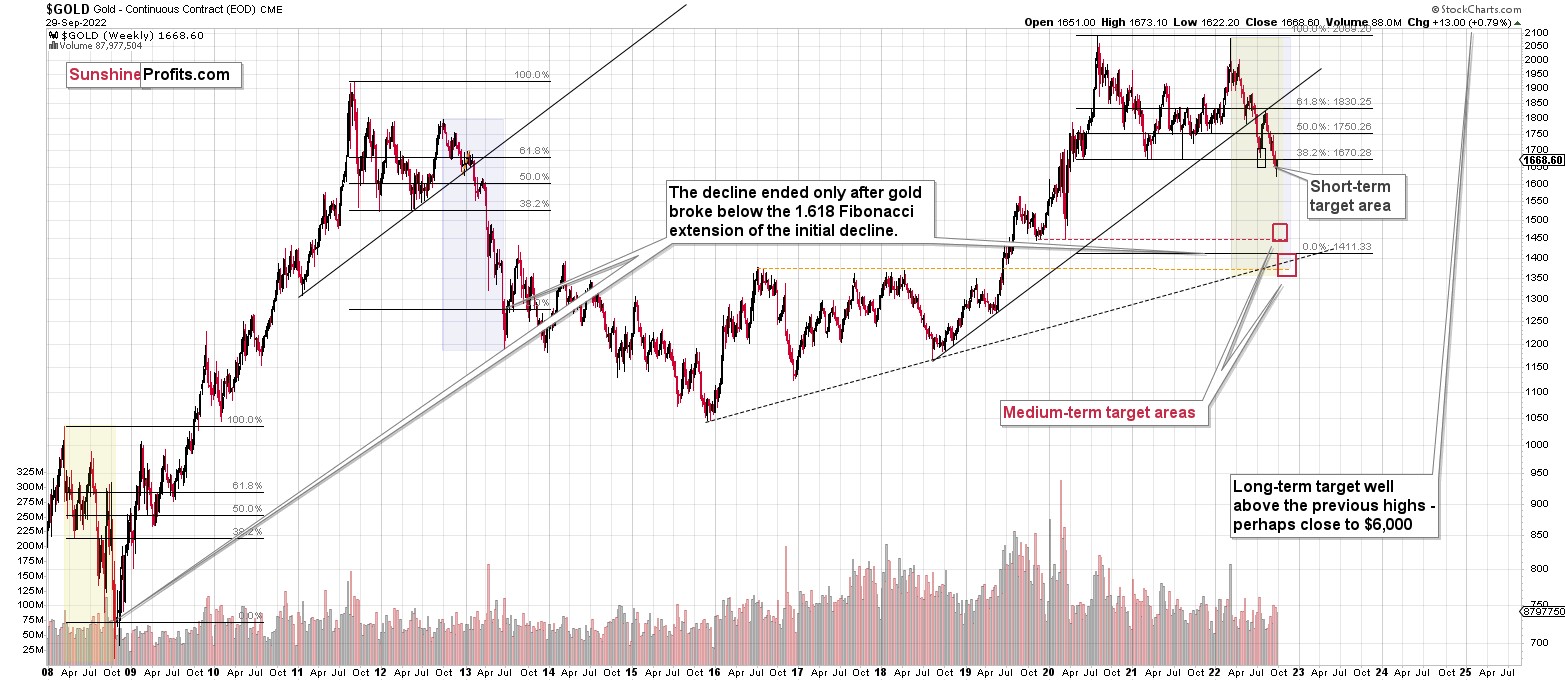
Please note that the above timing details are relatively broad and “for general overview only” – so that you know more or less what I think and how volatile I think the moves are likely to be – on an approximate basis. These time targets are not binding nor clear enough for me to think that they should be used for purchasing options, warrants, or similar instruments.
Summary
Summing up, it seems that the biggest part of the 2013-like decline is taking place right now, and – while I can’t make any promises regarding performance - it seems likely to me that our big profits are about to become huge, and then ridiculously big in the relatively near future.
The current quick upswing most likely doesn’t change anything. Fundamentals and technicals continue to point to lower precious metals values in the coming weeks / months. The current geopolitical news-based rally is likely to serve as nothing more than just a verification of the breakdown below the previous lows in gold.
Things might happen very fast in the coming days, and if I plan to make any adjustments, I’ll keep you informed. Still, if the targets that I’m mentioning in the “Trading” part of the summary are reached, I think that profits should be taken off the table without an additional confirmation from me. I will probably get on the long side of the market at that time, but I’ll send a confirmation if I decide to do so.
After the final sell-off (that takes gold to about $1,350-$1,500), I expect the precious metals to rally significantly. The final part of the decline might take as little as 1-5 weeks, so it's important to stay alert to any changes.
As always, we'll keep you – our subscribers – informed.
To summarize:
Trading capital (supplementary part of the portfolio; our opinion): Full speculative short positions (300% of the full position) in junior mining stocks are justified from the risk to reward point of view with the following binding exit profit-take price levels:
Mining stocks (price levels for the GDXJ ETF): binding profit-take exit price: $20.32; stop-loss: none (the volatility is too big to justify a stop-loss order in case of this particular trade)
Alternatively, if one seeks leverage, we’re providing the binding profit-take levels for the JDST (2x leveraged). The binding profit-take level for the JDST: $29.87; stop-loss for the JDST: none (the volatility is too big to justify a SL order in case of this particular trade).
For-your-information targets (our opinion; we continue to think that mining stocks are the preferred way of taking advantage of the upcoming price move, but if for whatever reason one wants / has to use silver or gold for this trade, we are providing the details anyway.):
Silver futures downside profit-take exit price: $12.32
SLV profit-take exit price: $11.32
ZSL profit-take exit price: $79.87
Gold futures downside profit-take exit price: $1,504
HGD.TO – alternative (Canadian) 2x inverse leveraged gold stocks ETF – the upside profit-take exit price: $19.87
HZD.TO – alternative (Canadian) 2x inverse leveraged silver ETF – the upside profit-take exit price: $49.87
Long-term capital (core part of the portfolio; our opinion): No positions (in other words: cash)
Insurance capital (core part of the portfolio; our opinion): Full position
Whether you’ve already subscribed or not, we encourage you to find out how to make the most of our alerts and read our replies to the most common alert-and-gold-trading-related-questions.
Please note that we describe the situation for the day that the alert is posted in the trading section. In other words, if we are writing about a speculative position, it means that it is up-to-date on the day it was posted. We are also featuring the initial target prices to decide whether keeping a position on a given day is in tune with your approach (some moves are too small for medium-term traders, and some might appear too big for day-traders).
Additionally, you might want to read why our stop-loss orders are usually relatively far from the current price.
Please note that a full position doesn't mean using all of the capital for a given trade. You will find details on our thoughts on gold portfolio structuring in the Key Insights section on our website.
As a reminder - "initial target price" means exactly that - an "initial" one. It's not a price level at which we suggest closing positions. If this becomes the case (as it did in the previous trade), we will refer to these levels as levels of exit orders (exactly as we've done previously). Stop-loss levels, however, are naturally not "initial", but something that, in our opinion, might be entered as an order.
Since it is impossible to synchronize target prices and stop-loss levels for all the ETFs and ETNs with the main markets that we provide these levels for (gold, silver and mining stocks - the GDX ETF), the stop-loss levels and target prices for other ETNs and ETF (among other: UGL, GLL, AGQ, ZSL, NUGT, DUST, JNUG, JDST) are provided as supplementary, and not as "final". This means that if a stop-loss or a target level is reached for any of the "additional instruments" (GLL for instance), but not for the "main instrument" (gold in this case), we will view positions in both gold and GLL as still open and the stop-loss for GLL would have to be moved lower. On the other hand, if gold moves to a stop-loss level but GLL doesn't, then we will view both positions (in gold and GLL) as closed. In other words, since it's not possible to be 100% certain that each related instrument moves to a given level when the underlying instrument does, we can't provide levels that would be binding. The levels that we do provide are our best estimate of the levels that will correspond to the levels in the underlying assets, but it will be the underlying assets that one will need to focus on regarding the signs pointing to closing a given position or keeping it open. We might adjust the levels in the "additional instruments" without adjusting the levels in the "main instruments", which will simply mean that we have improved our estimation of these levels, not that we changed our outlook on the markets. We are already working on a tool that would update these levels daily for the most popular ETFs, ETNs and individual mining stocks.
Our preferred ways to invest in and to trade gold along with the reasoning can be found in the how to buy gold section. Furthermore, our preferred ETFs and ETNs can be found in our Gold & Silver ETF Ranking.
As a reminder, Gold & Silver Trading Alerts are posted before or on each trading day (we usually post them before the opening bell, but we don't promise doing that each day). If there's anything urgent, we will send you an additional small alert before posting the main one.
Thank you.
Przemyslaw Radomski, CFA
Founder, Editor-in-chief

