

Briefly: in our opinion, full (300% of the regular position size) speculative short positions in junior mining stocks are justified from the risk/reward point of view at the moment of publishing this Alert.
I dedicated most of the technical part of yesterday’s analysis to mining stocks, arguing that their breakout above the declining resistance line was unlikely to last, and we didn’t have to wait long for the market to agree with that. The precious metals sector declined yesterday, and junior miners were the ones that plummeted the most. So much for miners’ short-term strength relative to gold.
As a brief reminder, here’s what I wrote yesterday:
The junior mining stocks closed the week above the declining medium-term support line, which might be viewed as something bullish. Let’s take a closer look.
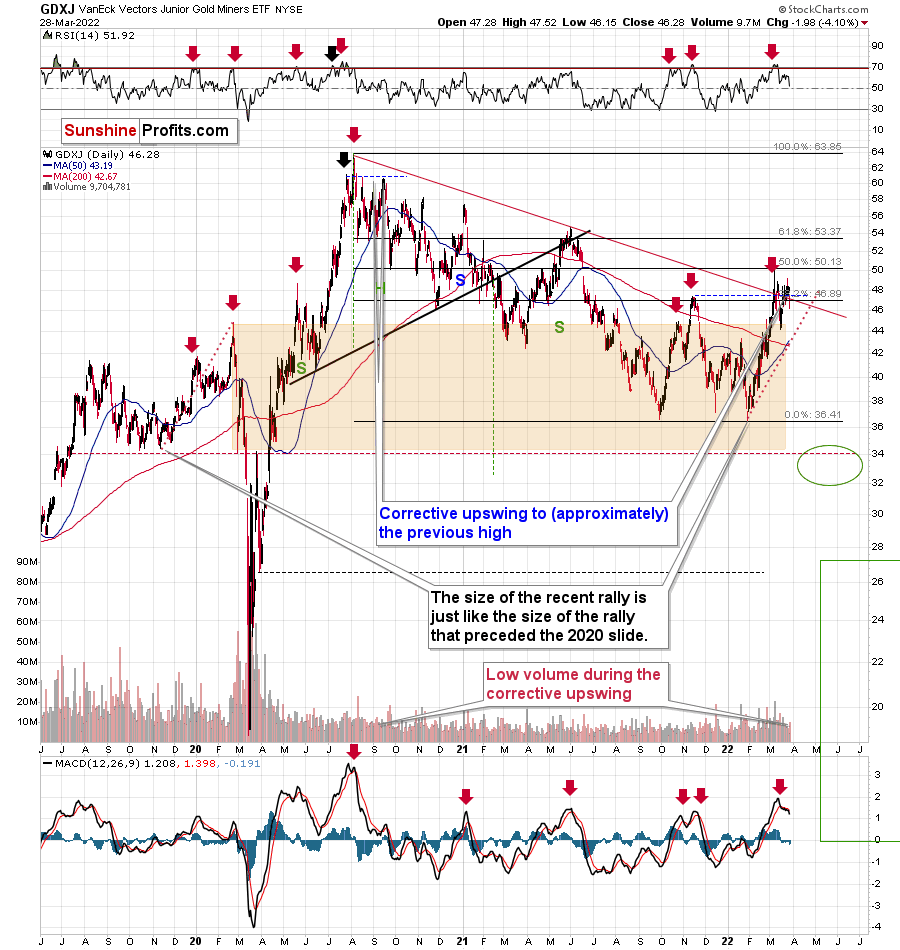
The GDXJ ETF closed the week above the declining red line and below the 38.2% Fibonacci retracement level. However, should one view this as really bullish?
Not really, as long as one remembers that not everything is about the price. The volume is also an important indicator as it shows, among other things, how much the market participants are really convinced that a given move is likely to take place. If the price moved higher on significant volume (but not excessively huge, as that could mean that the rally burnt itself out), it would mean that bulls won after a fierce fight.
Friday’s volume, however, was small. In fact, it was the lowest volume in the GDXJ ETF that we have seen this year. The second-lowest volume was recorded on Jan. 4, which was right before GDXJ’s decline.
So, should the breakout above the declining resistance be trusted? No, at least not yet.
This is especially the case given that the sell signal from the MACD indicator remains intact. These signals were highly effective at detecting major short-term tops. The fact that we just saw one indicates that the outlook for mining stocks is bearish.
The tiny-volume rally was immediately followed by a decline in volume that was not yet huge, but bigger than what we saw during the preceding rally.
Shouldn’t the volume be higher now? Not really. After the first crack in a dam (the breakdown), the water can leak at small or moderate pace at first (a decline in average volume), but we all know what happens next. The water flow gains strength as the dam is destroyed. In the world of technical analysis, this could be viewed as a situation in which prices decline in a much more decisive way, with stronger volume, and more sharply so. Just like the dam is not going to stop the water, the previous support will no longer prevent declines, once the breakdown is confirmed.
The breakdown of junior miners hasn’t been confirmed yet. However, given the fact that it materialized while gold didn’t decline as much, and that it reversed before the end of the session (thus miners are weak relative to gold again), it seems that the breakdown will be confirmed shortly.
While the above analogy describes the move below the declining red resistance line visible on the previous chart, the below 4-hour chart features a breakdown below the rising short-term support line, and it also applies to it.
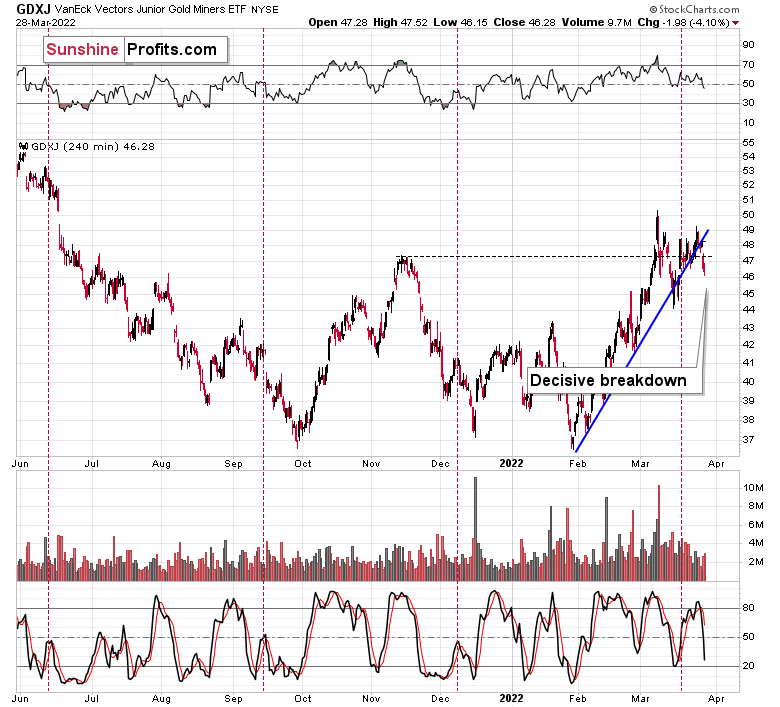
Yes, we did see this kind of breakdown in mid-March, and GDXJ rallied shortly thereafter. However, now the move is more decisive.
Back then, the closing price was very close to the support line, and now it’s clearly below that. Therefore, the breakdown is much more visible and, thus, reliable. Again, it’s not confirmed, but it’s likely to be so shortly.
Also, let’s check the scope of the miner’s underperformance. While the GDXJ was down by over 4% yesterday, gold…
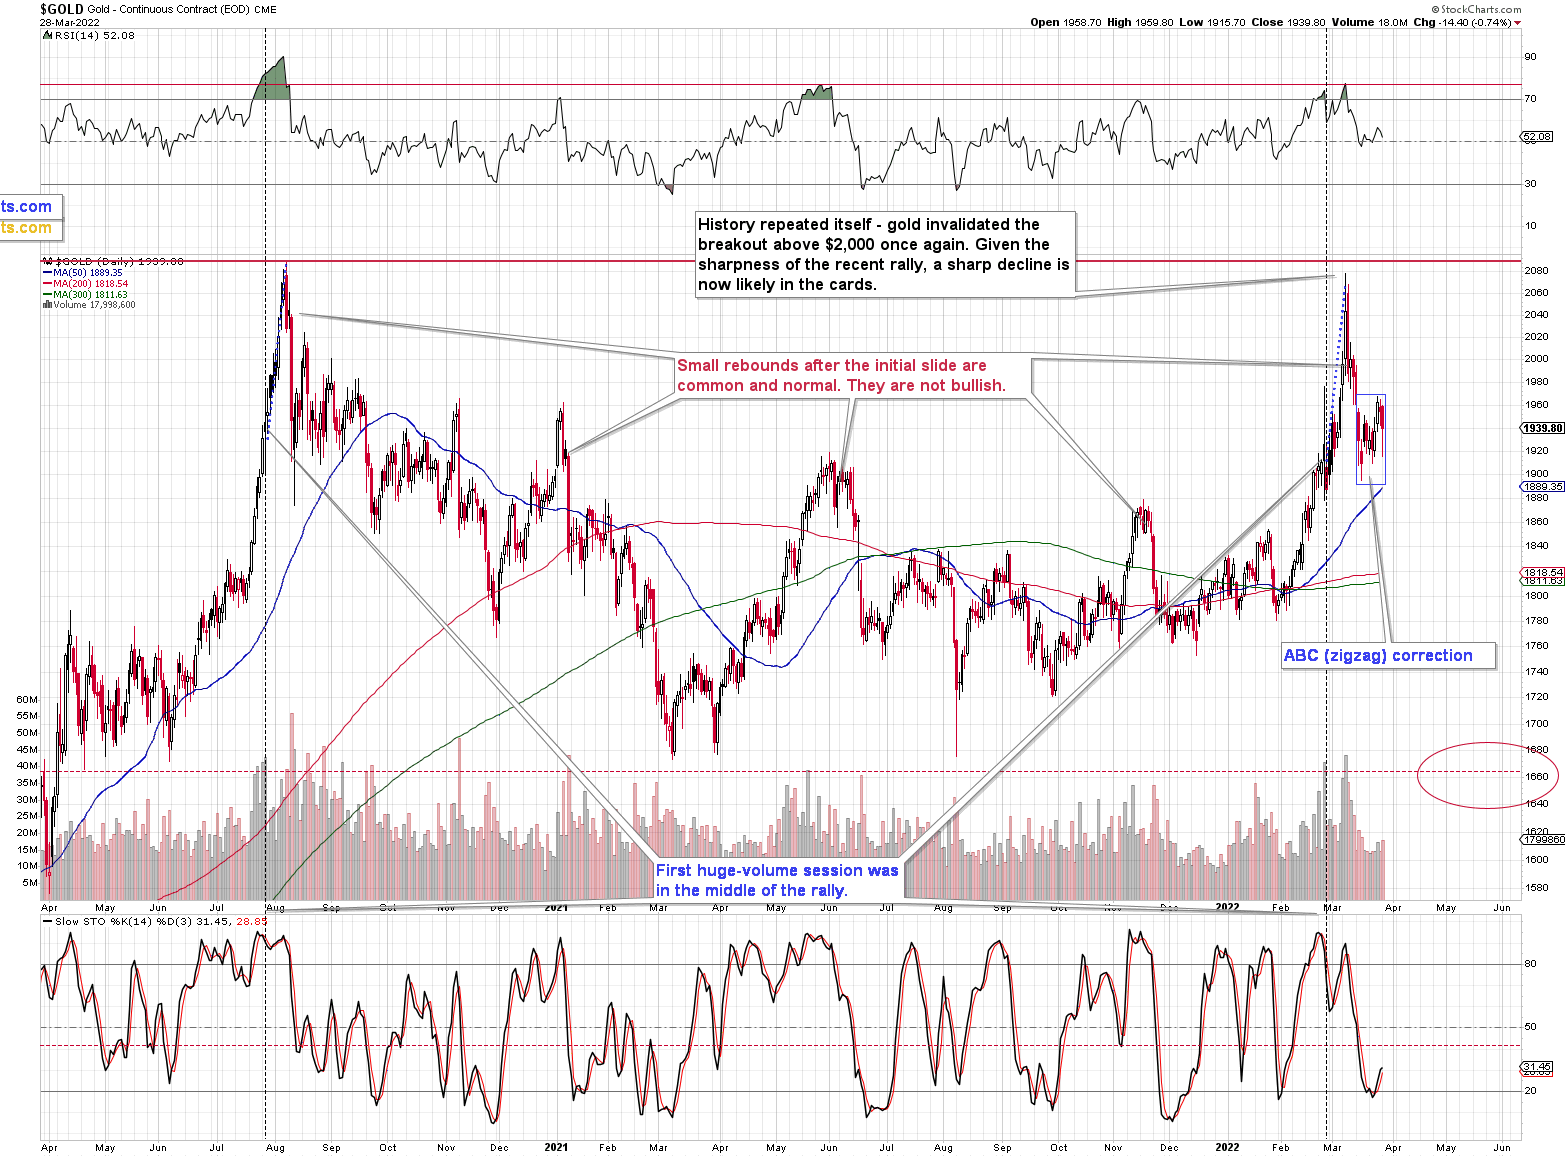
Gold was down by less than 1%. Miners are clearly underperforming the yellow metal here, which is common for the initial days of declines after short- and medium-term tops.
One might say that perhaps the decline in the junior miners was caused by a decline in the general stock market, but…
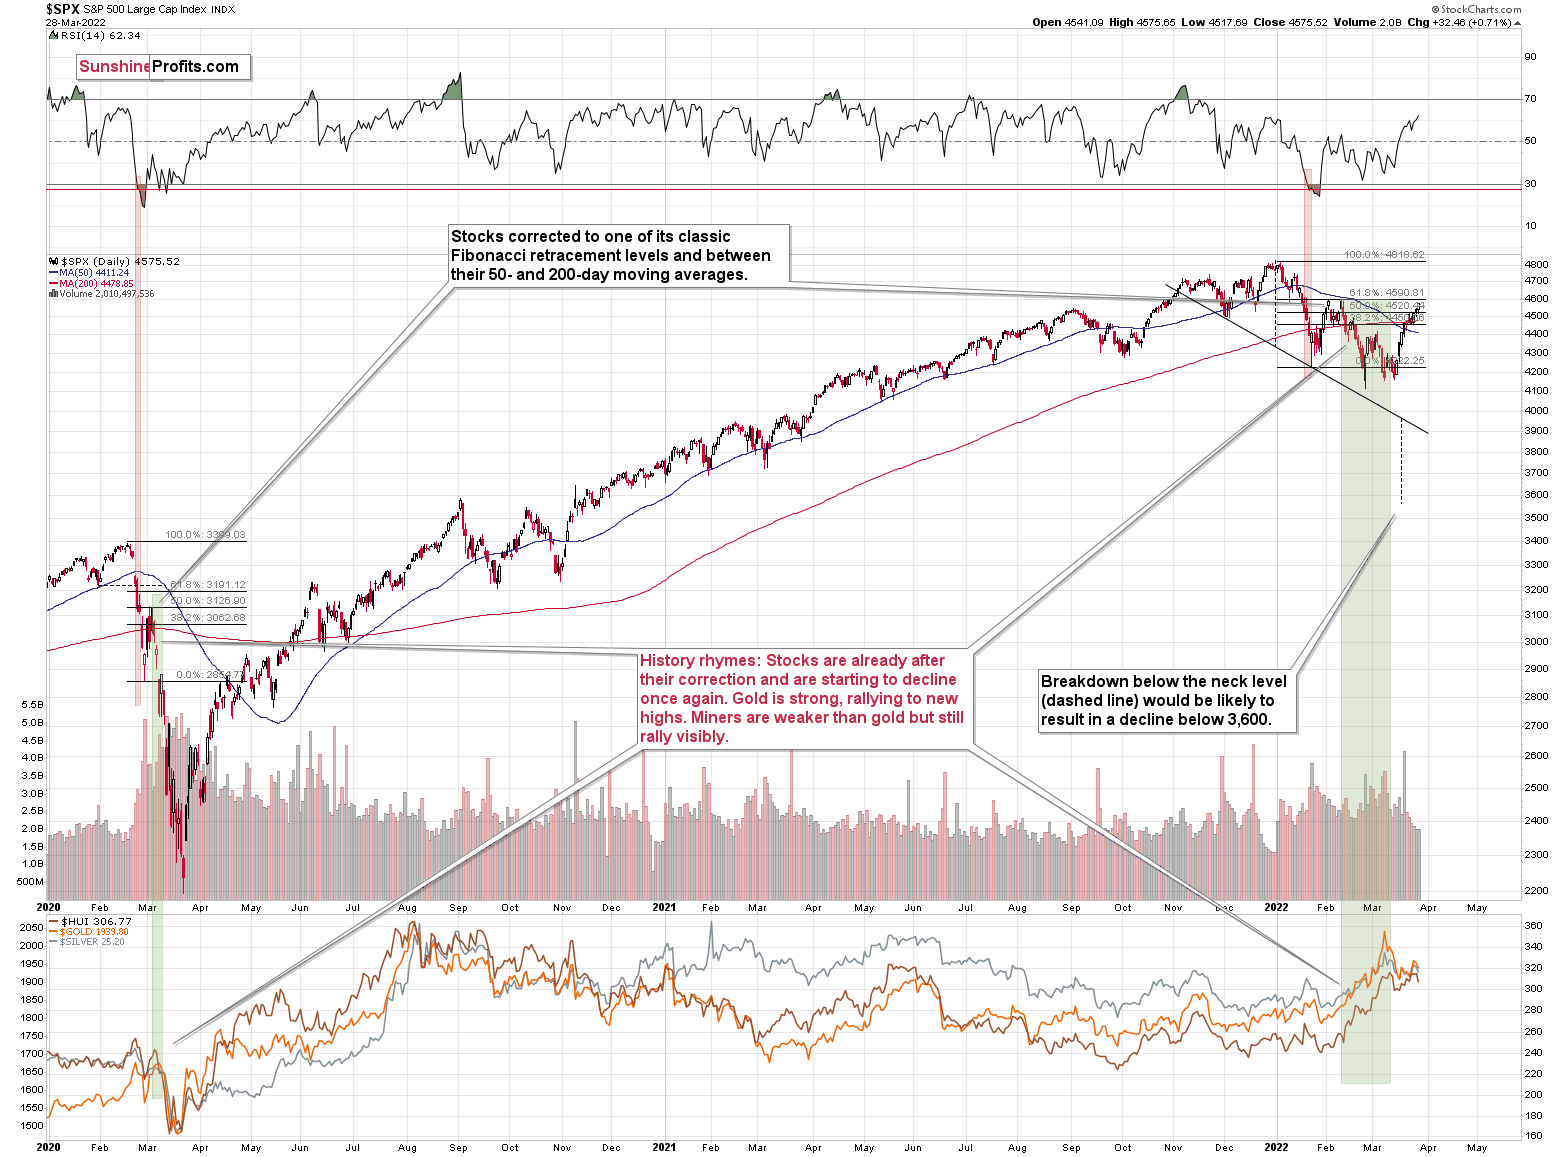
The general stock market didn’t decline yesterday. So, it wasn’t it. The most likely explanation of what we just saw is that miners are simply indicating that it’s about time to start the next (probably big) move lower.
Besides, the market had it coming, given the analogy to what happened in late-2012. I previously described it in the following way:

Gold stocks (GDX, GDXJ, and HUI Index) have recently been quite strong relative to gold. OK, but is this necessarily bullish? It could be, until one considers the fact that we saw the same thing at the 2012 top! This changes everything, and it does so, because the links between now and that top are almost everywhere: in gold, in silver, in gold stocks, and even in their ratios.
It is the gold stocks to gold ratio that I would like to start with today. That’s the flagship proxy for the relationship between these two markets.
As it turns out, the gold stocks to gold ratio is behaving almost identically as at the 2012 top in the precious metals sector.
In both cases, the ratio moved below the rising medium-term support line, then formed a double-bottom below the line, and invalidated the breakdown, which resulted in a counter-trend rally. The rally ended shortly after the ratio moved above its 200-day moving average (marked in red). That’s what happened recently. What happened next in 2012? The decline not only continued – it accelerated!
Consequently, the recent action in the ratio is not really bullish. In other words, the fact that gold stocks were recently (in the short run only) strong relative to gold doesn’t make the medium-term outlook for the precious metals sector bullish. However, it remains bearish.
Interestingly, the ratio itself moved to its declining resistance line, indicating that the corrective upswing might already be over or almost over. We get the same indication from the RSI indicator. It’s not above 70, but in the case of most local tops, the RSI didn’t have to move above 70. It just moved to more or less the same levels – I marked it with a horizontal blue line.
While yesterday’s weakness in miners didn’t trigger a huge decline in the HUI to gold ratio yet, the emphasis here is on “yet.” This means that more weakness is likely to follow. That’s very bearish for the mining stocks, especially junior miners that are likely to be affected to the greatest degree when the general stock market declines. The latter is likely too, in my view.
Not much changed in the USD Index yesterday, but that means that its bullish implications remain intact along with the bearish consequences for the precious metals sector, and so do my yesterday’s comments:
Let’s keep in mind that, based on the clearly confirmed breakout in the USD Index and a visible breather in it, the U.S. currency is likely to rally in the following days / weeks. This means that the precious metals sector is likely to get a bearish push shortly.
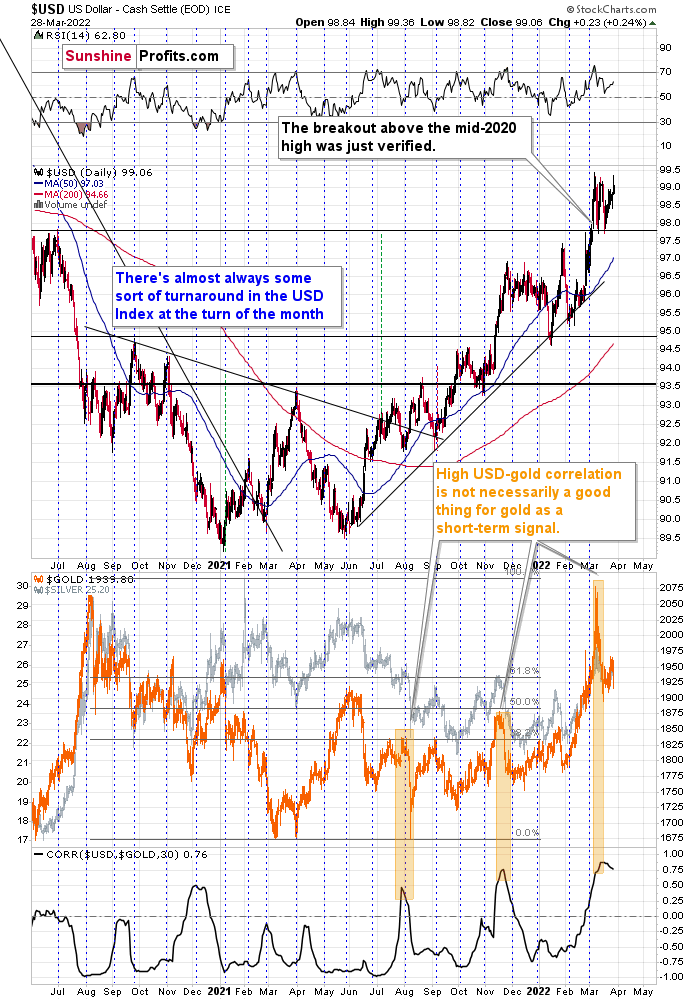
As the war-based premiums in gold and the USD appear to be waning, a high-interest-rate-driven rally in the USD is likely to trigger declines in gold. The correlation between these two assets has started to decline. When that happened during the last two cases (marked with orange), gold plummeted profoundly shortly thereafter.
All in all, technicals favor a decline in the precious metals sector sooner rather than later.
Having said that, let’s take a look at the markets from a more fundamental point of view.
Flying Blind
While the PMs suffered mightily on Mar. 28, the daily drawdowns are likely only the tip of the iceberg. To explain, the bond market has been roaring in recent days, as the Fed’s inflation predicament has investors on edge. However, while bond traders hold their breath as the drama unfolds, stock market investors remain cheerful.
Please see below:
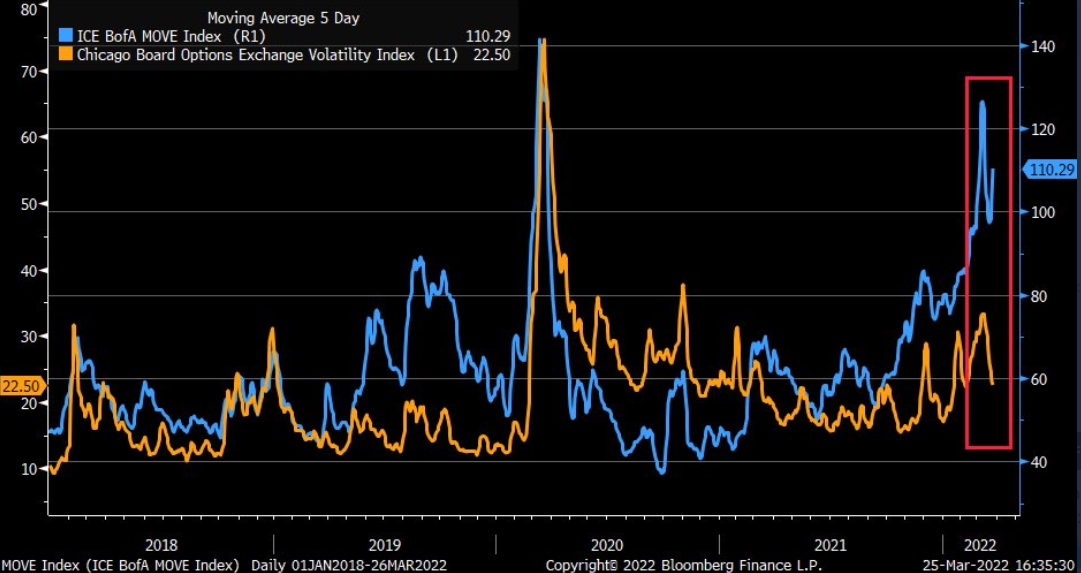
To explain, the orange line above tracks the Cboe Volatility Index (stock market volatility), while the blue line above tracks the MOVE Index (bond market volatility). If you analyze the relationship, you can see that stress in the credit market often reverberates across the equity market.
However, if you focus your attention on the right side of the chart, you can see that the pair has diverged in recent days. Thus, while inflation and the Fed’s hawkish disposition have rattled bond investors, stock bulls are behaving as if none of it matters. However, with the GDXJ ETF often suffering during periods of heightened volatility, more uncertainty should weigh on the junior miners over the medium term.
Why should we expect the anxiety to continue?
Well, it’s all about the Fed. With inflation too high for comfort, Fed officials have repeatedly warned that rate hikes are forthcoming. Moreover, the stickier the pricing pressures become, the more rate hikes will be needed to return inflation to normalized levels. With the data signaling more pain ahead, the PMs and the general stock market are on a medium-term path to ruin.
To explain, the Dallas Fed released its Texas Manufacturing Outlook Survey on Mar. 28. While the headline index declined from 14 in February to 8 in March, the details were bullish for Fed policy and bearish for the PMs.
For example, the report revealed:
“Labor market measures indicated robust employment growth and longer workweeks. The employment index pushed up seven points to a highly elevated reading of 25.5. Thirty-two percent of firms noted net hiring, while 7 percent noted net layoffs. The hours worked index edged down to 15.4.”
In addition:
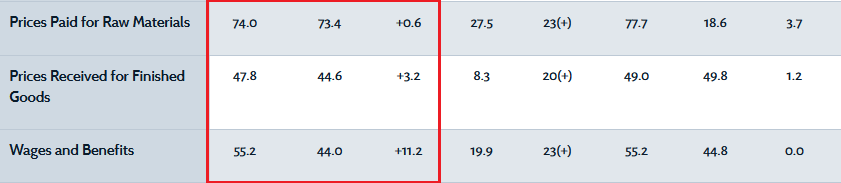
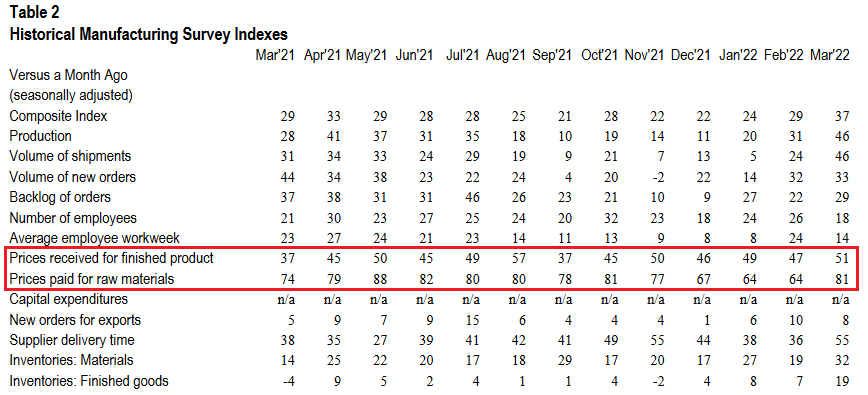
“Prices and wages continued to increase strongly in March, with the indexes at or near historical highs. The raw materials prices index was largely unchanged at 74.0, and the finished goods prices index inched up to 47.8. The wages and benefits index shot up 11 points to a new high of 55.2.”
Please see below:
 Source: Dallas Fed
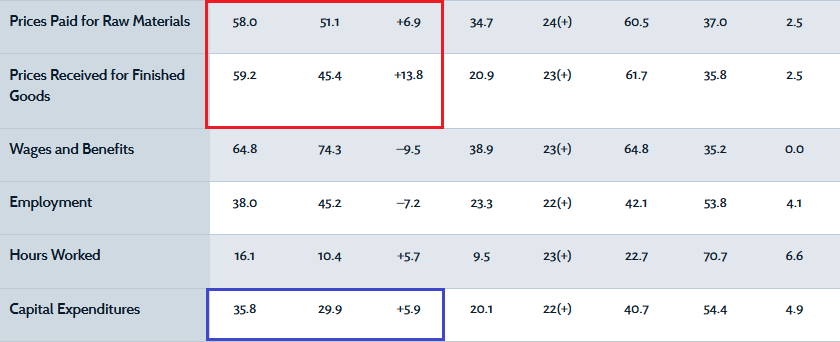
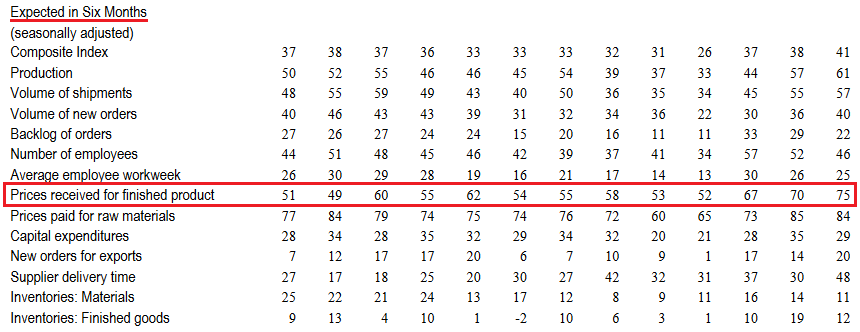
On top of that, the Dallas Fed’s index of manufacturers’ six-month expectations for prices received surged by 13.8 points month-over-month (MoM) to an all-time high of 59.2. Likewise, six-month expectations for prices paid also increased MoM.
Please see below:
 Source: Dallas Fed
Furthermore, if you analyze the blue box above, you can see that the Dallas Fed's capital expenditures index increased from 29.9 in February to 35.8 in March. For context, this was the highest reading since March 2019 and is a proxy for manufacturers' expectations of future economic growth. For example, cap-ex consists of long-term investments like land, buildings, and machinery. As a result, if manufacturers expected a recession, they wouldn't plow money into long-lived assets that generate returns over several years.
For your reference, the all-time high expectations for future output prices also align with the Kansas City Fed's data. To explain, I wrote on Mar. 25:
The KC Fed’s prices paid index increased from 64 in February to 81 in March, while its prices received index increased from 47 to 51. As a result, inflation trends are not moving in the Fed’s desired direction.
Please see below:
 Source: KC Fed
On top of that, not only did current inflationary pressures increase month-over-month (MoM) in March, but the KC Fed’s index of manufacturers’ six-month expectations for prices received increased to an all-time high of 75.
Please see below:
 Source: KC Fed
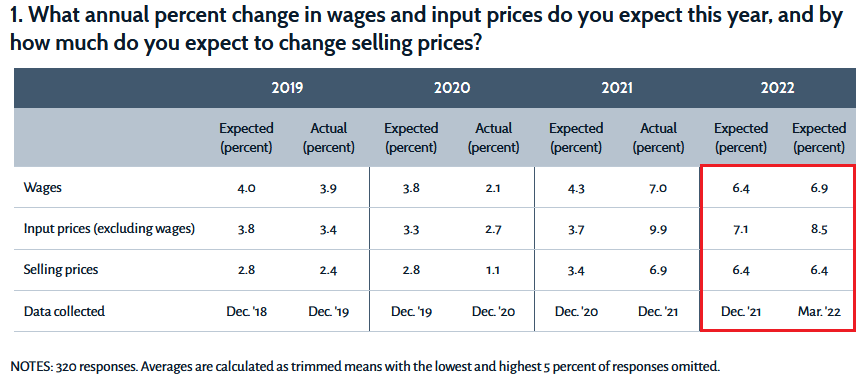
Even more revealing, the Dallas Fed released a series of “special questions” that covered wages, prices, and the impact of the Russia-Ukraine conflict. When asked about the pricing pressures, manufacturers in Texas increased their full-year 2022 expectations for input and wage inflation and maintained their expectations for output inflation.
Please see below:
 Source: Dallas Fed
Furthermore, I’ve been warning for months that the U.S. economy remains in a healthy position. Due to that, the implications are bullish for Fed policy and bearish for the PMs. Moreover, with manufacturers in Texas supporting the thesis, the results imply that the Fed’s rate hike cycle has plenty of room to run.
Please see below:
 Source: Dallas Fed
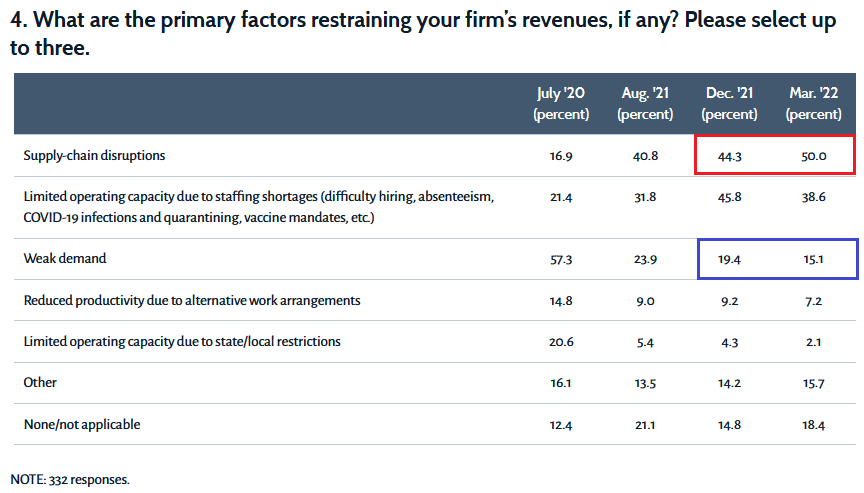
To explain, when asked about the issues confronting their businesses, respondents provided the above answers. If you analyze the blue box above, you can see that responses mentioning “weak demand” declined from 19.4% in December to 15.1% in March. As a result, consumer demand is in a healthier position now than it was near the end of 2021.
Conversely, if you analyze the red box above, notice how responses mentioning “supply-chain disruptions” increased from 44.3% in December to 50.0% in March. Thus, while demand remains robust, the supply chain in Texas has gotten worse. As such, the divergence is extremely inflationary.
Also noteworthy, concerns over COVID-19 restrictions and productivity constraints due to “alternative work arrangements” also declined from December to March. Moreover, with many U.S. states rolling back their coronavirus curbs and the summer weather poised to increase consumer mobility, demand and inflation should remain elevated for several months.
To that point, with the bond market privy to these developments and the stock and commodities markets still in la-la land (though the PMs and WTI were hit relatively hard on Mar. 28), financial stress should test investors’ mettle over the medium term.
Please see below:
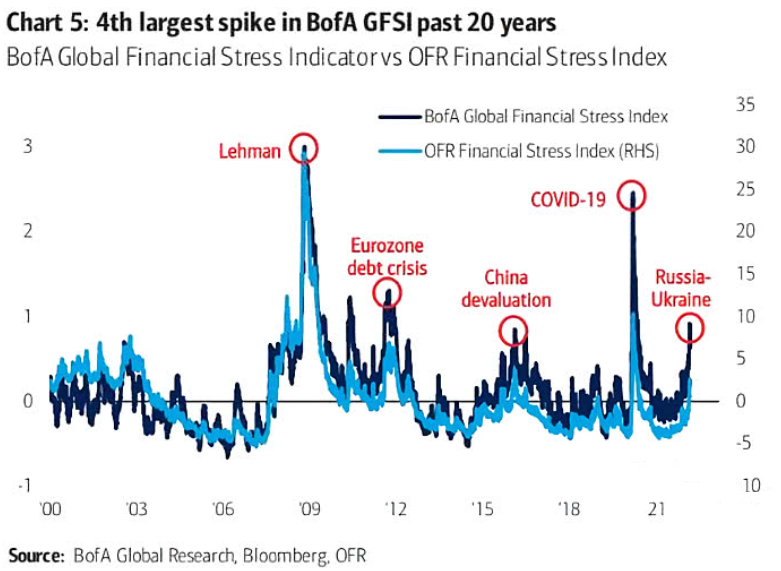
To explain, the light blue line above tracks the OFR Financial Stress Index, while the dark blue line above tracks the Bank of America's Financial Stress Index. In a nutshell: the data measures the financial market strain imposed by variables such as interest rates, credit spreads, and volatility.
If you analyze the right side of the chart, you can see that Bank of America's metric has moved materially higher recently. Moreover, with prior spikes culminating in volatile events, investors' lack of fear could have ominous implications over the next few months.
Furthermore, it's important to remember that the Fed has only completed one rate hike. And with the data from the Dallas Fed following the trends of other business surveys, the Fed will need to fire plenty of hawkish bullets to kill inflation. As a result, the implications should result in even more financial stress over the medium term.
Finally, I noted recently that commodities have become the new FAANG. With momentum investors piling into positions as they did with the ARK Innovation ETF in 2020, the PMs have benefited. However, since higher commodity prices are mutually exclusive to the Fed's inflation goals, something should crack over the medium term.
Please see below:
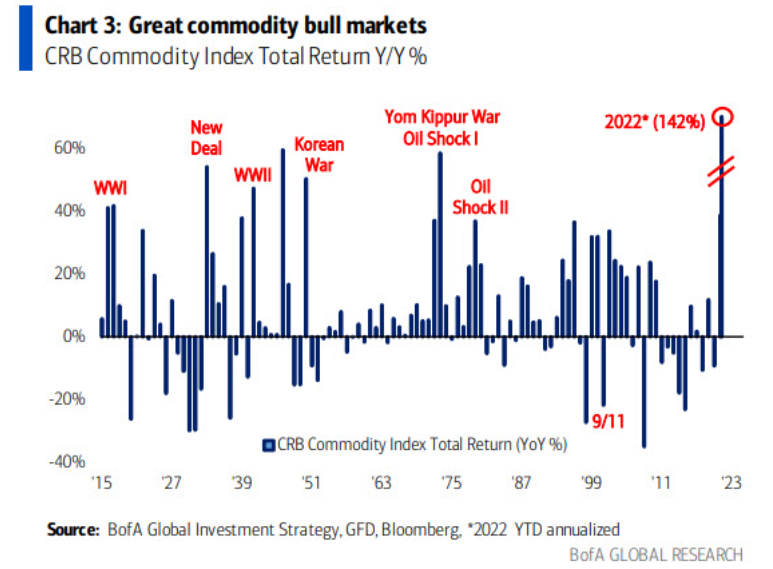
To explain, the blue bars above track the year-over-year (YoY) percentage change in the CRB Commodity Index. If you analyze the right side of the chart, you can see that the index is more loved now than ever. For context, the data was compiled before the sell-off on Mar. 28.
However, with sentiment extremely stretched and the index (including the PMs) fighting the Fed, a sharp reversion could materialize if investors worry about the economic implications of forthcoming rate hikes.
The bottom line? While the PMs cooled off on Mar. 28, they still remain disconnected from fundamental reality. With the Fed hawked up and inflation still accelerating MoM, officials are a long way from 2%. Moreover, while investors seem to think that the Fed can hike interest rates seven times or more without any economic or financial market impact, the prospect is unrealistic. As a result, if inflation, employment, and growth remain elevated, the Fed’s fury could increase during the summer months.
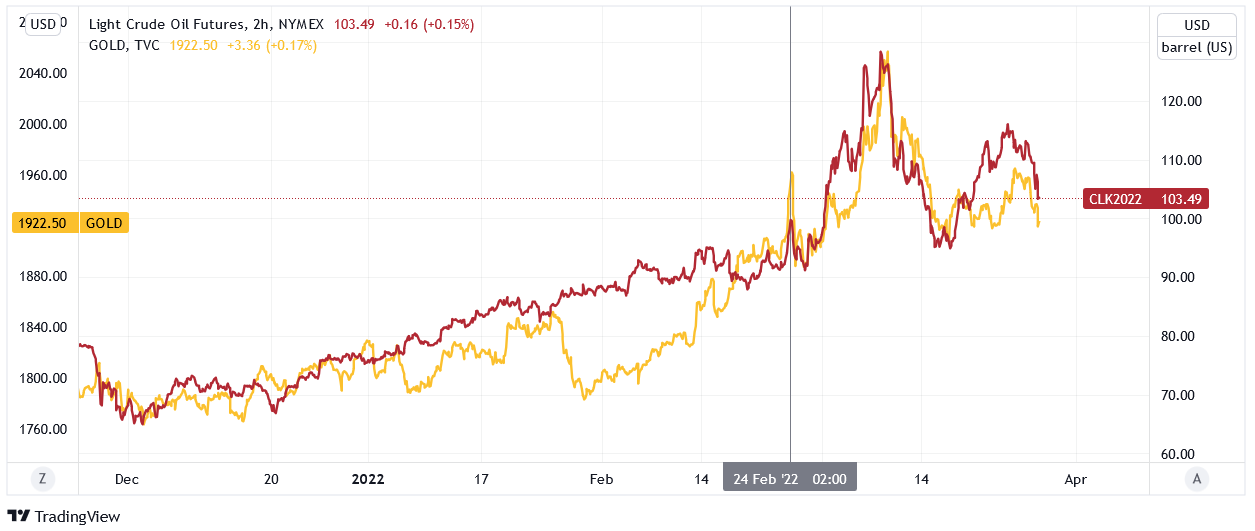
In conclusion, the PMs declined on Mar. 28, as they continue to follow crude’s lead. Moreover, the correlation demonstrates that the recent rally has been all about momentum, not technicals or fundamentals. For context, the two-hour chart below highlights how it’s been all one trade since Russia invaded Ukraine. However, once technical and fundamental reality re-emerge, the PMs should suffer sharp drawdowns.
Overview of the Upcoming Part of the Decline
- It seems to me that the corrective upswing is now over or very close to being over , and that gold, silver, and mining stocks are now likely to continue their medium-term decline.
- It seems that the first (bigger) stop for gold will be close to its previous 2021 lows, slightly below $1,800 . Then it will likely correct a bit, but it’s unclear if I want to exit or reverse the current short position based on that – it depends on the number and the nature of the bullish indications that we get at that time.
- After the above-mentioned correction, we’re likely to see a powerful slide, perhaps close to the 2020 low ($1,450 - $1,500).
- If we see a situation where miners slide in a meaningful and volatile way while silver doesn’t (it just declines moderately), I plan to – once again – switch from short positions in miners to short positions in silver. At this time, it’s too early to say at what price levels this could take place, and if we get this kind of opportunity at all – perhaps with gold close to $1,600.
- I plan to exit all remaining short positions once gold shows substantial strength relative to the USD Index while the latter is still rallying. This may be the case with gold close to $1,350 - $1,400. I expect silver to fall the hardest in the final part of the move. This moment (when gold performs very strongly against the rallying USD and miners are strong relative to gold after its substantial decline) is likely to be the best entry point for long-term investments, in my view. This can also happen with gold close to $1,375, but at the moment it’s too early to say with certainty.
- As a confirmation for the above, I will use the (upcoming or perhaps we have already seen it?) top in the general stock market as the starting point for the three-month countdown. The reason is that after the 1929 top, gold miners declined for about three months after the general stock market started to slide. We also saw some confirmations of this theory based on the analogy to 2008. All in all, the precious metals sector is likely to bottom about three months after the general stock market tops.
- The above is based on the information available today, and it might change in the following days/weeks.
You will find my general overview of the outlook for gold on the chart below:
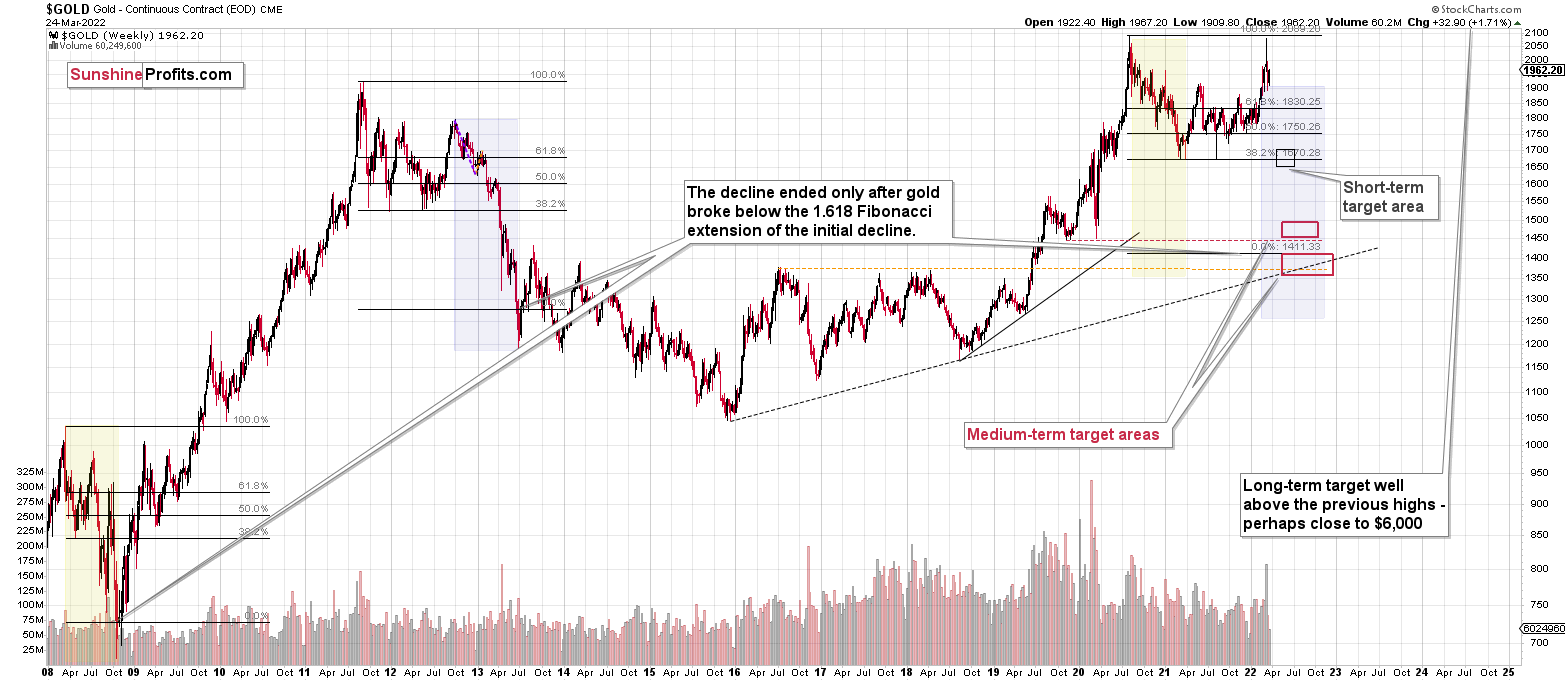
Please note that the above timing details are relatively broad and “for general overview only” – so that you know more or less what I think and how volatile I think the moves are likely to be – on an approximate basis. These time targets are not binding or clear enough for me to think that they should be used for purchasing options, warrants or similar instruments.
Summary
Summing up, despite the recent rally in gold, the outlook for junior mining stocks remains exactly as I described previously.
Crude oil’s extreme outperformance, the stock market’s weakness, and critical medium-term resistance levels reached by gold (all-time high!) and junior mining stocks, all indicate that the tops are at hand or have just formed. The huge-volume reversals in gold and (especially) mining stocks, along with silver’s short-term outperformance, all point to lower precious metals prices in the following days/weeks. It seems that the top is in.
Investing and trading are difficult. If it was easy, most people would be making money – and they’re not. Right now, it’s most difficult to ignore the urge to “run for cover” if you physically don’t have to. The markets move on “buy the rumor and sell the fact.” This repeats over and over again in many (all?) markets, and we have direct analogies to similar situations in gold itself. Junior miners are likely to decline the most, also based on the massive declines that are likely to take place (in fact, they have already started) in the stock markets.
From the medium-term point of view, the two key long-term factors remain the analogy to 2013 in gold and the broad head and shoulders pattern in the HUI Index. They both suggest much lower prices ahead.
It seems that our profits from short positions are going to become truly epic in the coming months.
After the sell-off (that takes gold to about $1,350-$1,500), I expect the precious metals to rally significantly. The final part of the decline might take as little as 1-5 weeks, so it's important to stay alert to any changes.
Most importantly, please stay healthy and safe. We made a lot of money last March and this March, and it seems that we’re about to make much more in the upcoming decline, but you have to be healthy to enjoy the results.
As always, we'll keep you - our subscribers - informed.
To summarize:
Trading capital (supplementary part of the portfolio; our opinion): Full speculative short positions (300% of the full position) in junior mining stocks are justified from the risk to reward point of view with the following binding exit profit-take price levels:
Mining stocks (price levels for the GDXJ ETF): binding profit-take exit price: $34.63; stop-loss: none (the volatility is too big to justify a stop-loss order in case of this particular trade)
Alternatively, if one seeks leverage, we’re providing the binding profit-take levels for the JDST (2x leveraged) and GDXD (3x leveraged – which is not suggested for most traders/investors due to the significant leverage). The binding profit-take level for the JDST: $14.98; stop-loss for the JDST: none (the volatility is too big to justify a SL order in case of this particular trade); binding profit-take level for the GDXD: $25.48; stop-loss for the GDXD: none (the volatility is too big to justify a SL order in case of this particular trade).
For-your-information targets (our opinion; we continue to think that mining stocks are the preferred way of taking advantage of the upcoming price move, but if for whatever reason one wants / has to use silver or gold for this trade, we are providing the details anyway.):
Silver futures downside profit-take exit price: $19.12
SLV profit-take exit price: $17.72
ZSL profit-take exit price: $38.28
Gold futures downside profit-take exit price: $1,683
HGD.TO – alternative (Canadian) inverse 2x leveraged gold stocks ETF – the upside profit-take exit price: $11.79
HZD.TO – alternative (Canadian) inverse 2x leveraged silver ETF – the upside profit-take exit price: $29.48
Long-term capital (core part of the portfolio; our opinion): No positions (in other words: cash
Insurance capital (core part of the portfolio; our opinion): Full position
Whether you already subscribed or not, we encourage you to find out how to make the most of our alerts and read our replies to the most common alert-and-gold-trading-related-questions.
Please note that we describe the situation for the day that the alert is posted in the trading section. In other words, if we are writing about a speculative position, it means that it is up-to-date on the day it was posted. We are also featuring the initial target prices to decide whether keeping a position on a given day is in tune with your approach (some moves are too small for medium-term traders, and some might appear too big for day-traders).
Additionally, you might want to read why our stop-loss orders are usually relatively far from the current price.
Please note that a full position doesn't mean using all of the capital for a given trade. You will find details on our thoughts on gold portfolio structuring in the Key Insights section on our website.
As a reminder - "initial target price" means exactly that - an "initial" one. It's not a price level at which we suggest closing positions. If this becomes the case (like it did in the previous trade), we will refer to these levels as levels of exit orders (exactly as we've done previously). Stop-loss levels, however, are naturally not "initial", but something that, in our opinion, might be entered as an order.
Since it is impossible to synchronize target prices and stop-loss levels for all the ETFs and ETNs with the main markets that we provide these levels for (gold, silver and mining stocks - the GDX ETF), the stop-loss levels and target prices for other ETNs and ETF (among other: UGL, GLL, AGQ, ZSL, NUGT, DUST, JNUG, JDST) are provided as supplementary, and not as "final". This means that if a stop-loss or a target level is reached for any of the "additional instruments" (GLL for instance), but not for the "main instrument" (gold in this case), we will view positions in both gold and GLL as still open and the stop-loss for GLL would have to be moved lower. On the other hand, if gold moves to a stop-loss level but GLL doesn't, then we will view both positions (in gold and GLL) as closed. In other words, since it's not possible to be 100% certain that each related instrument moves to a given level when the underlying instrument does, we can't provide levels that would be binding. The levels that we do provide are our best estimate of the levels that will correspond to the levels in the underlying assets, but it will be the underlying assets that one will need to focus on regarding the signs pointing to closing a given position or keeping it open. We might adjust the levels in the "additional instruments" without adjusting the levels in the "main instruments", which will simply mean that we have improved our estimation of these levels, not that we changed our outlook on the markets. We are already working on a tool that would update these levels daily for the most popular ETFs, ETNs and individual mining stocks.
Our preferred ways to invest in and to trade gold along with the reasoning can be found in the how to buy gold section. Furthermore, our preferred ETFs and ETNs can be found in our Gold & Silver ETF Ranking.
As a reminder, Gold & Silver Trading Alerts are posted before or on each trading day (we usually post them before the opening bell, but we don't promise doing that each day). If there's anything urgent, we will send you an additional small alert before posting the main one.
Thank you.
Przemyslaw Radomski, CFA
Founder, Editor-in-chief

