

Briefly: in our opinion, full (300% of the regular position size) speculative short positions in junior mining stocks are justified from the risk/reward point of view at the moment of publishing this Alert.
After we posted last week’s gold price forecast, gold, silver, and mining stocks declined in tune with the analysis. Is the rally over?
Let’s start by taking a closer look at gold.
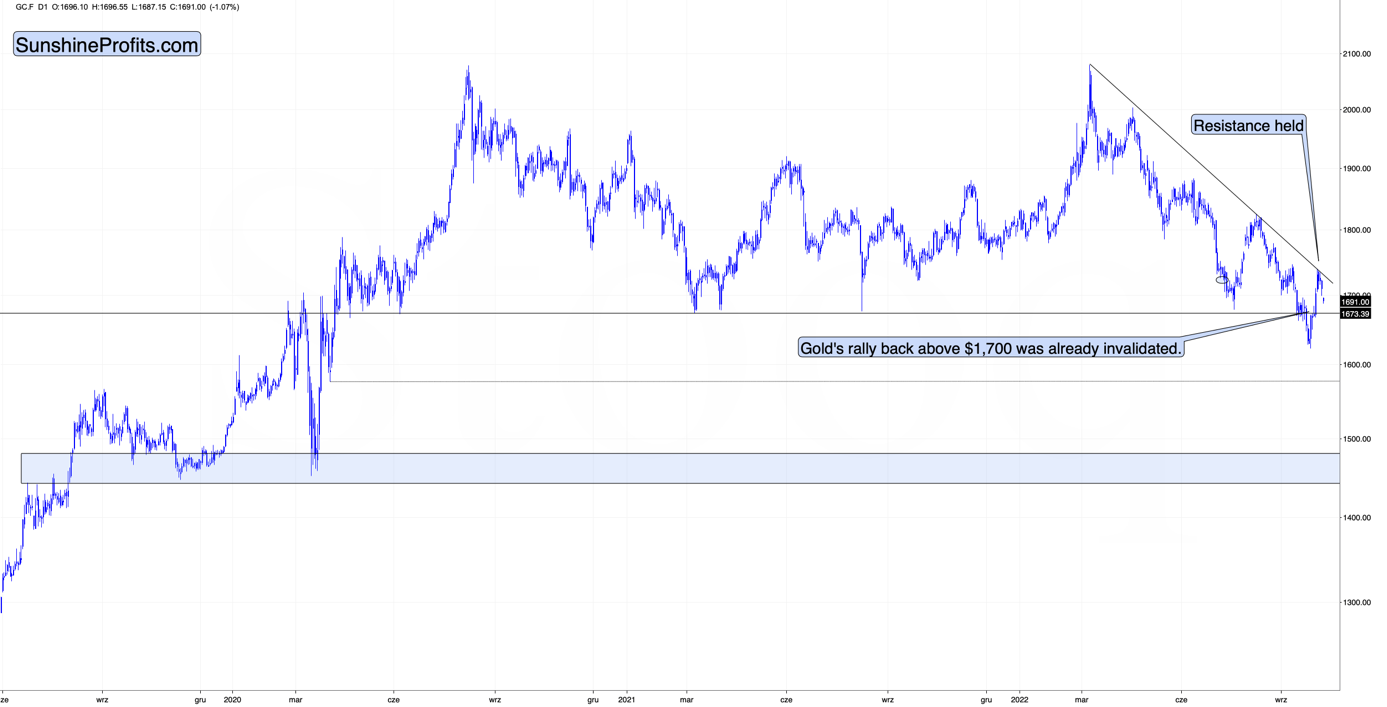
Gold declined after touching its declining, medium-term resistance line, and at the moment of writing these words it’s trading at about $1,690 – visibly below the important $1,700 level.
This means that the attempt to break above this level failed.
It’s bearish on its own, but it’s much more so when you compare the current situation to what happened in April 2013 at the analogous moment.
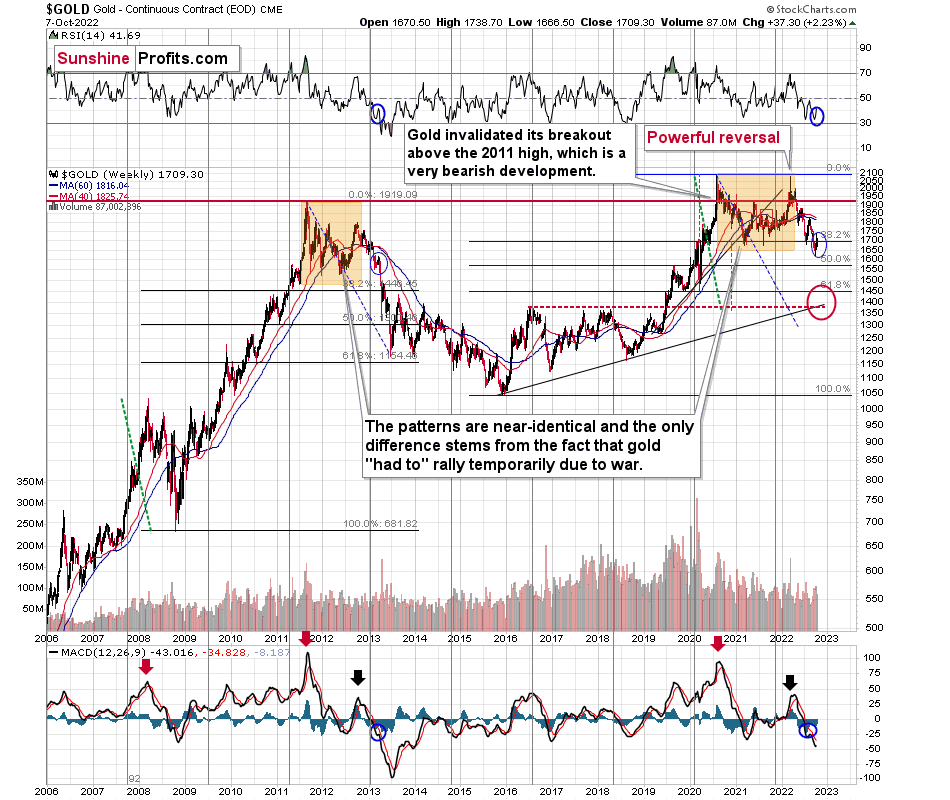
I’ve been writing about this important analogy for months, but if you haven’t read my previous analyses, please focus on the orange rectangles on the above chart – how the price behaved and what happened in the RSI and MACD indicators. The situations are near-perfectly aligned.
If you were monitoring the gold market back in April 2013, you might remember the overall feeling among gold investors and traders when gold rallied from the 2012 lows. Practically everyone and their brother were convinced that the bottom in gold is really in, and that it was about to soar to new highs.
Sort of like what we experienced recently.
However, it wasn’t the bottom. It wasn’t even the mid-point of the entire medium-term decline.
Sure, history doesn’t have to repeat itself to the letter, and the geopolitical and monetary situation now is different than it was back in 2013, but… Fear and greed work in the same way, and when people try to forecast the future by looking at previous price patterns (very few people look at the big picture; most just focus on the last year or so), they ultimately follow a similar emotional process. This leads them to repeat their past behaviors and, as a result, the price patterns continue to be similar.
Actually, the situation regarding monetary policy now supports even a more profound slide than it did back in 2013. Still, due to geopolitics, the decline could be “only” similar to what we saw back then.
There’s very strong support just a bit below $1,400, and the decline to this level (approximately) would be in tune with the size of the 2011-2013 decline.
Can gold really slide that low? Absolutely.
Will it slide there immediately? There’s a good chance we’ll have some sort of correction in the meantime, and one of them might be tradable. The rebound from the 2020 lows seems quite likely at the moment, but I’ll keep monitoring the situation and report to my subscribers accordingly. I’ll also describe which part of the precious metals sector is likely to benefit the most from this decline. At this time, it seems that junior mining stocks are likely to decline the most (as they have so far this year), but this might change as prices move lower.
Either way, the short- and medium-term outlooks for gold are bearish.
Having said that, let’s take a look at the markets from a more fundamental point of view.
The Data Doesn’t Lie
While gold and silver suffered relatively mild drawdowns on Oct. 7, mining stocks and the S&P 500 were under immense pressure. Moreover, while I repeatedly warned that investors were buying hope and selling reality, the latter came back with a vengeance. To explain, I wrote on Sep. 22:
Powell said on Sep. 21 that “we need to have softer labor market conditions” as supply and demand “continues to be out of balance.” Likewise, he cited how U.S. job openings greatly outnumber unemployed Americans and how the imbalance helps fuel wage inflation.
However, if you’ve been reading my daily Gold & Silver Trading Alert, I’ve covered this extensively, and none of this is news to you. Yet, with the crowd now cheering on a higher unemployment rate, labor market destruction has become the new bull case.
Please see below:
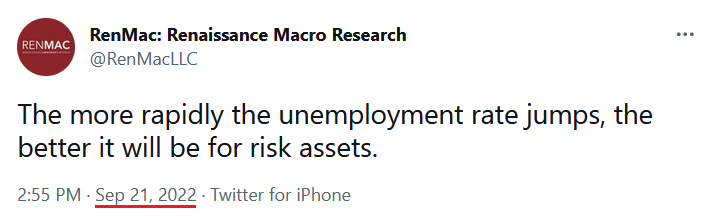
Well, despite RenMac’s obvious assessment being many months too late, the reality is that the U.S. labor market remains in a healthy position; and as long as that’s the case, the Fed has the green light to hammer inflation.
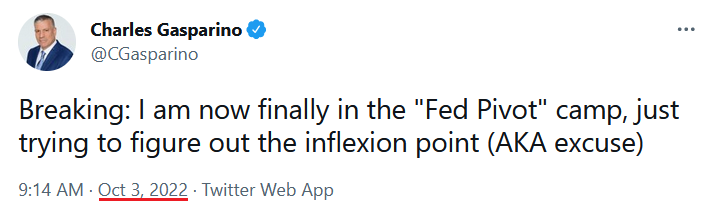
Speaking of which, with U.S. nonfarm payrolls outperforming expectations on Oct. 7, the resilient print was another reminder of why the pivot narrative was destined to fail.
Please see below:
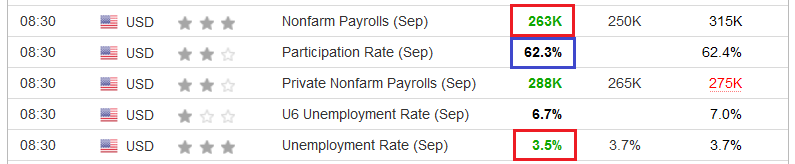 Source: Investing.com
To explain, the first red box above shows that U.S. nonfarm payrolls came in at 263,000 versus 250,000 expected. Furthermore, the blue box above shows that the labor force participation rate decreased from 62.4% in August to 62.3% in September.
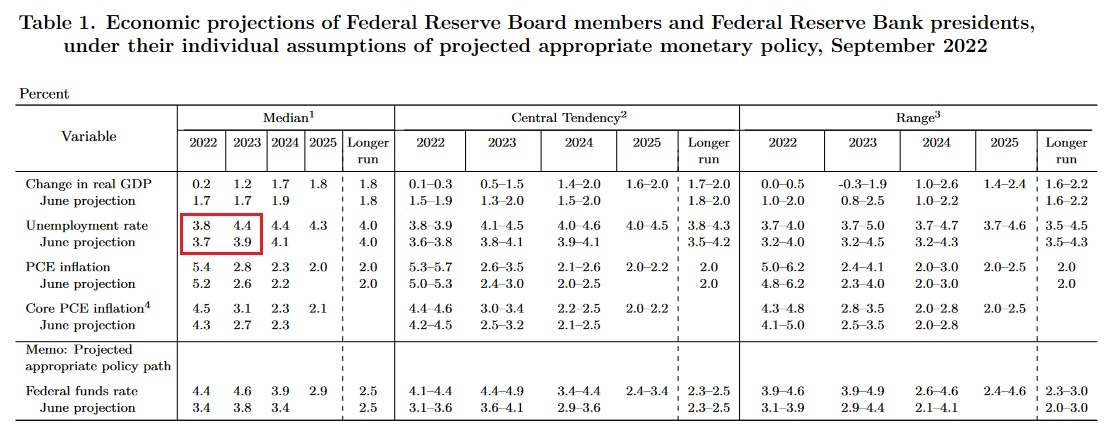
Therefore, increased hiring combined with fewer Americans looking for work led to the U.S. unemployment rate decreasing from 3.7% to 3.5% (the second red box). Remember, the FOMC’s latest Summary of Economic Projections (SEP) has the U.S. unemployment rate hitting 3.8% in 2022 and 4.4% in 2023. As a result, with the metric heading in the opposite direction, a resilient U.S. labor market is profoundly bullish for the U.S. federal funds rate (FFR), real yields, and the USD Index.
Please see below:
 Source: U.S. Fed
Also constrictive, long-term employment continues to showcase strength, and a continuation of the trend should keep the Fed’s foot on the hawkish accelerator.
Please see below:
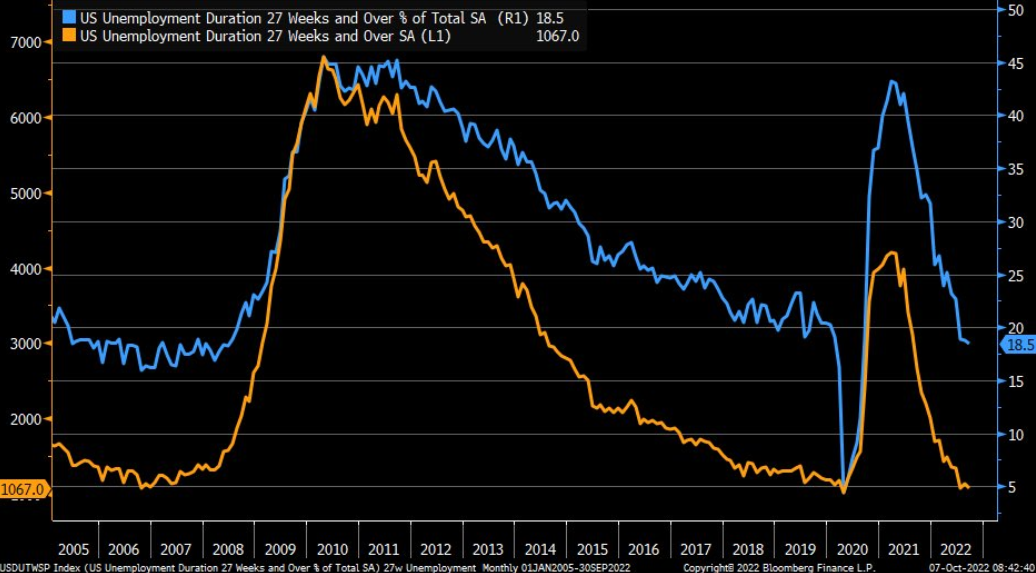
To explain, the orange and blue lines above track the number and percentage of Americans that have been unemployed for 27 weeks or more. If you analyze the right side of the chart, you can see that the blue line hit a new 2022 low, while the orange line declined month-over-month (MoM) and remains near its low. As such, nothing in the data gives the Fed a cause for pause.
In addition, while average hourly earnings declined from 5.1% year-over-year (YoY) in August to 5% YoY in September, the labor force participation rate's drop is bullish for future wage inflation. Likewise, with the MoM print still too hot for the Fed's liking, the pivot crowd is fighting a losing battle.
Please see below:
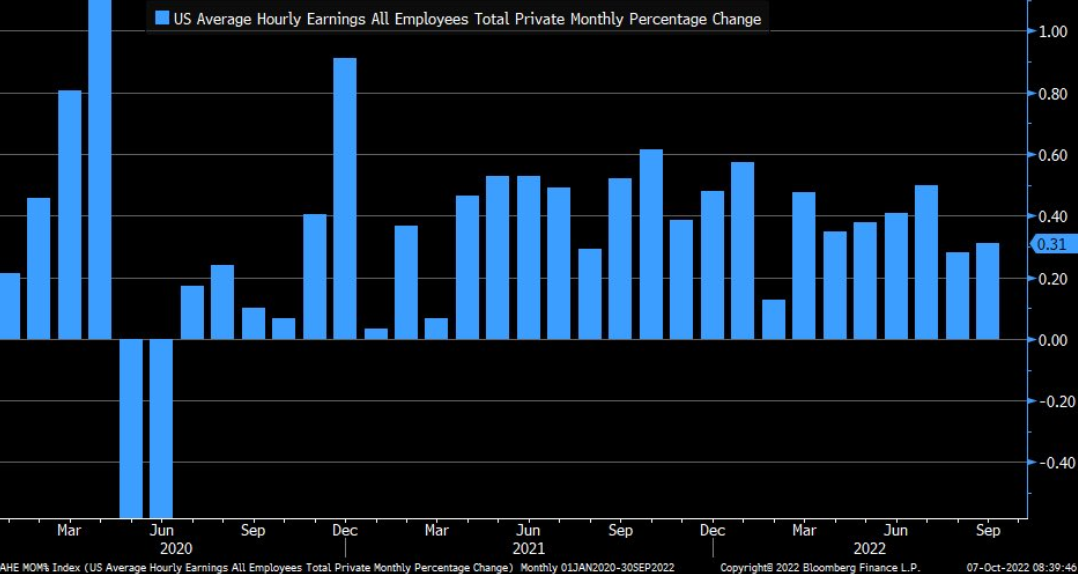
To explain, the blue bars above track the MoM percentage change in average hourly earnings. If you analyze the right side of the chart, you can see that September’s 0.31% rise eclipsed the 0.28% jump in August. As a result, the Fed is nowhere near achieving its goal, and I warned numerous times that its inflight fight would be one of attrition.
If that wasn’t enough, the Atlanta Fed updated its third-quarter real GDP projection on Oct. 7; and with the estimate hitting a new periodic high of 2.9%, resilient economic growth is another reason the Fed remains in the hawkish game.
Please see below:
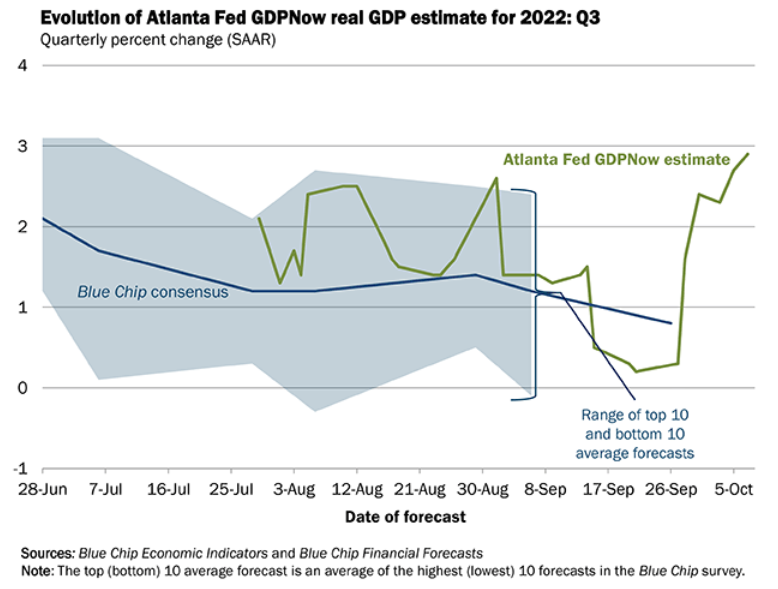
To explain, the green line above tracks the Atlanta Fed’s Q3 real GDP projection, while the blue line above tracks the Blue Chip consensus expectation (investment banks). If you analyze the right side of the chart, you can see that the green line has moved materially higher in recent weeks. Therefore, with the Fed poised to place more emphasis on its own estimates, a realization supports more rate hikes, not less.
As such, while the narrative crowd created anxiety with their faulty analysis, I warned on Oct. 4 that buying the hype is the quickest way to the poor house. I wrote:
Extremely impressionable investors flock to narratives like a snowball rolling down a hill. The more ground it covers, the larger it becomes. However, if you bought the GDXJ ETF every time one of these false narratives emerged, your portfolio would have suffered substantial losses (…).
While it’s hard to count how many times investors have predicted a dovish pivot in 2022, each iteration has been incorrect. Moreover, with realized inflation, projected real GDP growth and the U.S. labor market still resilient, investors are in la-la land if they think these metrics support a dovish 180.
The Same Song
While pivot hopes were a figment of investors’ imagination, Fed officials have been resolute in their commitment to curbing inflation; and with more hawkish commentary hitting the wire on Oct. 7, the fundamentals remain bullish for the FFR, real yields, and the USD Index.
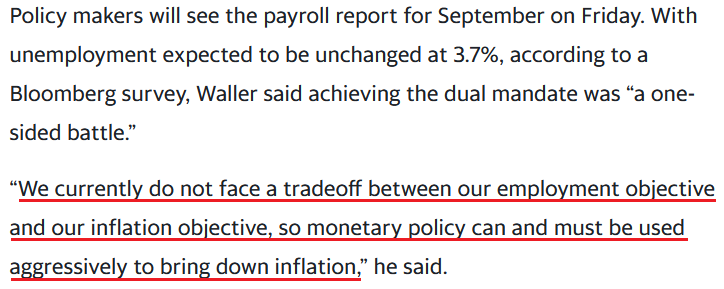
For example, Fed Governor Christopher Waller said on Oct. 7:
“Inflation is far from the FOMC’s goal and not likely to fall quickly. This is not the inflation outcome I am looking for to support a slower pace of rate hikes or a lower terminal policy rate.”
He added:
“Until [inflation] progress is both meaningful and persistent, I support continued rate increases, along with ongoing reductions in the Fed’s balance sheet, to help restrain aggregate demand (…). The focus of monetary policy needs to be fighting inflation. We have tools in place to address any financial stability concerns and should not be looking to monetary policy for this purpose.”
Thus, while I stated on Sep. 22 that a resilient U.S. labor market gives the Fed the green light to hammer inflation, Waller made the point for me.
Please see below:
 Source: Bloomberg
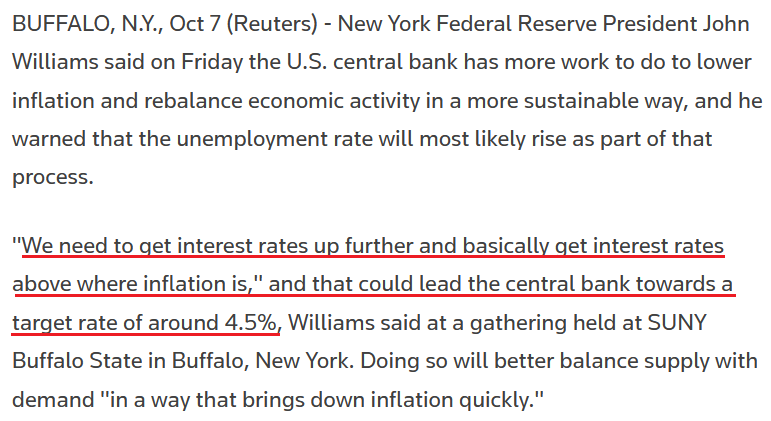
Echoing that sentiment, New York Fed President John Williams said on Oct. 7:
The U.S. economy has "a very strong labor market, which is a good thing except for very high inflation (…). Right now the focus is getting inflation back down to 2% and doing that in a way that keeps the economy growing. The timing of that and how high do we have to raise interest rates is going to depend on the data.”
As a result, Fed officials remain united in their quest to quell inflation.
Please see below:
 Source: Reuters
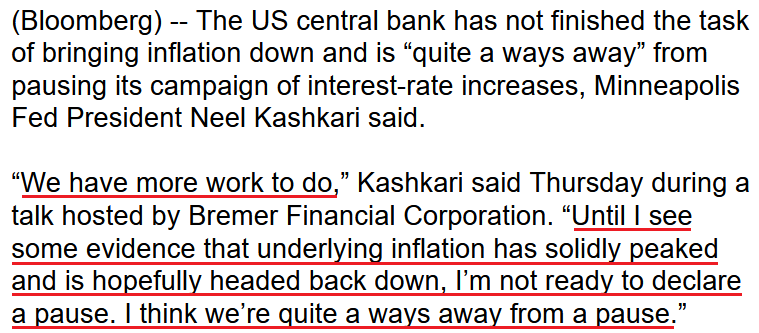
Speaking the day before, Minneapolis Fed President Neel Kashkari said on Oct. 6:
“Commodity prices move up and down, but underlying inflation – like wages and services – tend to be stickier. We’re not seeing any evidence yet that those things are moving in the right direction.”
He added:
“I fully expect that there are going to be some losses and there are going to be some failures around the global economy as we transition to a higher interest rate environment, and that’s the nature of capitalism.
“We need to keep our eyes open for risks that could be destabilizing for the American economy as a whole. But to me, the bar to actually shifting our stance on policy is very high. It should not be up to the Federal Reserve or the American taxpayer to bail people out.”
So while the consensus let hope cloud their judgment, Kashkari emphasized that the Fed is far from finished.
 Source: Bloomberg
The Bottom Line
While gold has been immensely resilient despite the 2022 surges in the USD Index and the U.S. 10-Year real yield, the GDXJ ETF has suffered mightily. As a result, it highlights the importance of choosing the right asset when implementing a short position.
Furthermore, with the U.S. labor market on solid footing, inflation materially elevated and real GDP still resilient (if the Atlanta Fed’s projection holds), the medium-term outlook is immensely bullish for the FFR, real yields and the USD Index.
In contrast, gold, silver, and mining stocks are unlikely to perform well in the face of a hawkish Fed and evaporating liquidity. Thus, my comments from Apr. 6 should continue to prove prescient:
Please remember that the Fed needs to slow the U.S. economy to calm inflation, and rising asset prices are mutually exclusive to this goal. Therefore, officials should keep hammering the financial markets until investors finally get the message.
Moreover, with the Fed in inflation-fighting mode and reformed doves warning that the U.S. economy “could teeter” as the drama unfolds, the reality is that there is no easy solution to the Fed’s problem. To calm inflation, it has to kill demand. If that occurs, investors should suffer a severe crisis of confidence.
In conclusion, the PMs declined on Oct. 7, as the pivot narrative suffered another blow; and with the USD Index and the U.S. 10-Year real yield continuing to climb, the pair should hit higher highs in the months ahead. Conversely, the PMs should head in the opposite direction.
Overview of the Upcoming Part of the Decline
- It seems to me that the corrective upswing is over, and that the next big move lower is already underway.
- If we see a situation where miners slide in a meaningful and volatile way while silver doesn’t (it just declines moderately), I plan to – once again – switch from short positions in miners to short positions in silver. At this time, it’s too early to say at what price levels this could take place and if we get this kind of opportunity at all – perhaps with gold prices close to $1,600.
- I plan to switch from the short positions in junior mining stocks or silver (whichever I’ll have at that moment) to long positions in junior mining stocks when gold / mining stocks move to their 2020 lows (approximately). While I’m probably not going to write about it at this stage yet, this is when some investors might consider getting back in with their long-term investing capital (or perhaps 1/3 or 1/2 thereof).
- I plan to return to short positions in junior mining stocks after a rebound – and the rebound could take gold from about $1,450 to about $1,550, and it could take the GDXJ from about $20 to about $24.
- I plan to exit all remaining short positions once gold shows substantial strength relative to the USD Index while the latter is still rallying. This may be the case with gold prices close to $1,400 and GDXJ close to $15 . This moment (when gold performs very strongly against the rallying USD and miners are strong relative to gold after its substantial decline) is likely to be the best entry point for long-term investments, in my view. This can also happen with gold close to $1,400, but at the moment it’s too early to say with certainty.
- The above is based on the information available today, and it might change in the following days/weeks.
You will find my general overview of the outlook for gold on the chart below:
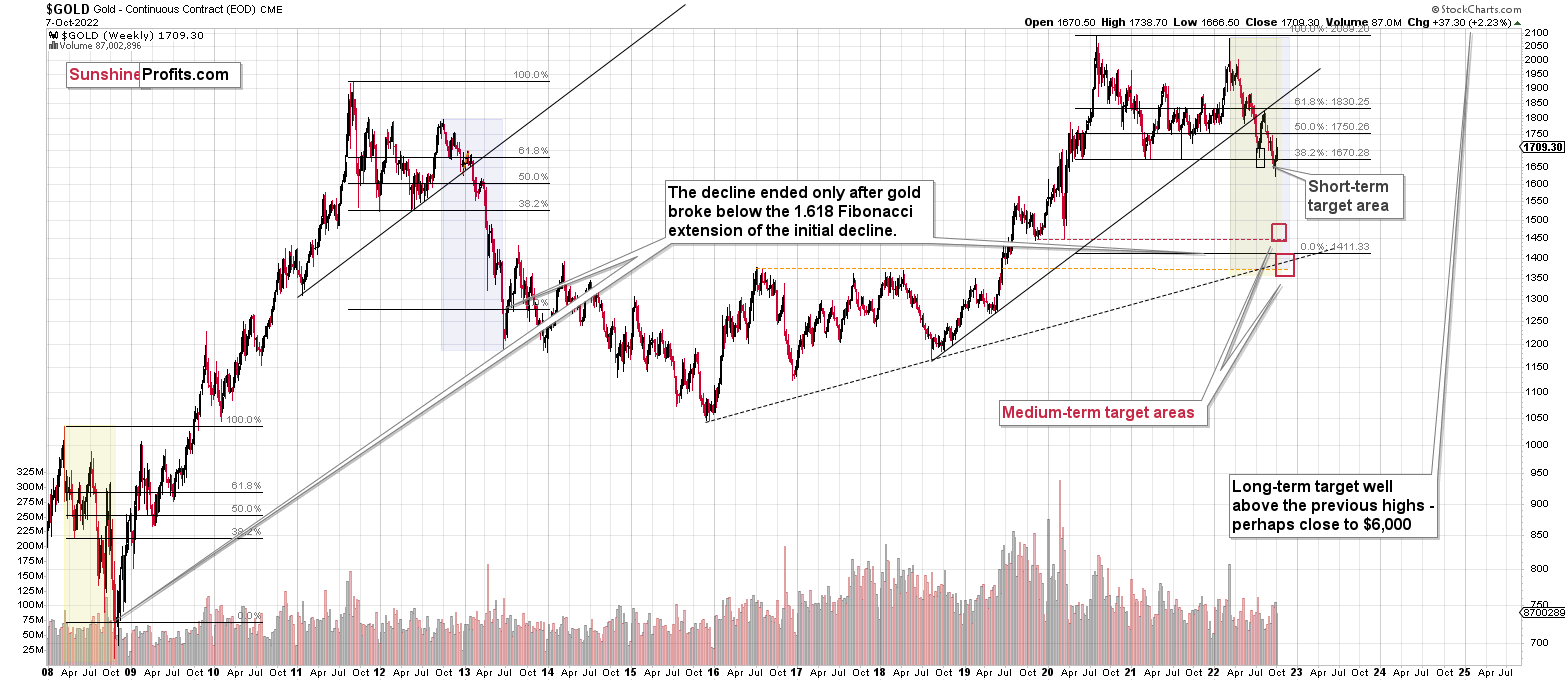
Please note that the above timing details are relatively broad and “for general overview only” – so that you know more or less what I think and how volatile I think the moves are likely to be – on an approximate basis. These time targets are not binding nor clear enough for me to think that they should be used for purchasing options, warrants, or similar instruments.
Letters to the Editor
Q: Question: is the potential drop in gold going to mirror the market drop or will gold decouple from the action of the broader market? It seems to be in lock-step with the market currently.
Thank you.
A: In my view, gold (and the rest of the precious metals market) is likely to initially decline in tune with the general stock market, although the declines might not be aligned on a day-to-day basis. So, there might be days where they move in opposite directions, but overall, I expect them to decline simultaneously.
And I think that PMs – especially junior miners – will decline more than the main stock indices.
Then, at some point, I think that the precious metals sector will form its bottom, while stocks continue to slide. Actually, the bottom might take place at the same time, but it might be the final bottom for the PMs and only a temporary bottom for stocks.
That’s pretty much what happened at the 2020 and 2008 bottoms.
Q: I have re-read everything, and we are now below 61.8 and 50 fib. I think the slide may be very near. Since this is so similar to 2012 and 2013, almost exactly 10 years later, can we see the final or second downswing in 2023?
A: We can, but let’s also keep in mind that this time the decline is sharper than what we saw in 2013, and that’s particularly visible in the case of the HUI Index. Consequently, the final bottom could form in 2023 (early), but it could also form in the final part of this year. I find the latter scenario more likely at this moment.
Summary
Summing up, it seems that the biggest part of the 2013-like decline is taking place right now, and – while I can’t make any promises regarding performance - it seems likely to me that our big profits are about to become huge, and then ridiculously big in the relatively near future.
As far as this quick corrective upswing is concerned, it seems that it might already be over.
The current quick upswing most likely doesn’t change anything. Fundamentals and technicals continue to point to lower precious metals values in the coming weeks / months. The current geopolitical news-based rally is likely to serve as nothing more than just a verification of the breakdown below the previous lows in gold.
Things might happen very fast in the coming days, and if I plan to make any adjustments, I’ll keep you informed. Still, if the targets that I’m mentioning in the “Trading” part of the summary are reached, I think that profits should be taken off the table without an additional confirmation from me. I will probably get on the long side of the market at that time, but I’ll send a confirmation if I decide to do so.
After the final sell-off (that takes gold to about $1,350-$1,500), I expect the precious metals to rally significantly. The final part of the decline might take as little as 1-5 weeks, so it's important to stay alert to any changes.
As always, we'll keep you – our subscribers – informed.
To summarize:
Trading capital (supplementary part of the portfolio; our opinion): Full speculative short positions (300% of the full position) in junior mining stocks are justified from the risk to reward point of view with the following binding exit profit-take price levels:
Mining stocks (price levels for the GDXJ ETF): binding profit-take exit price: $20.32; stop-loss: none (the volatility is too big to justify a stop-loss order in case of this particular trade)
Alternatively, if one seeks leverage, we’re providing the binding profit-take levels for the JDST (2x leveraged). The binding profit-take level for the JDST: $29.87; stop-loss for the JDST: none (the volatility is too big to justify a SL order in case of this particular trade).
For-your-information targets (our opinion; we continue to think that mining stocks are the preferred way of taking advantage of the upcoming price move, but if for whatever reason one wants / has to use silver or gold for this trade, we are providing the details anyway.):
Silver futures downside profit-take exit price: $12.32
SLV profit-take exit price: $11.32
ZSL profit-take exit price: $79.87
Gold futures downside profit-take exit price: $1,504
HGD.TO – alternative (Canadian) 2x inverse leveraged gold stocks ETF – the upside profit-take exit price: $19.87
HZD.TO – alternative (Canadian) 2x inverse leveraged silver ETF – the upside profit-take exit price: $49.87
Long-term capital (core part of the portfolio; our opinion): No positions (in other words: cash)
Insurance capital (core part of the portfolio; our opinion): Full position
Whether you’ve already subscribed or not, we encourage you to find out how to make the most of our alerts and read our replies to the most common alert-and-gold-trading-related-questions.
Please note that we describe the situation for the day that the alert is posted in the trading section. In other words, if we are writing about a speculative position, it means that it is up-to-date on the day it was posted. We are also featuring the initial target prices to decide whether keeping a position on a given day is in tune with your approach (some moves are too small for medium-term traders, and some might appear too big for day-traders).
Additionally, you might want to read why our stop-loss orders are usually relatively far from the current price.
Please note that a full position doesn't mean using all of the capital for a given trade. You will find details on our thoughts on gold portfolio structuring in the Key Insights section on our website.
As a reminder - "initial target price" means exactly that - an "initial" one. It's not a price level at which we suggest closing positions. If this becomes the case (as it did in the previous trade), we will refer to these levels as levels of exit orders (exactly as we've done previously). Stop-loss levels, however, are naturally not "initial", but something that, in our opinion, might be entered as an order.
Since it is impossible to synchronize target prices and stop-loss levels for all the ETFs and ETNs with the main markets that we provide these levels for (gold, silver and mining stocks - the GDX ETF), the stop-loss levels and target prices for other ETNs and ETF (among other: UGL, GLL, AGQ, ZSL, NUGT, DUST, JNUG, JDST) are provided as supplementary, and not as "final". This means that if a stop-loss or a target level is reached for any of the "additional instruments" (GLL for instance), but not for the "main instrument" (gold in this case), we will view positions in both gold and GLL as still open and the stop-loss for GLL would have to be moved lower. On the other hand, if gold moves to a stop-loss level but GLL doesn't, then we will view both positions (in gold and GLL) as closed. In other words, since it's not possible to be 100% certain that each related instrument moves to a given level when the underlying instrument does, we can't provide levels that would be binding. The levels that we do provide are our best estimate of the levels that will correspond to the levels in the underlying assets, but it will be the underlying assets that one will need to focus on regarding the signs pointing to closing a given position or keeping it open. We might adjust the levels in the "additional instruments" without adjusting the levels in the "main instruments", which will simply mean that we have improved our estimation of these levels, not that we changed our outlook on the markets. We are already working on a tool that would update these levels daily for the most popular ETFs, ETNs and individual mining stocks.
Our preferred ways to invest in and to trade gold along with the reasoning can be found in the how to buy gold section. Furthermore, our preferred ETFs and ETNs can be found in our Gold & Silver ETF Ranking.
As a reminder, Gold & Silver Trading Alerts are posted before or on each trading day (we usually post them before the opening bell, but we don't promise doing that each day). If there's anything urgent, we will send you an additional small alert before posting the main one.
Thank you.
Przemyslaw Radomski, CFA
Founder, Editor-in-chief

