

Briefly: in our opinion, full (300% of the regular position size) speculative short positions in junior mining stocks are justified from the risk/reward point of view at the moment of publishing this Alert.
In yesterday’s video analysis, I emphasized that gold, silver, and mining stocks are moving lower, and that they can do that regardless of the possible rally in the stock market. Let’s start today’s analysis with a look at how perfectly the markets confirmed what I said yesterday.
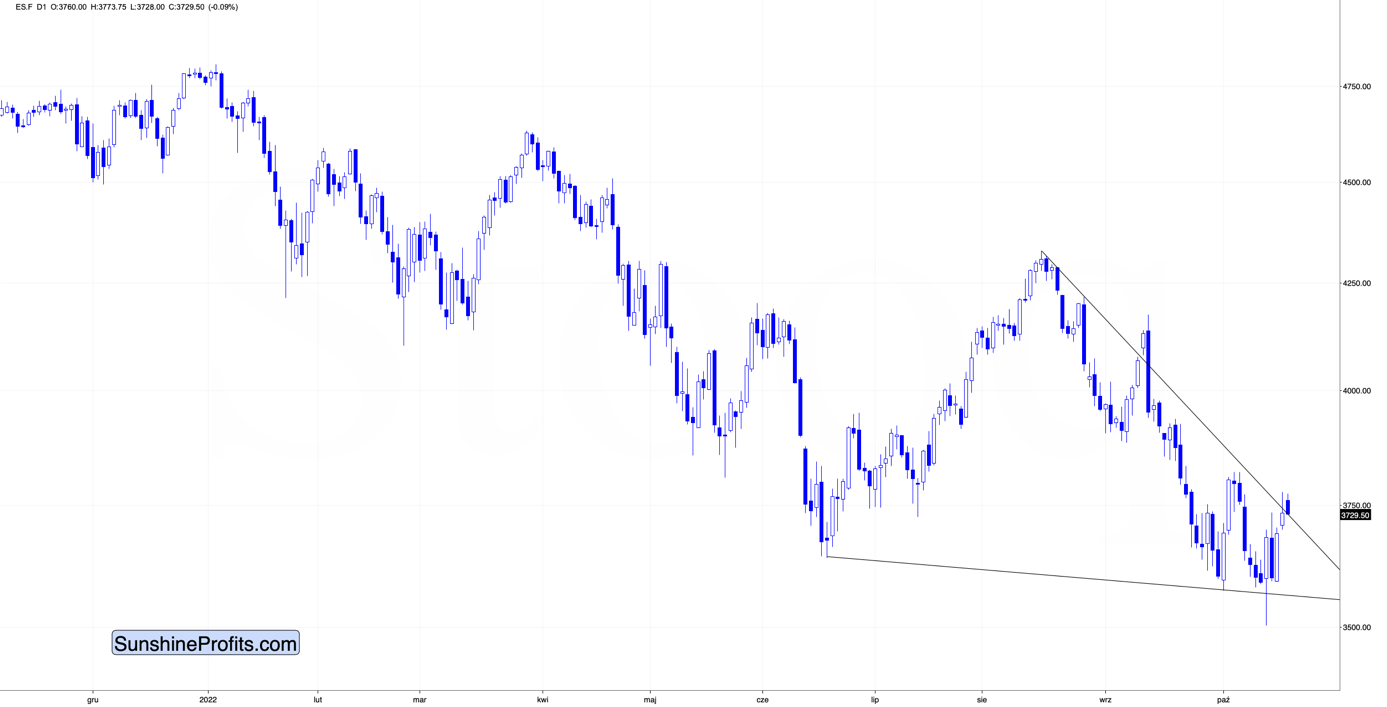
Stocks ended yesterday’s session higher, and in today’s overnight trading, they are moving sideways.
So, theoretically, gold, silver, and mining stocks had a good reason to rally yesterday and do nothing today.
The influence coming from the USD Index is somewhat similar.
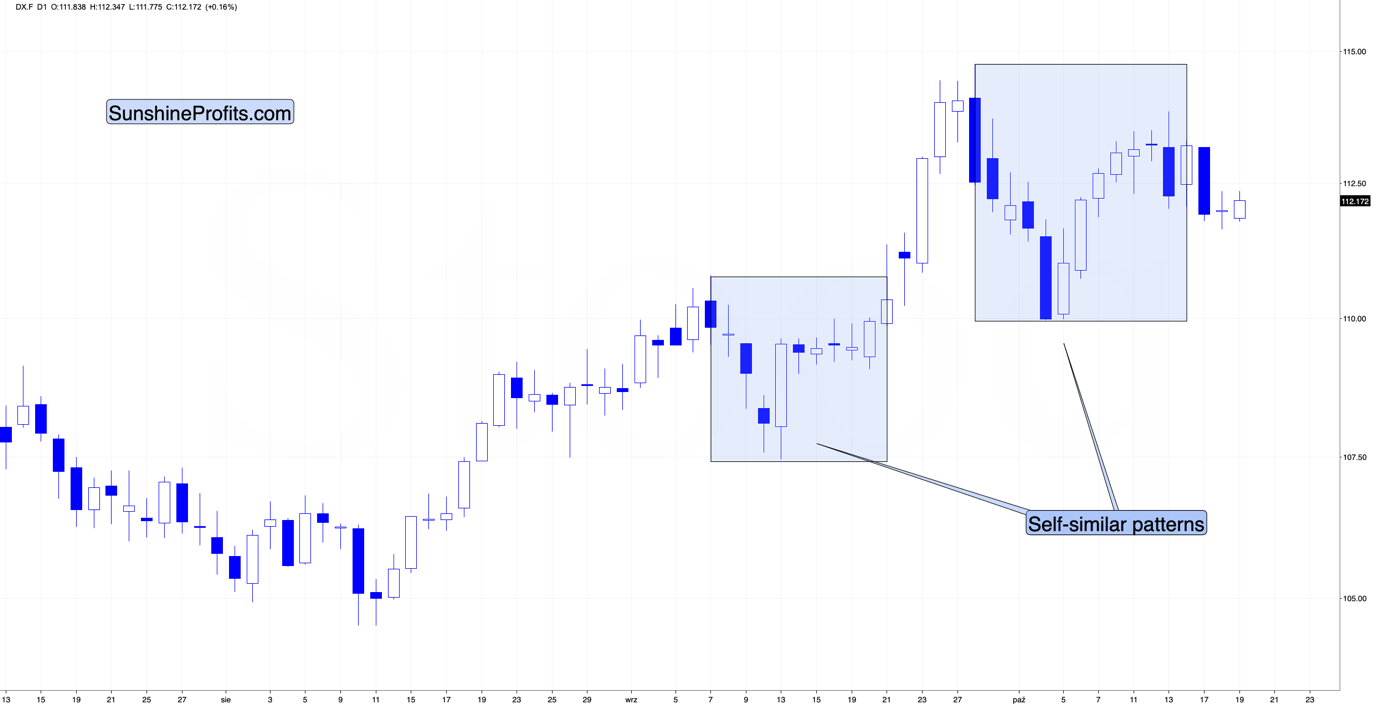
Nothing really happened yesterday, and the USDX is up just slightly in today’s overnight trading. Thus, gold had a good reason not to do anything yesterday, and decline just a little today.
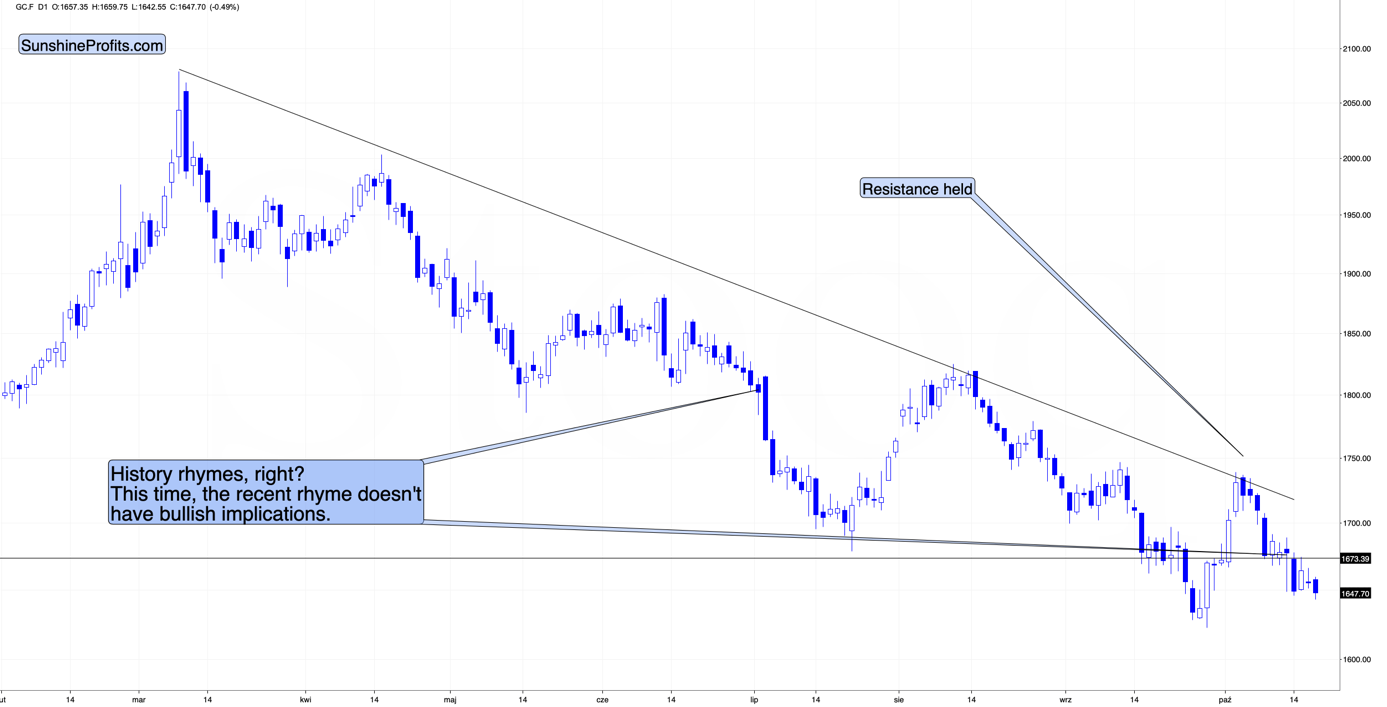
Instead, gold just moved to new monthly lows.
This is not really supported by the moves in either the stock market or the USD Index. It seems that gold simply wants to decline here.
Since it recently broke below a very strong support area (that it then verified as resistance), it seems that gold could fall significantly soon.
While gold is weak, maybe the junior miners are strong?
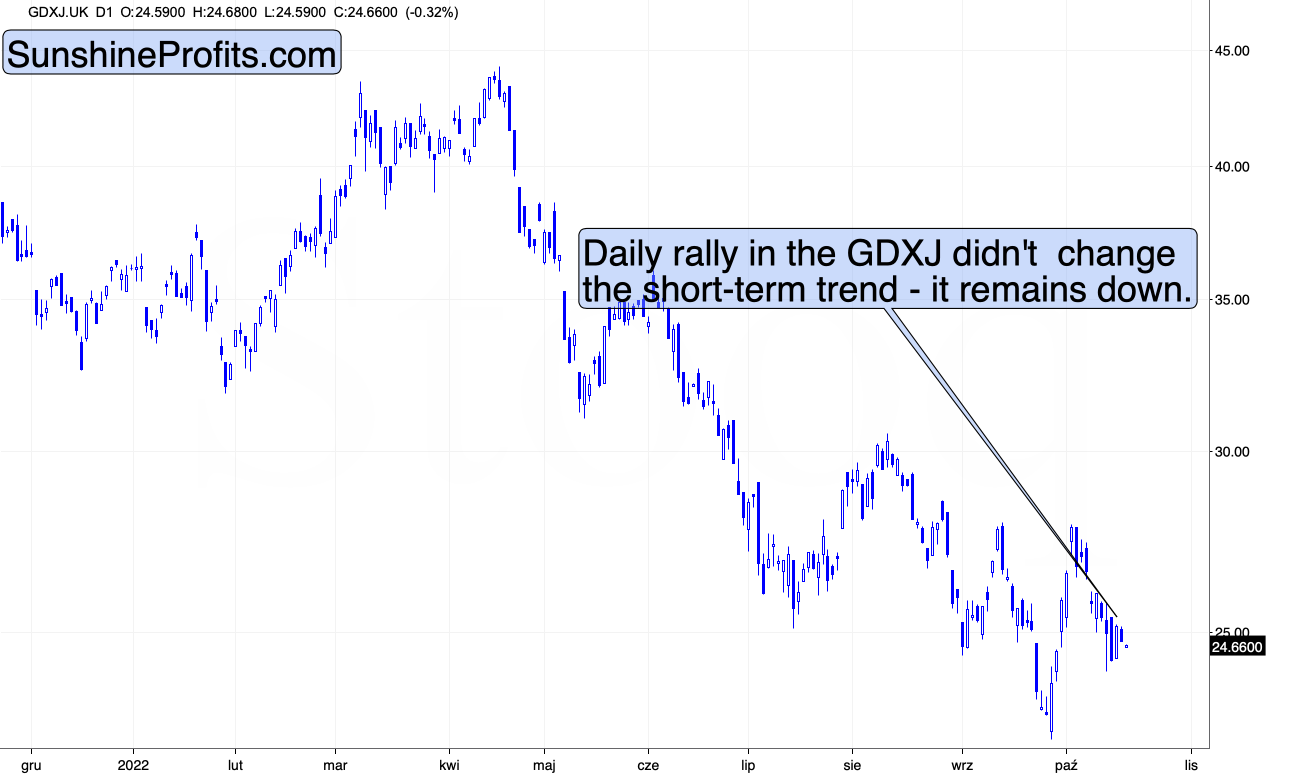
While they didn’t move to a new monthly low just yet, it’s clear that their short-term downtrend continues, and the theoretically positive impact of the general stock market doesn’t affect them in the way it “should”. Consequently – that’s right, you guessed it – it seems that junior miners really want to slide once again.
Given the analogy to 2013, it seems that they can now slide really profoundly.
Having said that, let’s take a look at the markets from a more fundamental point of view.
No Need to Follow
With investor sentiment highly depressed and bearish over-positioning amplifying the issue, gold, silver, mining stocks and the S&P 500 are playing a game of chicken. In a nutshell: if one rallies, it may entice the others.
However, while the S&P 500 confronts a bullish tactical setup, the PMs’ don’t need to follow in the index’s footsteps. For example, the S&P 500 bounced off its 200-week moving average, and the key level has acted as long-term support. Therefore, absent a Lehman-like event, the MA could provide a short-term floor.
Moreover, while Morgan Stanley’s Chief U.S. Equity Strategist Mike Wilson has been a vocal bear in 2022, even he conceded that in his latest note. He wrote:
If inflation and interest rates decline in the near term, “it will give legs to the [S&P 500] rally that began last Thursday... We think 4,000 is as good a guess as any and would not rule out another attempt to re-take the 200-day moving average (~4150).”
He added:
“While that seems like an awfully big move, it would be in line with prior bear market rallies this year and prior ones. The other factor we have to respect is the technicals. As noted two weeks ago, the 200-week moving average (...) is hard to take out without a fight.”
Thus, while Wilson reiterated that he expects the S&P 500 to trough near 3,000 if a recession occurs, the current setup is bullish because the bearish thesis has become crowded.
To that point, corporations remain the largest buyers of U.S. equities, and with the buyback blackout period ending next week, it could provide further support for stocks. Furthermore, when you add large short bets by hedge funds and retail traders purchasing put options like there is no tomorrow, the positioning imbalance is relatively bullish for the S&P 500.
In addition, more supportive data hit the wire on Oct. 18.
Please see below:
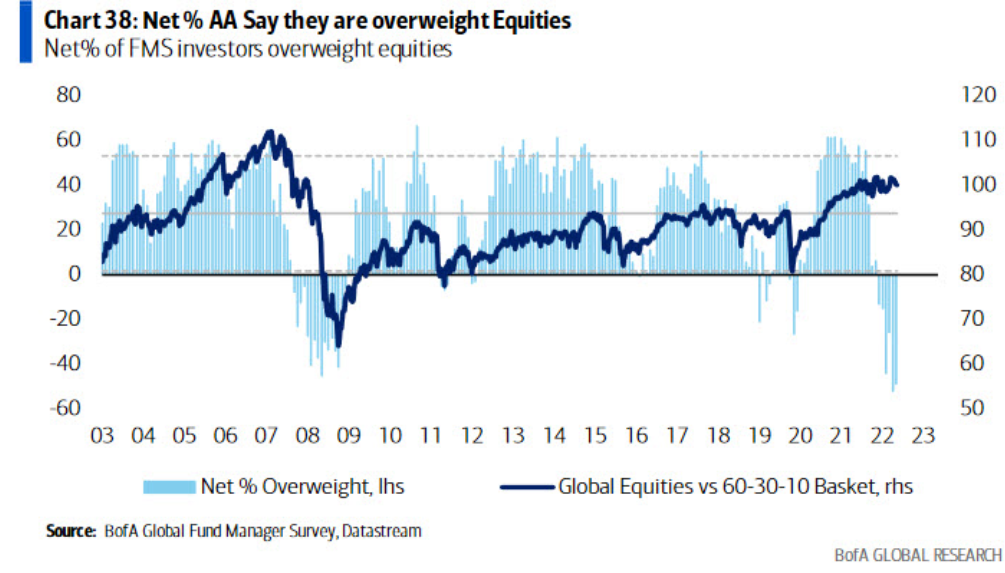
To explain, Bank of America released its latest Global Fund Manager Survey (FMS) on Oct. 18. The light blue bars above track the net percentage of respondents that are overweight stocks. If you analyze the right side of the chart, you can see that the metric has fallen below the global financial crisis (GFC) low. As such, fear is palpable, and countertrend moves often occur when too many investors expect a similar outcome.
Likewise, the panic has fund managers raising cash at an alarming rate.
Please see below:
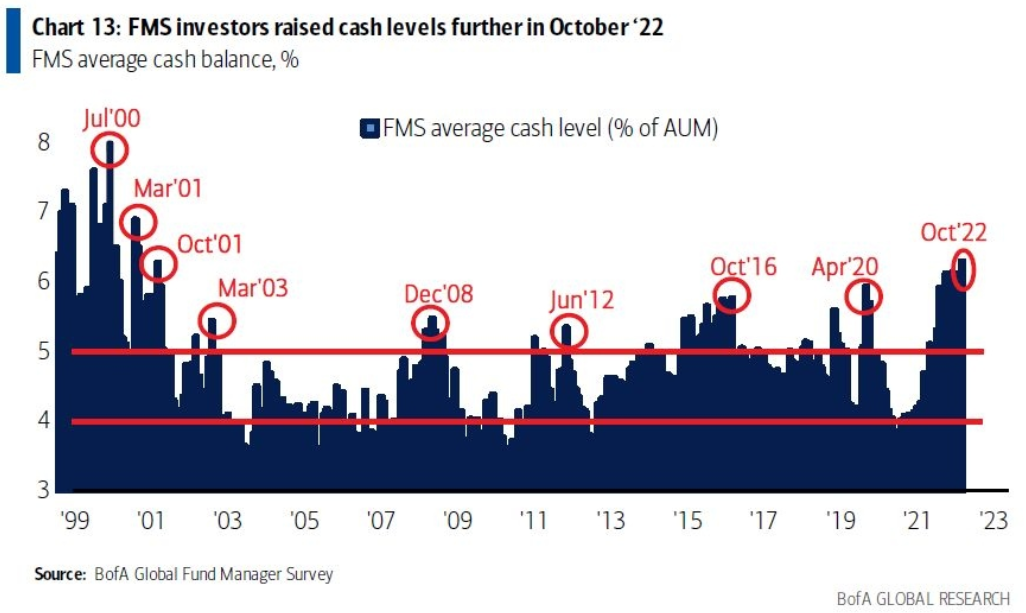
To explain, the blue bars above track fund managers’ average cash level. If you analyze the right side of the chart, you can see that the metric hit a new 2022 high in October and is at its highest level in more than 20 years.
On top of that, Commodity Trading Advisors’ (CTA) – which often employ systematic or quant strategies – exposure to stocks is extremely low. As a result, a reversal could help ignite a bear market rally.
Please see below:
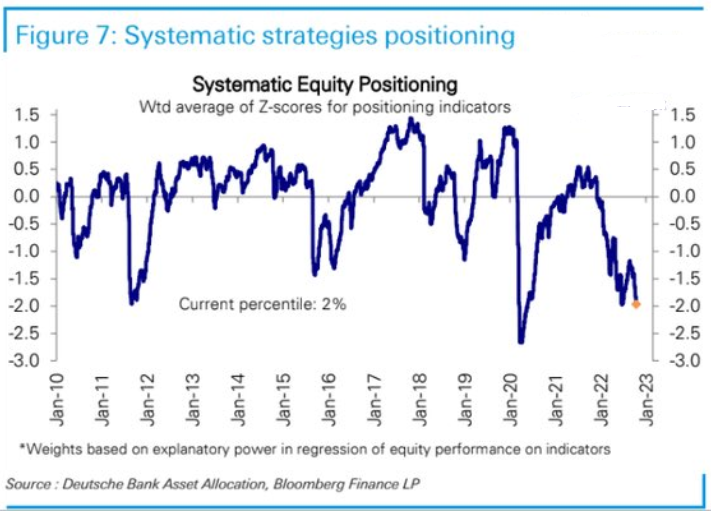
To explain, the blue line above tracks the z-score of systematic funds’ equity positioning. If you analyze the right side of the chart, you can see that the negative ~2 standard deviation reading is in the second percentile. Therefore, the crowd is profoundly bearish, and a small bout of good news could reverse these negative trends and support stocks in the short term.
Finally, seasonality is also in the bulls’ favor. With the S&P 500 often rallying from late October until the end of December, the backdrop is fruitful.
Please see below:
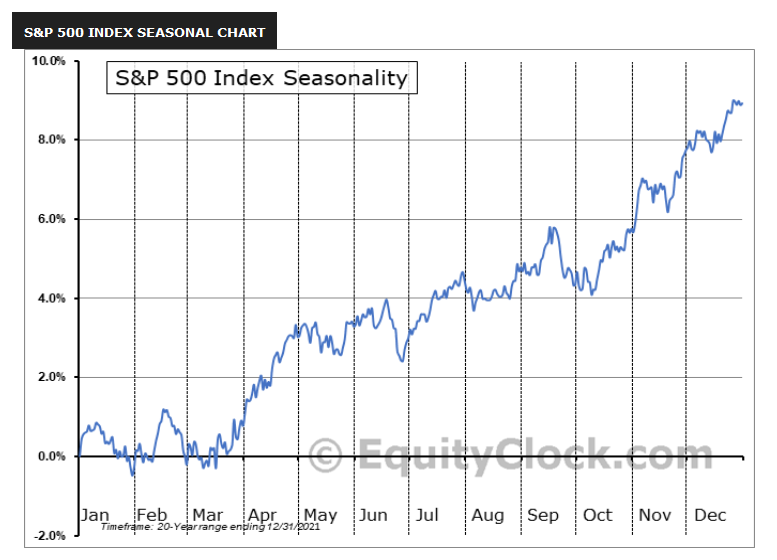
To explain, the blue line above tracks the S&P 500’s seasonality. If you analyze the Oct, Nov and Dec periods on the right side of the chart, you can see that the timeframe is historically bullish for the S&P 500.
Now, the purpose of presenting these charts is to be objective. It doesn’t help anyone to proclaim that the S&P 500’s setup is bearish when the data suggests otherwise. Unfortunately, this over-positioning occurs when too many investors see things from our perspective.
Remember, I warned throughout 2021 and 2022 that rampant inflation would force the Fed’s hand and help upend gold, silver, mining stocks, and the S&P 500. Moreover, while the prediction provided was prescient, the thesis has now become the consensus. Thus, it’s harder to predict lower stock prices in the short term when the majority of investors expect the same outcome.
However, the key point is that the PMs are a different asset class; and while the GDXJ ETF is influenced by the S&P 500, the performance of gold holds more weight.
Please see below:
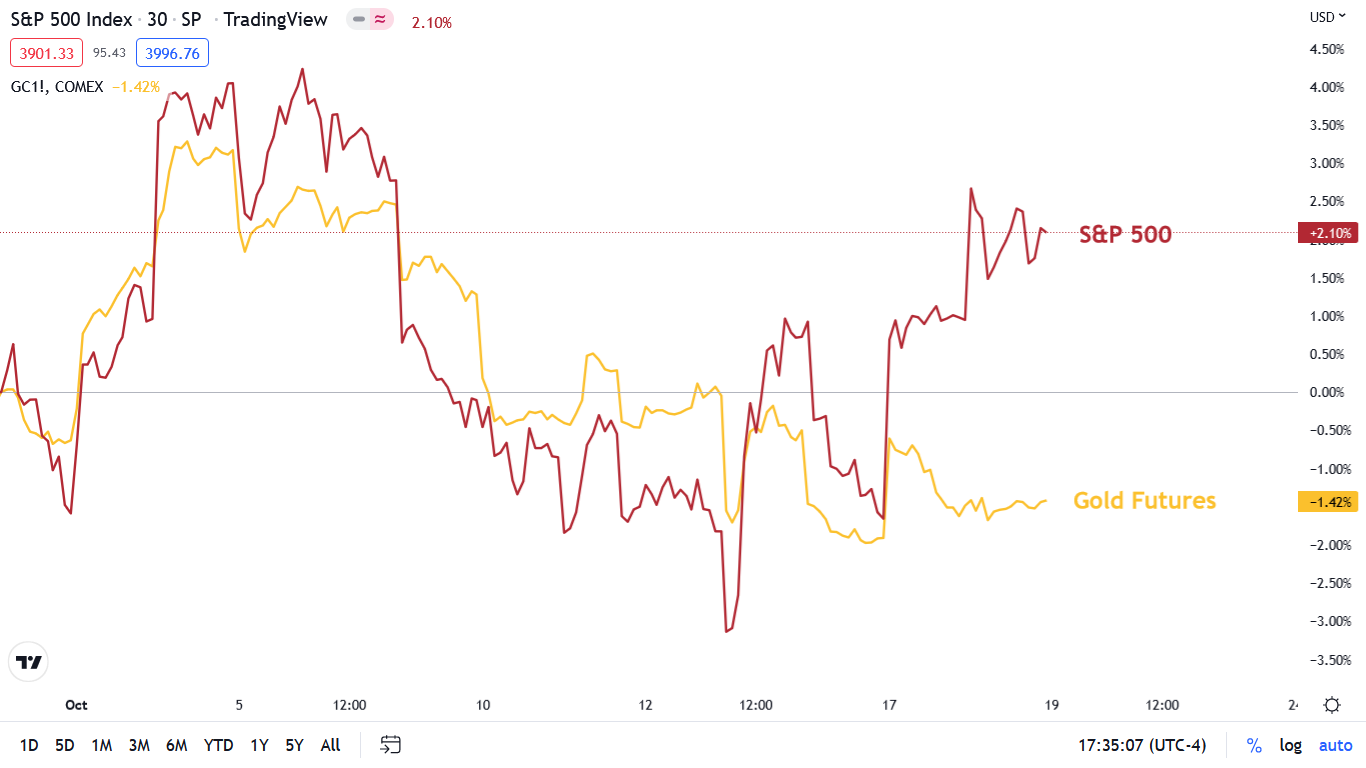
To explain, the gold line above tracks the 30-minute performance of the gold futures price, while the red line above tracks the 30-minute performance of the S&P 500. If you analyze the relationship, you can see that they often move in a similar direction.
However, it’s not always the case, and if you focus your attention on the right side of the chart, you can see that gold has not participated in the recent rally. As a result, the PMs could fall while the S&P 500 rises.
As further evidence, the daily chart shows how gold and the S&P 500 have decoupled on numerous occasions.
Please see below:
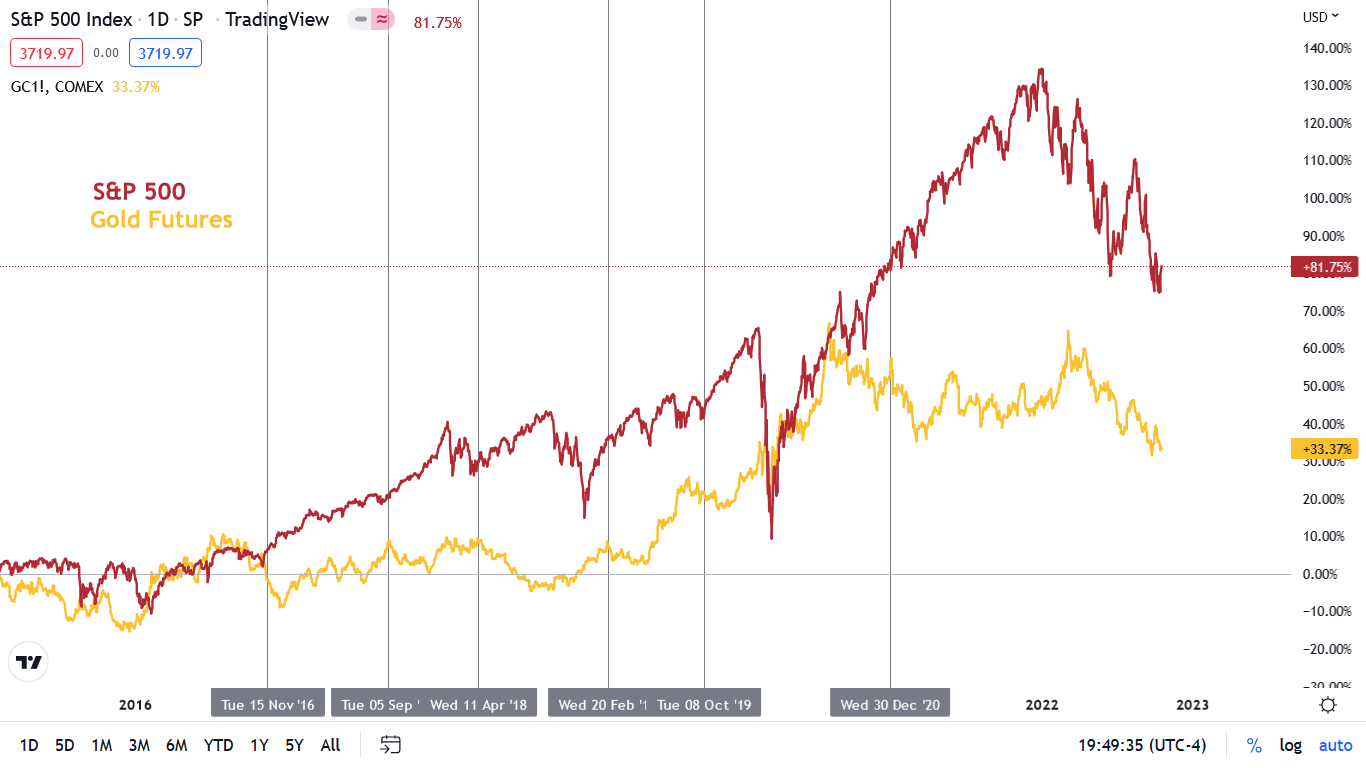
To explain, the vertical gray lines above depict periods where the S&P 500 rallied and the gold futures price declined. Therefore, while it would be helpful for the S&P 500 to fall, the index's plight is not necessary for the PMs to endure weakness.
All in all, positioning, sentiment and seasonality support a higher S&P 500, while the medium-term technicals and fundamentals are profoundly bearish. Thus, we consider any strength a bear market rally and expect the index to hit lower lows in the months ahead. However, since asset prices don't move in a straight line, the setup is tactically bullish.
In contrast, the PMs remain in harm's way because investors' positioning is not identical. For example, non-commercial (speculative) futures traders are significantly net short of the S&P 500.
Please see below:
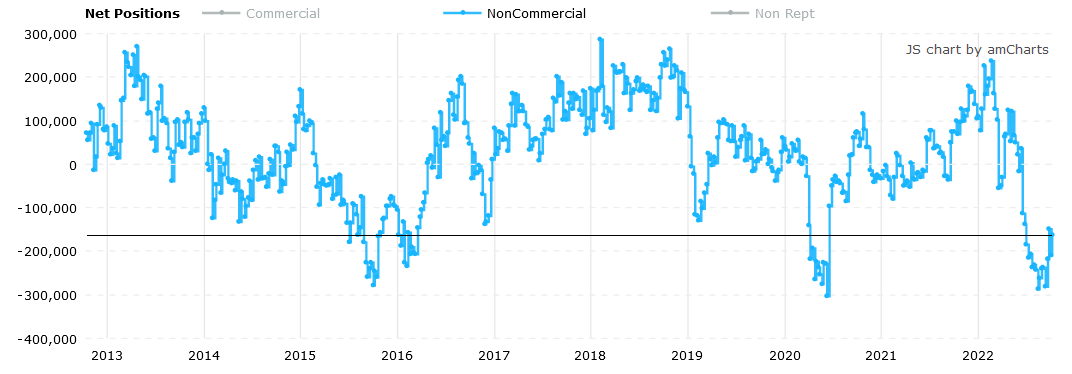 Source: Commitments of Traders (COT) report
Conversely, speculators are still net long gold. As such, the implications are much different, and the yellow metal can’t rely on a short squeeze to propel it higher.
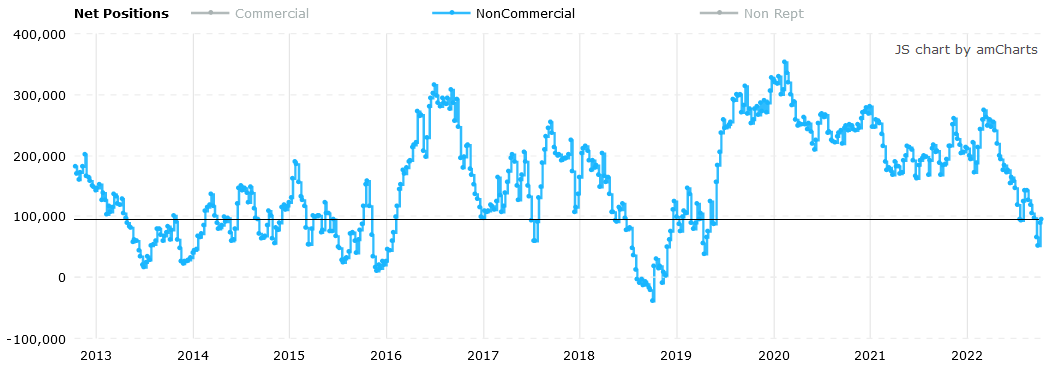 Source: COT report
Don’t Dismiss the Bear
It’s important to contrast the S&P 500’s bullish short-term backdrop with its ominous medium-term outlook. With the Fed on a hawkish warpath and inflation still materially elevated, further rate hikes should pressure demand and compress corporate profits. Therefore, while the S&P 500 has the wind at its back for now, the months ahead are much less optimistic.
Please see below:
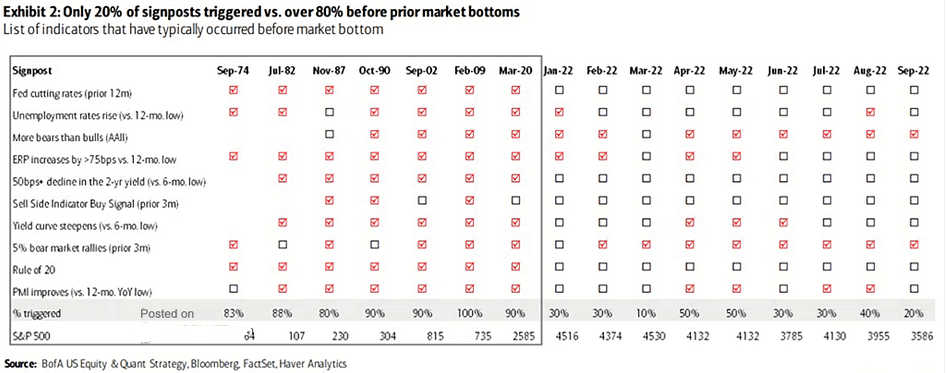
To explain, Bank of America compiled a checklist of events that often coincide with bear market bottoms. It includes variables like the Fed cutting interest rates, changes in PMIs, an increase in the equity risk premium (ERP), as well as other fundamental and sentiment indicators.
However, if you analyze the right side of the table (Sep-22), you can see that only 20% of these indicators have materialized, while 80% or more have been triggered during the bear market lows from 1974 to March 2020 (the left half of the table). So don't get too excited about the S&P 500's tactically bullish backdrop.
Likewise, with more rate hikes poised to spoil the bulls' fun over the medium term, I warned on Sep. 15 that reality would prove problematic. I wrote:
While consensus expectations continue to move in a hawkish direction, the medium-term economic ramifications are far from priced in.
Please see below:
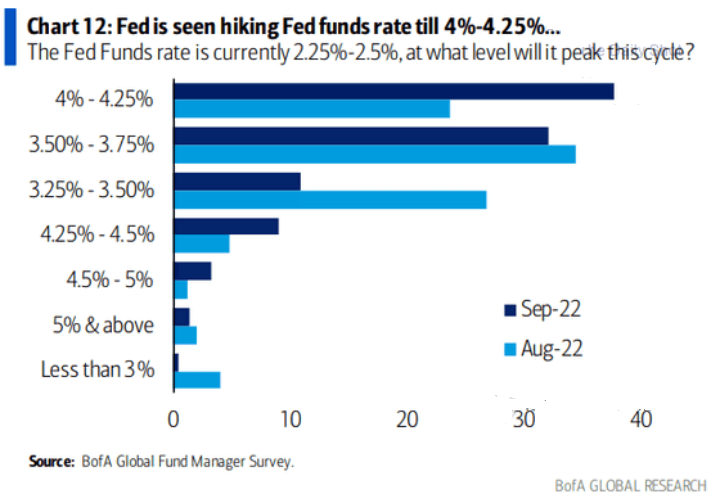
To explain, Bank of America’s latest FMS shows that most respondents expected the U.S. federal funds rate (FFR) to peak between 3.25% and 3.75% in August (the light blue bars). Conversely, September’s results show that the top spot is now in the 4% to 4.25% range (the dark blue bar).
As a result, what a difference a month makes. Yet, while rate hike expectations have moved materially higher, notice how the 4.5% to 5% and the 5% & above rows are in the major minority? In reality, these are the most likely outcomes. With an FFR in the 4.5% to 5.5% range needed to cool inflation, investors still underestimate the task at hand.
In addition, since it didn’t take long for the ~3.5% camp to jump to 4%+, don’t be surprised if these expectations ratchet higher in the months ahead.
To that point, with the crowd now seeing things from our perspective, a higher FFR is the worst-kept secret.
Please see below:
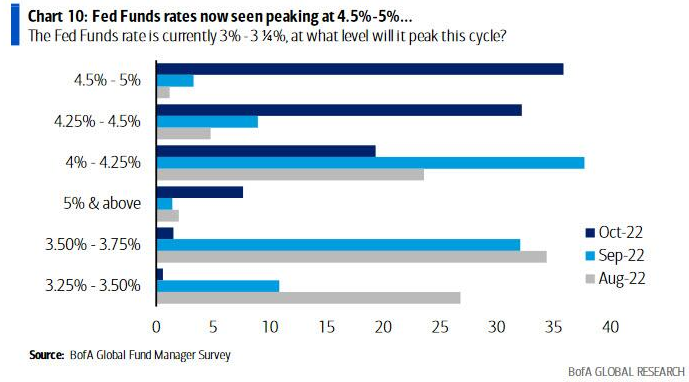
To explain, the dark blue bar at the top shows how the majority of respondents expect the FFR to peak between 4.5% and 5%. Thus, the result marks a profound shift in sentiment from August and September, and risk assets are unlikely to perform well if (when) the expectation becomes a reality.
The Bottom Line
While the S&P 500 may rally in the days ahead, gold, silver, and mining stocks don't have to participate. Moreover, with history showing that gold and the S&P 500 have diverged several times in recent years, it's not uncommon for the PMs to display weakness while the S&P 500 showcases strength.
In conclusion, the PMs were mixed on Oct. 18, as mining stocks closed in the green. However, the USD Index and the U.S. 10-Year real yield rose slightly, so the PMs' medium-term fundamentals didn't benefit; and while the S&P 500 may exhibit strength in the short term, it also faces immense obstacles in the months ahead. As such, lower lows should materialize for several assets before this bear market ends.
Overview of the Upcoming Part of the Decline
- It seems to me that the corrective upswing is over, and that the next big move lower is already underway.
- If we see a situation where miners slide in a meaningful and volatile way while silver doesn’t (it just declines moderately), I plan to – once again – switch from short positions in miners to short positions in silver. At this time, it’s too early to say at what price levels this could take place and if we get this kind of opportunity at all – perhaps with gold prices close to $1,600.
- I plan to switch from the short positions in junior mining stocks or silver (whichever I’ll have at that moment) to long positions in junior mining stocks when gold / mining stocks move to their 2020 lows (approximately). While I’m probably not going to write about it at this stage yet, this is when some investors might consider getting back in with their long-term investing capital (or perhaps 1/3 or 1/2 thereof).
- I plan to return to short positions in junior mining stocks after a rebound – and the rebound could take gold from about $1,450 to about $1,550, and it could take the GDXJ from about $20 to about $24.
- I plan to exit all remaining short positions once gold shows substantial strength relative to the USD Index while the latter is still rallying. This may be the case with gold prices close to $1,400 and GDXJ close to $15 . This moment (when gold performs very strongly against the rallying USD and miners are strong relative to gold after its substantial decline) is likely to be the best entry point for long-term investments, in my view. This can also happen with gold close to $1,400, but at the moment it’s too early to say with certainty.
- The above is based on the information available today, and it might change in the following days/weeks.
You will find my general overview of the outlook for gold on the chart below:
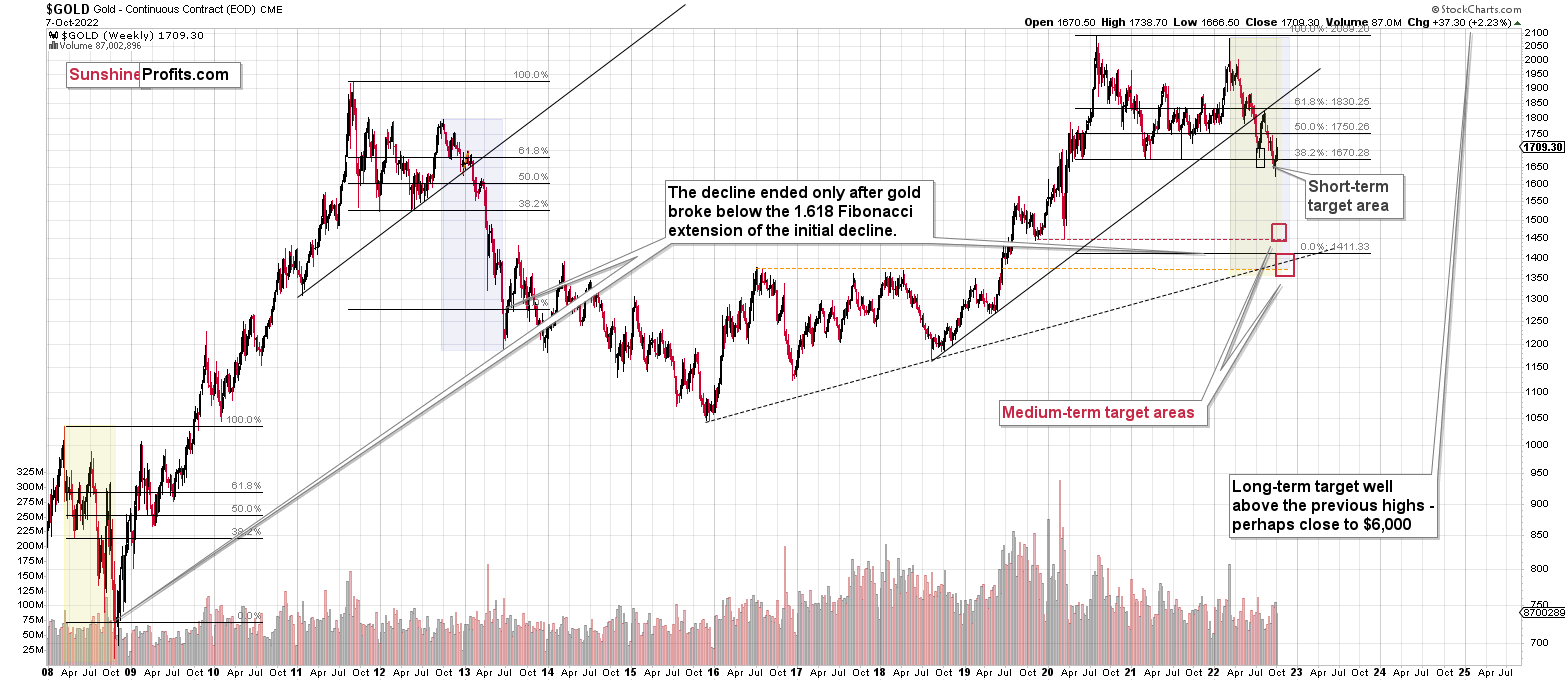
Please note that the above timing details are relatively broad and “for general overview only” – so that you know more or less what I think and how volatile I think the moves are likely to be – on an approximate basis. These time targets are not binding nor clear enough for me to think that they should be used for purchasing options, warrants, or similar instruments.
Letters to the Editor
Q: I’ve noted in the last couple of days that JDST has been down more than double the percentage change that JNUG has been up.
Yet both are double leveraged ETF’s based on junior gold stocks, I believe.
Is there a difference between the two funds to account for the variation?
Thx.
A: So far this week, the JNUG is down by 7.88% and the JNUG is up by 7.53%, so they moved in the opposite directions by more or less the same. They won’t align perfectly on each and every single day, and they won’t align in the long run, but that’s due to how they are constructed, and due to the possibility of large trades to temporarily impact the prices of individual instruments.
As far as long-term performance is concerned, they are both going down due to the way they are structured. They provide daily leverage in percentage terms that is then multiplied by 2, nothing more and nothing less. In the long run, if something declines by 30% and then comes up by 42.86%, it will be even (100% – 30%) x (100% + 42.86%) = ~1.
But if both moves are multiplied by 2, we get (100% - 60%) x (100% + 85.72%) = ~0.74288 (so, it loses a quarter of value).
And when you repeat this many times, the value drops significantly.
So, leveraged instruments, especially inverse ones (in long-term bull markets), are not good long-term investment proxies, but they can be useful for short-term and sometimes medium-term trades.
Q: I'm a believer in your assessment of the metals going lower in the near/medium future. My concern is that physical gold/silver have high premiums and are harder to find. It's counterintuitive to metal prices going down. Is there such a disconnect between metal futures and physical?
A: It might depend on the specific type of physical product that you’re looking for. But yes, the premium for physical bars/coins is likely to increase further if we see a volatile slide (and I think that’s likely). That’s what happened in 2013, too.
And no, it’s not a “proof of manipulation.” It’s simply a matter of dealers being not willing to immediately drop their prices as they have likely purchased their inventories at higher prices. It’s quite possible that at least some of them are not hedging their holdings, so it’s understandable that they don’t want to lose on their business.
This effect is temporary, and the premiums then tend to return to normal when the volatility drops. However, this time, I think that we could see a V-shaped bottom, so the volatility might not drop until it’s already after a major rebound.
That’s an additional reason for one to focus on purchasing mining stocks at the bottom and then moving to metals a bit later (say, in a few months after the bottom). The key reason is that history shows that miners tend to outperform at the beginning of a given big upswing.
Of course, that’s just my opinion, not investment advice.
Summary
Summing up, it seems that the biggest part of the 2013-like decline is taking place right now, and – while I can’t make any promises regarding performance - it seems likely to me that our big profits are about to become huge, and then ridiculously big in the relatively near future.
As far as this quick corrective upswing is concerned, it seems that it might already be over.
The current quick upswing most likely doesn’t change anything. Fundamentals and technicals continue to point to lower precious metals values in the coming weeks / months. The current geopolitical news-based rally is likely to serve as nothing more than just a verification of the breakdown below the previous lows in gold.
Things might happen very fast in the coming days, and if I plan to make any adjustments, I’ll keep you informed. Still, if the targets that I’m mentioning in the “Trading” part of the summary are reached, I think that profits should be taken off the table without an additional confirmation from me. I will probably get on the long side of the market at that time, but I’ll send a confirmation if I decide to do so.
After the final sell-off (that takes gold to about $1,350-$1,500), I expect the precious metals to rally significantly. The final part of the decline might take as little as 1-5 weeks, so it's important to stay alert to any changes.
As always, we'll keep you – our subscribers – informed.
To summarize:
Trading capital (supplementary part of the portfolio; our opinion): Full speculative short positions (300% of the full position) in junior mining stocks are justified from the risk to reward point of view with the following binding exit profit-take price levels:
Mining stocks (price levels for the GDXJ ETF): binding profit-take exit price: $20.32; stop-loss: none (the volatility is too big to justify a stop-loss order in case of this particular trade)
Alternatively, if one seeks leverage, we’re providing the binding profit-take levels for the JDST (2x leveraged). The binding profit-take level for the JDST: $27.87; stop-loss for the JDST: none (the volatility is too big to justify a SL order in case of this particular trade).
For-your-information targets (our opinion; we continue to think that mining stocks are the preferred way of taking advantage of the upcoming price move, but if for whatever reason one wants / has to use silver or gold for this trade, we are providing the details anyway.):
Silver futures downside profit-take exit price: $12.32
SLV profit-take exit price: $11.32
ZSL profit-take exit price: $74.87
Gold futures downside profit-take exit price: $1,504
HGD.TO – alternative (Canadian) 2x inverse leveraged gold stocks ETF – the upside profit-take exit price: $18.47
HZD.TO – alternative (Canadian) 2x inverse leveraged silver ETF – the upside profit-take exit price: $46.87
Long-term capital (core part of the portfolio; our opinion): No positions (in other words: cash)
Insurance capital (core part of the portfolio; our opinion): Full position
Whether you’ve already subscribed or not, we encourage you to find out how to make the most of our alerts and read our replies to the most common alert-and-gold-trading-related-questions.
Please note that we describe the situation for the day that the alert is posted in the trading section. In other words, if we are writing about a speculative position, it means that it is up-to-date on the day it was posted. We are also featuring the initial target prices to decide whether keeping a position on a given day is in tune with your approach (some moves are too small for medium-term traders, and some might appear too big for day-traders).
Additionally, you might want to read why our stop-loss orders are usually relatively far from the current price.
Please note that a full position doesn't mean using all of the capital for a given trade. You will find details on our thoughts on gold portfolio structuring in the Key Insights section on our website.
As a reminder - "initial target price" means exactly that - an "initial" one. It's not a price level at which we suggest closing positions. If this becomes the case (as it did in the previous trade), we will refer to these levels as levels of exit orders (exactly as we've done previously). Stop-loss levels, however, are naturally not "initial", but something that, in our opinion, might be entered as an order.
Since it is impossible to synchronize target prices and stop-loss levels for all the ETFs and ETNs with the main markets that we provide these levels for (gold, silver and mining stocks - the GDX ETF), the stop-loss levels and target prices for other ETNs and ETF (among other: UGL, GLL, AGQ, ZSL, NUGT, DUST, JNUG, JDST) are provided as supplementary, and not as "final". This means that if a stop-loss or a target level is reached for any of the "additional instruments" (GLL for instance), but not for the "main instrument" (gold in this case), we will view positions in both gold and GLL as still open and the stop-loss for GLL would have to be moved lower. On the other hand, if gold moves to a stop-loss level but GLL doesn't, then we will view both positions (in gold and GLL) as closed. In other words, since it's not possible to be 100% certain that each related instrument moves to a given level when the underlying instrument does, we can't provide levels that would be binding. The levels that we do provide are our best estimate of the levels that will correspond to the levels in the underlying assets, but it will be the underlying assets that one will need to focus on regarding the signs pointing to closing a given position or keeping it open. We might adjust the levels in the "additional instruments" without adjusting the levels in the "main instruments", which will simply mean that we have improved our estimation of these levels, not that we changed our outlook on the markets. We are already working on a tool that would update these levels daily for the most popular ETFs, ETNs and individual mining stocks.
Our preferred ways to invest in and to trade gold along with the reasoning can be found in the how to buy gold section. Furthermore, our preferred ETFs and ETNs can be found in our Gold & Silver ETF Ranking.
As a reminder, Gold & Silver Trading Alerts are posted before or on each trading day (we usually post them before the opening bell, but we don't promise doing that each day). If there's anything urgent, we will send you an additional small alert before posting the main one.
Thank you.
Przemyslaw K. Radomski, CFA
Founder, Editor-in-chief

