

Briefly: in our opinion, full (300% of the regular position size) speculative short positions in junior mining stocks are justified from the risk/reward point of view at the moment of publishing this Alert. Moreover, while I see very little chance of those levels behind hit, I’m adding stop-loss orders for our current short positions. Since I’m placing them below the entry levels, they are effectively profit-protect orders. In other words, we are locking-in part of the profits, while letting them grow even more.
Mining stocks moved higher on Friday, and you might be wondering if this was anything more than a daily breather – so let’s start today’s analysis with the GDXJ ETF.
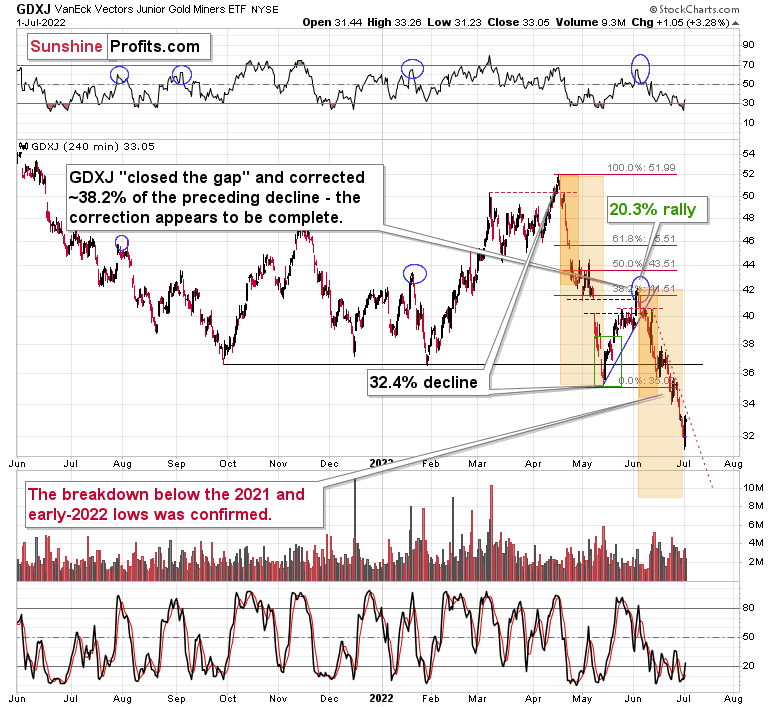
In short, so far, we haven’t seen a good indication that the rally is anything more than a normal daily rebound. Even the very sharp declining, red, dashed resistance line remains unbroken.
Consequently, the trend remains down.
Now, the bigger of the orange rectangles that you see on the above chart just ended, which means that, based on the time analogy to the April-May decline, we might see a bigger corrective upswing shortly. However, it’s not very likely that this is going to be the case. The reason is that this time the decline was visibly smaller than it was before, and thus the GDXJ is not as severely oversold.
Additionally, there are good reasons (like the situation in the USD Index) to think that the precious metals sector is about to move much lower instead of rallying. I covered many of them in Friday’s flagship Gold & Silver Trading Alert.
So, won’t there be any corrective upswing this time? Well, based on Friday’s 3% upswing, it’s obvious that we already saw one, and based on the following chart, it seems that even seeing an additional small upswing would be a part of a bigger bearish pattern.
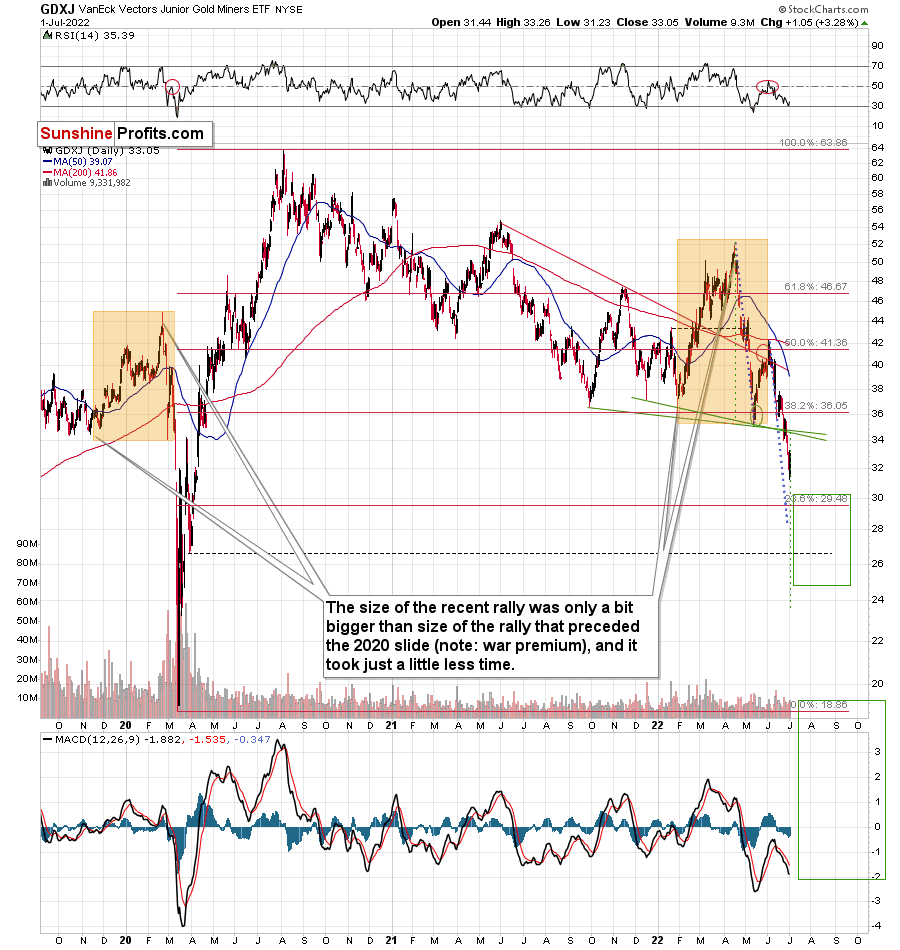
The GDXJ is after a breakdown below the head and shoulders formation, which is a very bearish fact for the following weeks. However, on a very short-term basis, it’s important to remember that breakdowns below those formations tend to be followed by a corrective rally back (or almost back) to the previously broken neck level.
That’s exactly what we saw on Friday, and if we see a move even closer to the neck level, it won’t make the situation bullish – it’s all part of a big, bearish pattern with a downside target slightly below $24.
Moreover, please keep in mind that despite Friday’s small upswing, the GDXJ just closed the week at the lowest level since the first half of 2020.
Amazingly bearish, isn’t it? So much money has been printed in the last 2 years, and there’s a war in Europe, yet junior miners are trading at lower levels.
Speaking of weakness and major breakdowns, here’s what silver did recently.
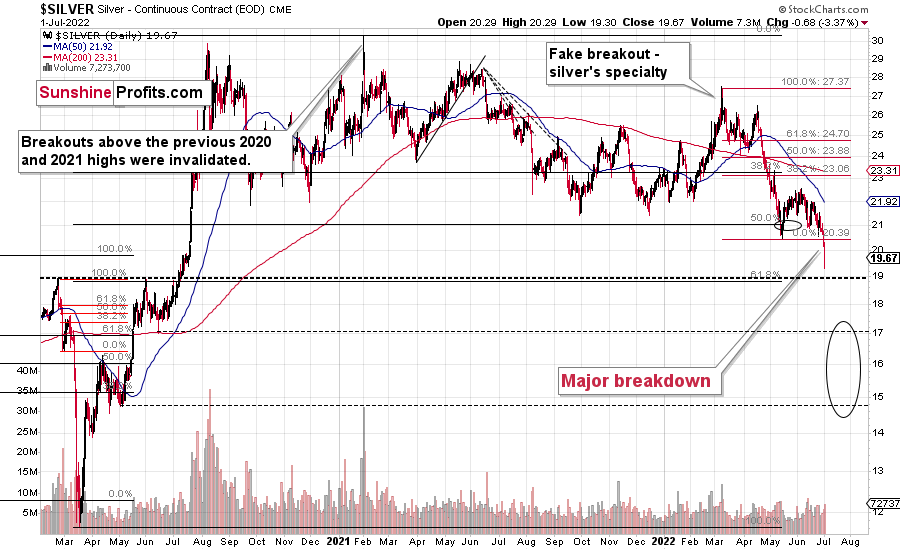
The white metal corrected part of its decline, but it still ended $0.68 lower on Friday, which was the lowest daily and weekly close since mid-2020. This is profoundly bearish.
Remember when everyone and their brother thought that silver was about to soar to the moon in early 2021? When (with silver close to $30) I warned that while I agree that it’s eventually likely to do it, it’s very unlikely to happen without a bigger decline first?
While silver might correct this breakdown and move back to $20.5 or so, it’s quite likely that the breakdown will hold.
The real bearish fireworks are likely to start once gold breaks below its own head and shoulders pattern, though.
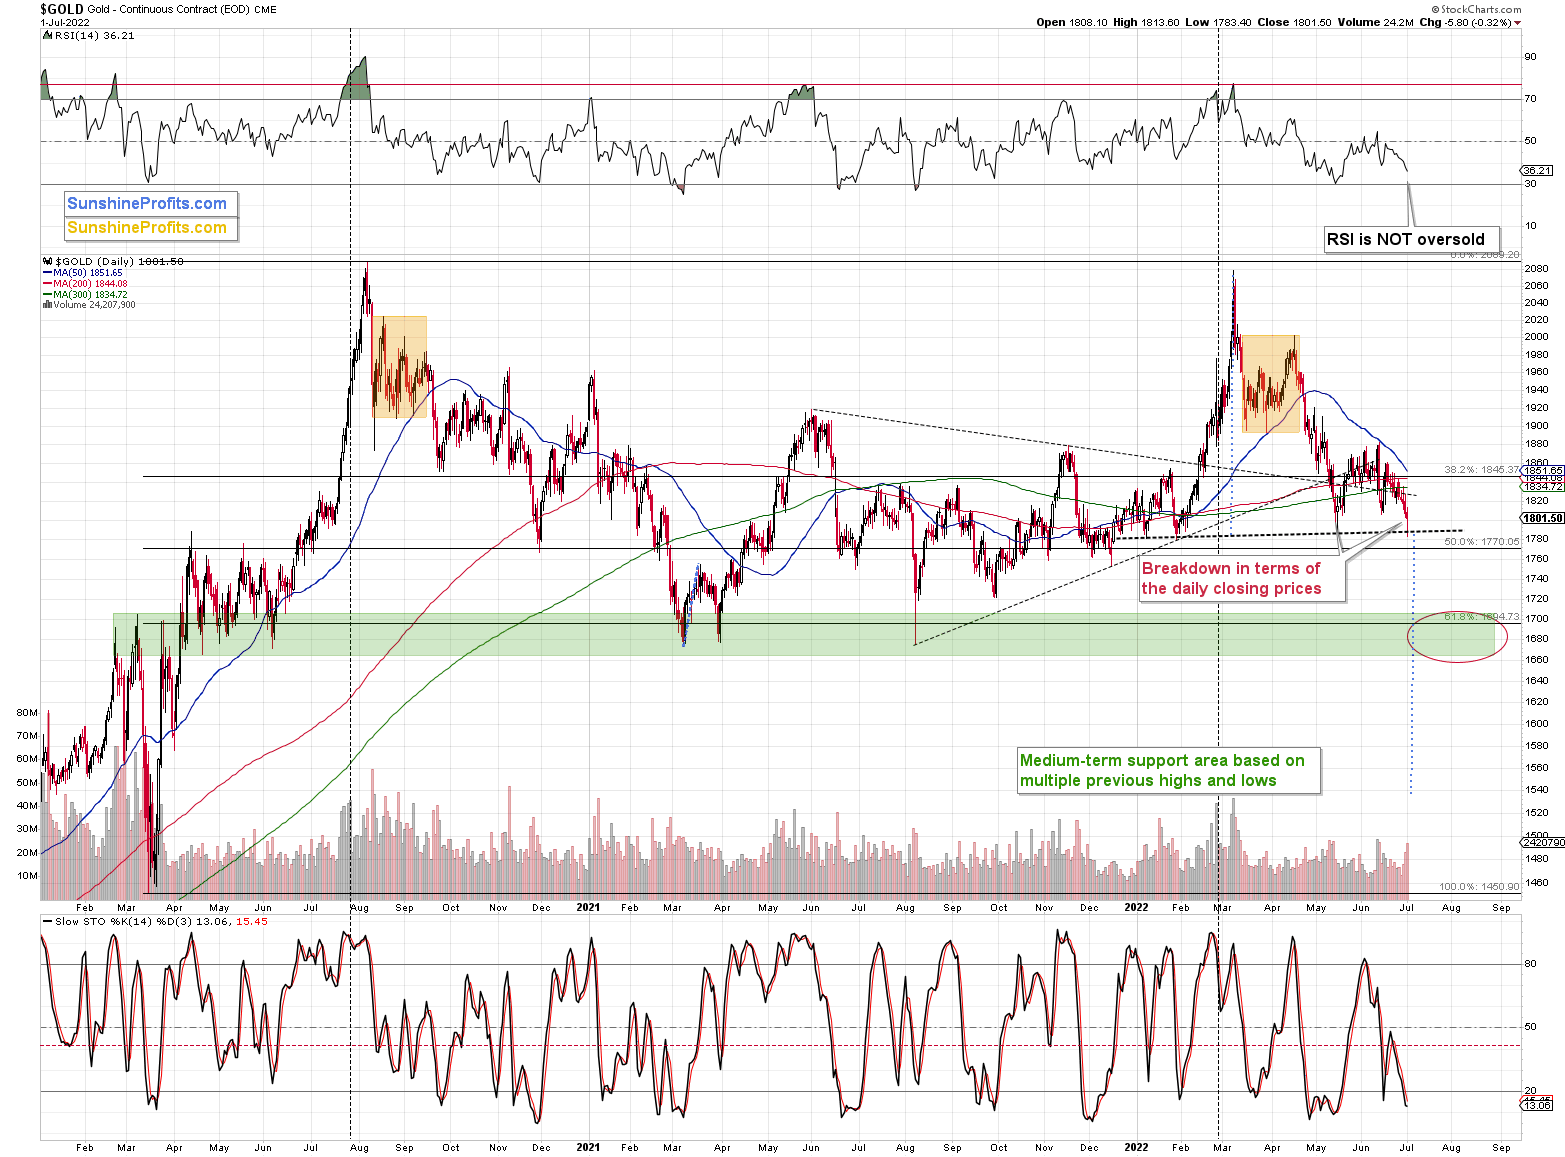
Gold touched the neck level based on the previous lows on Friday (July 1), but it didn’t break below it. Once it does, it’s likely to fall significantly. The target based on the formation is about $1,540. However, since we have a strong support area close to the 2021 lows, I think that seeing an interim bottom close to them is a likely outcome.
If only there was some kind of trigger that could push gold prices lower and make them complete the H&S formation.
Oh wait, there is one – a major one.
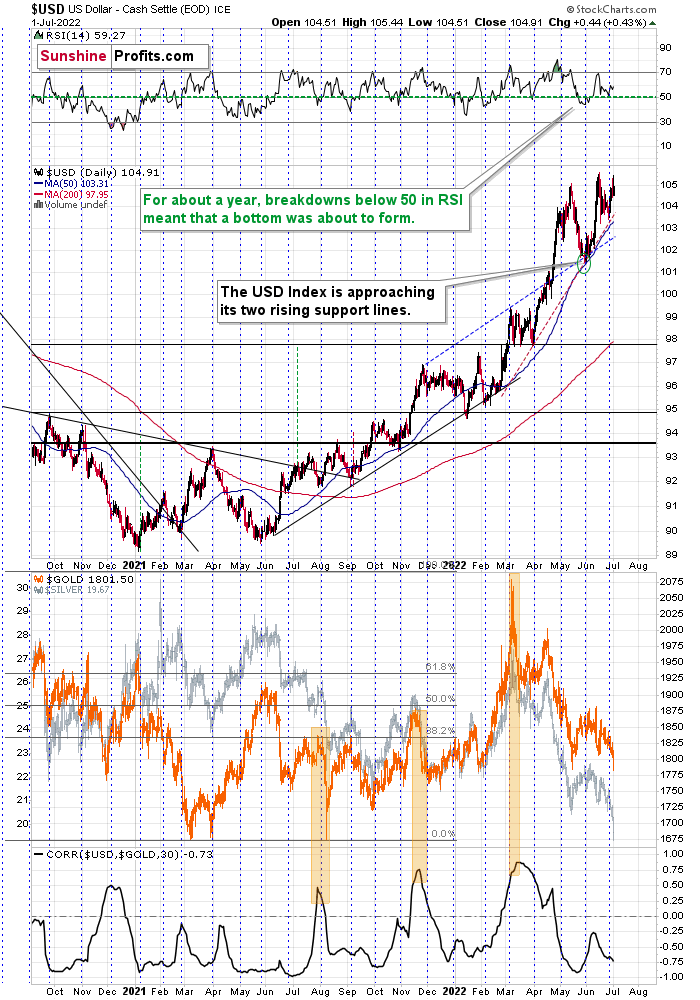
The USD Index is trading very close to the 105 level, and while it didn’t manage to break to new highs on Friday, its persistence is quite clear. It only has to confirm the breakout once for the bullish floodgates to be opened.
Given the rising real interest rates in the U.S. that are rising at a faster pace than the ones in the Eurozone, it seems that the USDX will continue to move to higher levels in the following weeks and months.
Therefore, it seems that the breakout and its confirmation are just a matter of time, and given that the corrective downswings after the attempts to break above the 105 level are getting smaller and smaller, it’s likely that we won’t have to wait too long for the USDX to show this material strength.
This, in turn, means that gold would be likely to break below its head and shoulders pattern, and junior miners would be likely to continue their massive slide after a brief correction. While I can’t promise any kind of performance, it seems that the profits on our short positions in junior miners are likely to increase even more.
Naturally, as always, I’ll keep you – my subscribers – informed.
Having said that, let’s take a look at the markets from a more fundamental point of view.
Catch-22
With the Fed struggling to walk a tightrope between high inflation and low growth, the diverging paths make monetary policy destined to fail. However, with a recession induced by rate hikes preferable to a hyperinflationary collapse, the Fed should forge ahead with rate hikes during the second half of 2022.
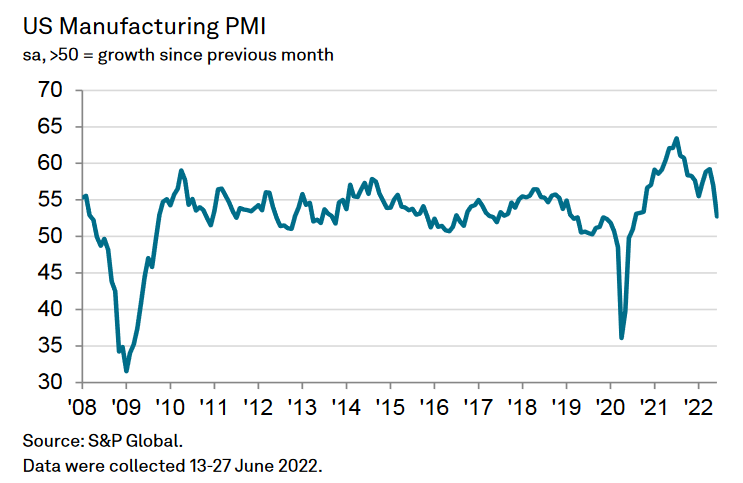
For example, S&P Global released its U.S. Manufacturing PMI on Jul. 1. The headline index decreased from 57.0 in May to 52.7 in June. Chris Williamson, Chief Business Economist at S&P Global Market Intelligence, said:
“The PMI survey has fallen in June to a level indicative of the manufacturing sector acting as a drag on GDP, with that drag set to intensify as we move through the summer. Forward-looking indicators such as business expectations, new order inflows, backlogs of work and purchasing of inputs have all deteriorated markedly to suggest an increased risk of an industrial downturn.”
Please see below:
However, with the Fed’s dual mandate headlined by price stability and maximum employment, the report was still bullish for hawkish policy. For example:
“Firms expanded their workforce numbers further in June. Hiring activity reportedly stemmed from efforts to clear backlogs of work and the filling of long-held vacancies. As a result, pressure on capacity eased and the level of work-in-hand was broadly unchanged on the month, a stark contrast to the sharp expansion seen in May.”
More importantly:
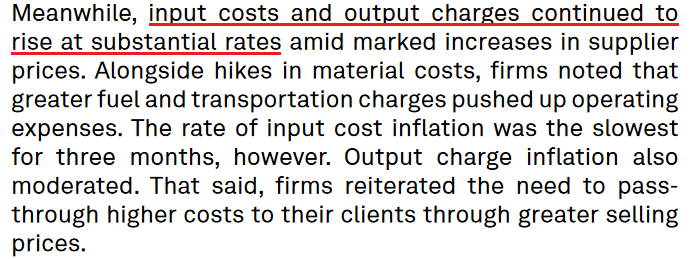 Source: S&P Global
Thus, while growth has suffered amid the Fed’s rate hike barrage, inflation remains problematic. Moreover, with employment still resilient, the Fed should keep its foot on the hawkish accelerator.
To that point, the Institute for Supply Management (ISM) released its U.S. Manufacturing PMI on Jun. 1. The headline index decreased from 56.1 in May to 53 in June. The report revealed:
“The ISM Prices Index registered 78.5 percent, 3.7 percentage points lower compared to the May reading of 82.2 percent, indicating raw materials prices increased for the 25th consecutive month, at a slower rate in June. The Prices Index has exceeded 70 percent in 18 out of the last 19 months and been above 60 percent for 22 straight months.”
As such, the important point is that inflation is still increasing month-over-month (MoM). For the Fed to achieve its goal, inflation needs to decline MoM or at least flatline to reduce the year-over-year (YoY) figure to an acceptable level. Thus, further rate hikes are required to achieve the objective, and a realization is profoundly bearish for the S&P 500 and the PMs.
O Canada
With the Bank of Canada (BoC) holding its next monetary policy meeting on Jul. 13, the central bank moves in advance of the Fed. Moreover, with the pair’s interest rate decisions often intertwined, I warned on Apr. 14 that the BoC is the canary in the coal mine for future Fed policy. I wrote:
The BoC announced a 50 basis point rate hike on Apr. 13. With the Fed likely to follow suit in May, the domestic fundamental environment confronting the PMs couldn’t be more bearish.
Moreover, BoC Governor Tiff Macklem (Canada's Jerome Powell) said that "We are committed to using our policy interest rate to return inflation to target and will do so forcefully if needed."
Furthermore, while he added that the BoC could "pause our tightening" if inflation subsides, he cautioned that "we may need to take rates modestly above neutral for a period to bring demand and supply back into balance and inflation back to target."
However, with the latter much more likely than the former, the BoC's decision is likely a preview of what the Fed should deliver in the months ahead.
To that point, with the BoC and the Fed relatively aligned, the data out of Canada supports continued rate hikes in the months ahead. For example, Statistics Canada released its Survey of Employment, Payrolls and Hours (SEPH) on Jun. 24. An excerpt read:
“In April, for the first time, payroll employment in all provinces had either returned to or surpassed levels seen in February 2020, prior to the COVID-19 pandemic. (…) All provinces had eased public health measures around capacity limits, allowing most businesses to operate without pandemic-related restrictions.”
In addition:
“Across all sectors, employers in Canada were actively seeking to fill about one million (1,001,100) vacant positions at the beginning of April, up 2.4% (+23,300) from the previous month and up 44.4% (+308,000) from April 2021 (not seasonally adjusted).”
As a result, the combination of unanchored inflation and record job openings is extremely bullish for North American monetary policy.
Please see below:
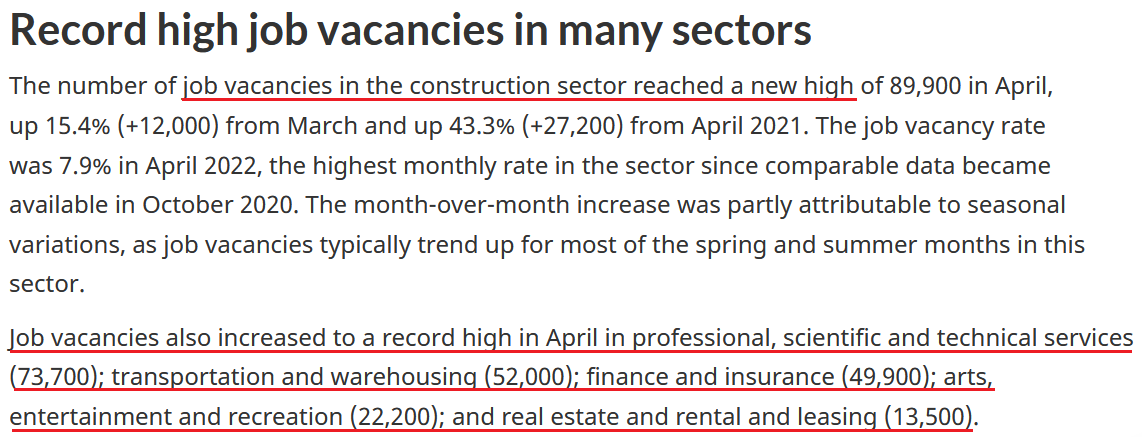 Source: Statistics Canada
Likewise, while real growth has suffered in recent weeks, nominal spending remains resilient. For context, real metrics subtract the inflation rate to eliminate the impact of price increases. However, with inflation at levels unseen since the 1970s/1780s, it skews the data in a negative direction.
In a nutshell: if inflation was 2% and North American consumers were spending at the current rate, real metrics would be much higher. As a result, the demand side of the equation is much more resilient than it’s portrayed. To explain, I wrote on Dec. 23 and updated on Jun. 9:
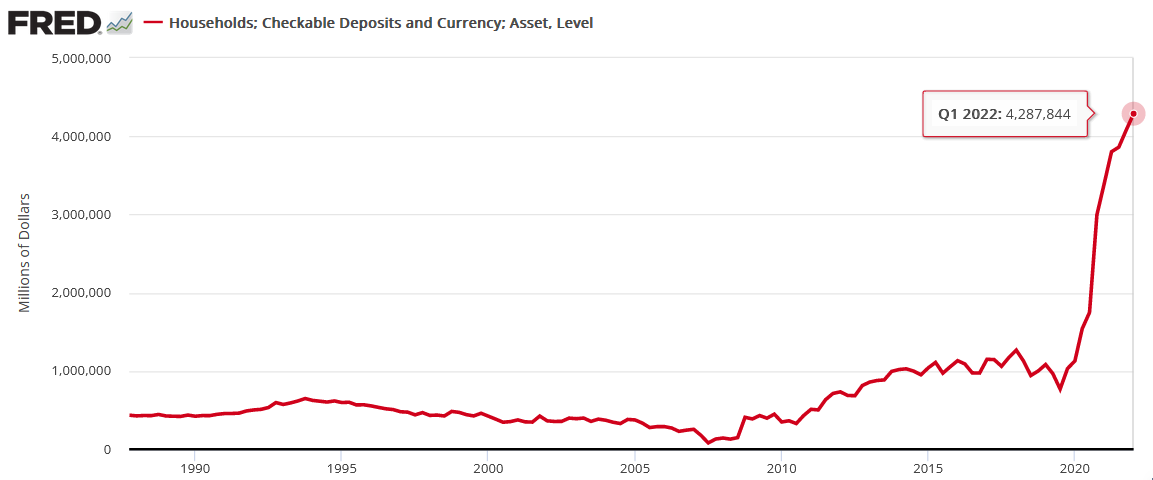
While the fiscal spending spree may end, U.S. households are flush with cash. U.S. households have nearly $3.54 trillion in their checking accounts. For context, this is 253% more than Q4 2019 (pre-COVID-19) (…).
While some investors expect a dovish 180 from the Fed, they shouldn’t hold their breath. With U.S. economic growth still resilient and the U.S. consumer in much better shape than some portray, the Fed can raise interest rates without crashing the U.S. economy. As a result, Powell will likely stick to his hawkish script and forge ahead with rate hikes in 2022.
Therefore, while the prediction proved prescient, U.S. households, on aggregate, are still flush with cash. For example, the Fed released its Financial Accounts of the United States report on Jun. 9. It revealed that U.S. households have nearly $4.288 trillion in their checking accounts as of the end of Q1. Moreover, the figure is 5.1% higher than Q4:2021.
Please see below:
Likewise, data from the Royal Bank of Canada (RBC) – the fifth-largest bank in North America – shows that debit and credit card spending continues to accelerate.
Please see below:
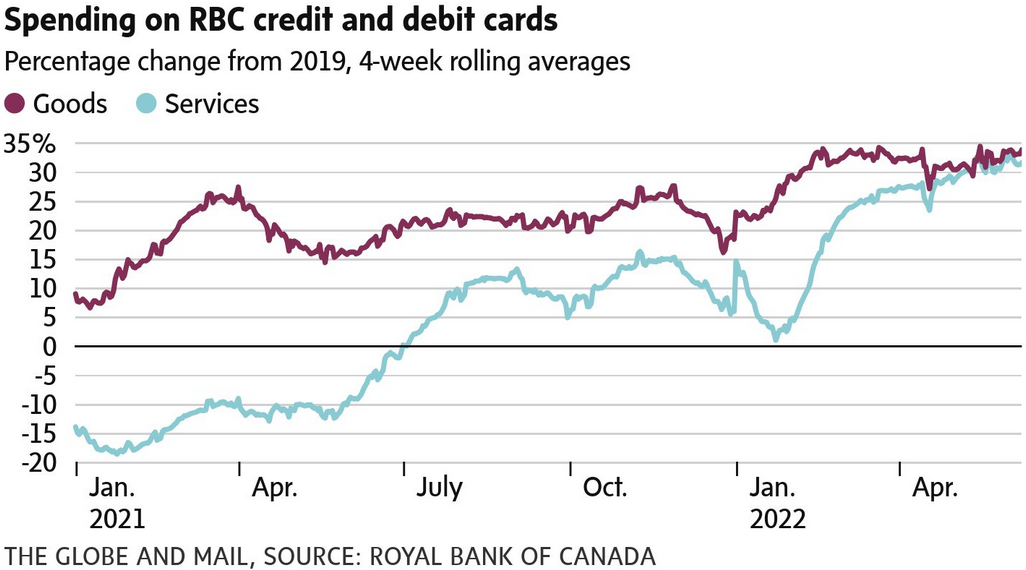
To explain, the purple and blue lines above track the rolling four-week average percentage change in Canadians’ debit and credit card purchases relative to 2019. If you analyze the right side of the chart, you can see that consumers have increased their spending habits. As a result, their willingness to splurge should keep inflation elevated and keep the BoC and the Fed on a hawkish warpath.
Furthermore, with pandemic outlays on electronics now shifting to services and fashion, the end of the pandemic has consumers prioritizing in-person activities. Moreover, with the summer months upon us, the warmer weather supports a continued trend until the end of September.
Please see below:
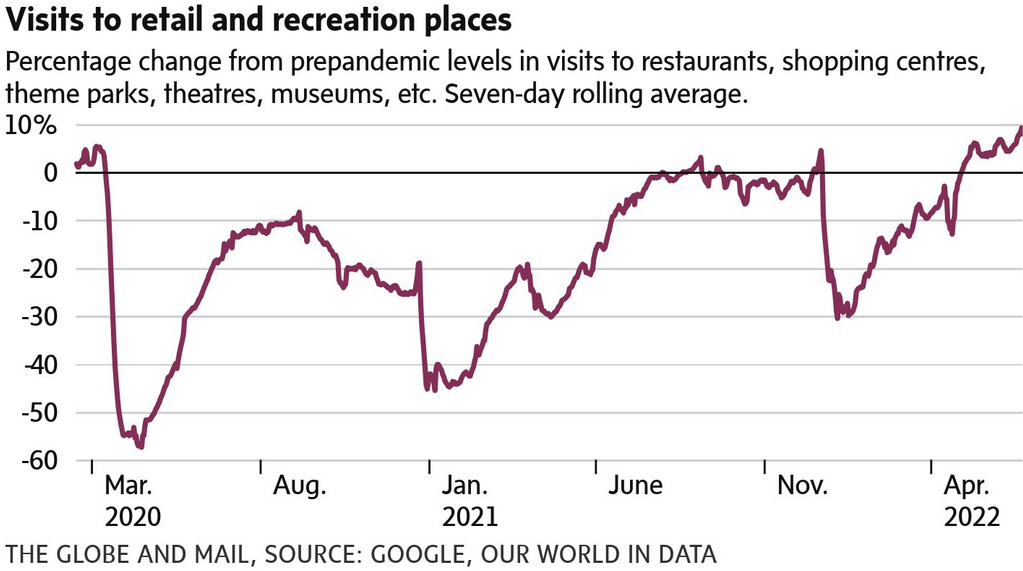
To explain, the purple line above tracks the percentage change in Canadians’ visits to retail and recreation venues relative to the pre-pandemic baseline. If you analyze the right side of the chart, you can see that pandemic fears have abated and Canadians have resumed their normal lives. As such, the data also supports elevated inflation.
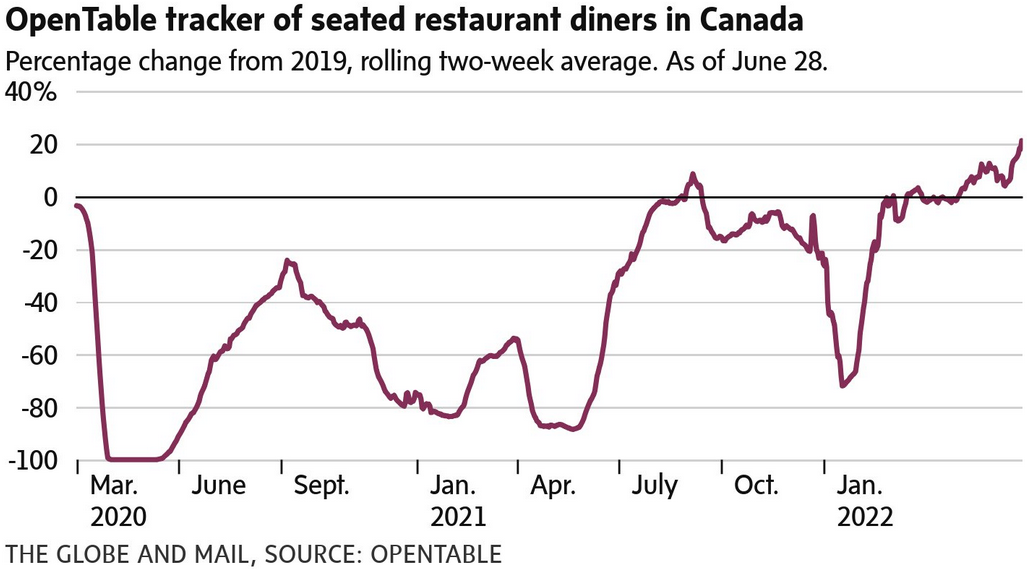
Furthermore, data from OpenTable – an online restaurant-reservation service – shows that in-person dining at Canadian restaurants has surpassed its pre-pandemic baseline. As a result, inflation is unlikely to decline materially as long as these metrics are present.
In addition, S&P Global released its Canada Manufacturing PMI on Jul. 4. Moreover, with consumers’ attention shifting from goods to services, the results were similar to the U.S. PMI. For example, the headline index declined from 56.8 in May to 54.6 in June. However, employment remained resilient. The report revealed:
“Faced with increasing orders, firms in Canada raised their headcounts. The rate of growth was solid, but softer than that seen in May, and the joint-weakest for nine-months.”
More importantly:
 Source: S&P Global
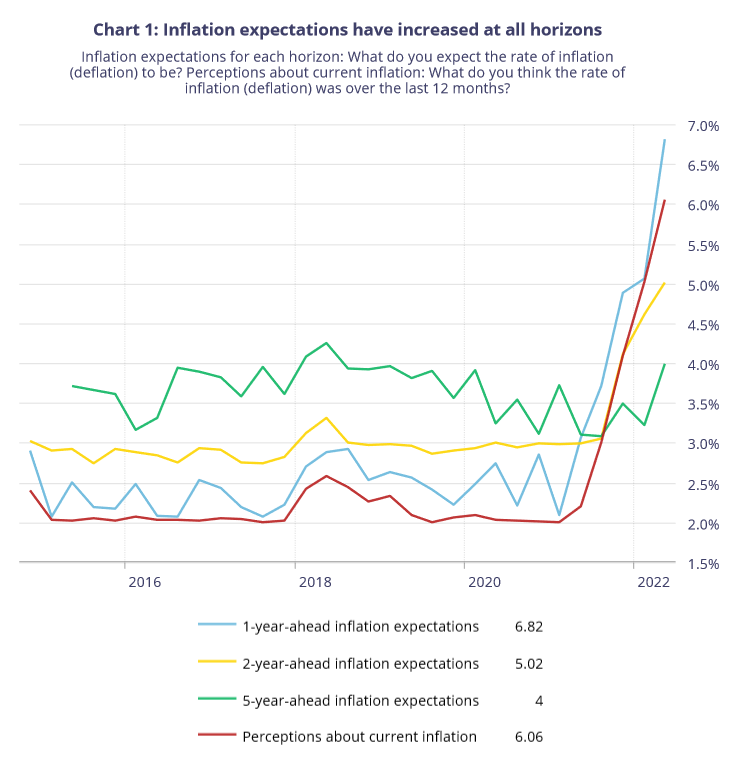
Finally, the BoC released its Survey of Consumer Expectations on Jul. 4. The report revealed:
“Consumers’ expectations for inflation have risen, alongside concerns about prices for food, gas and rent. Short-term expectations are at record-high levels. Long-term inflation expectations increased significantly in the second quarter of 2022, returning to the levels they were at before the COVID‑19 pandemic.”
As a result, Canadians’ inflation expectations are nowhere near “anchored,” and the North American story continues to converge.
 Source: BoC
The Bottom Line
While growth has suffered mightily in recent weeks, robust inflation and resilient employment have the Fed and the BoC confronting a material conundrum. However, with supporting growth likely to end in a hyperinflationary collapse, central bankers realize that a recession that kills inflation is the lesser of two evils.
Moreover, the USD Index and real interest rates are the primary beneficiaries of hawkish central bank policies. Thus, the PMs’ main fundamental adversaries have the wind at their backs, and the dynamic is profoundly bearish for gold, silver, and mining stocks.
In conclusion, the PMs were mixed on Jul. 1, as the miners participated in the S&P 500’s relief rally. However, with little progress made in their inflation fight, the Fed and the BoC should maintain their hawkish stances in the months ahead. As a result, a final sell-off should materialize before long-term buying opportunities emerge.
Overview of the Upcoming Part of the Decline
- It seems to me that the precious metals market is already in its medium-term decline that is about to take it much lower (to the 2021 lows in case of gold - $1,650 - $1,700)
- If we see a situation where miners slide in a meaningful and volatile way while silver doesn’t (it just declines moderately), I plan to – once again – switch from short positions in miners to short positions in silver. At this time, it’s too early to say at what price levels this could take place and if we get this kind of opportunity at all – perhaps with gold prices close to $1,600.
- If we see a situation where miners slide in a meaningful and volatile way while silver doesn’t (it just declines moderately), I plan to – once again – switch from short positions in miners to short positions in silver. At this time, it’s too early to say at what price levels this could take place and if we get this kind of opportunity at all – perhaps with gold prices close to $1,600.
- I plan to exit all remaining short positions once gold shows substantial strength relative to the USD Index while the latter is still rallying. This may be the case with gold close to $1,400. I expect silver to fall the hardest in the final part of the move. This moment (when gold performs very strongly against the rallying USD and miners are strong relative to gold after its substantial decline) is likely to be the best entry point for long-term investments, in my view. This can also happen with gold close to $1,400, but at the moment it’s too early to say with certainty.
- The above is based on the information available today, and it might change in the following days/weeks.
You will find my general overview of the outlook for gold on the chart below:
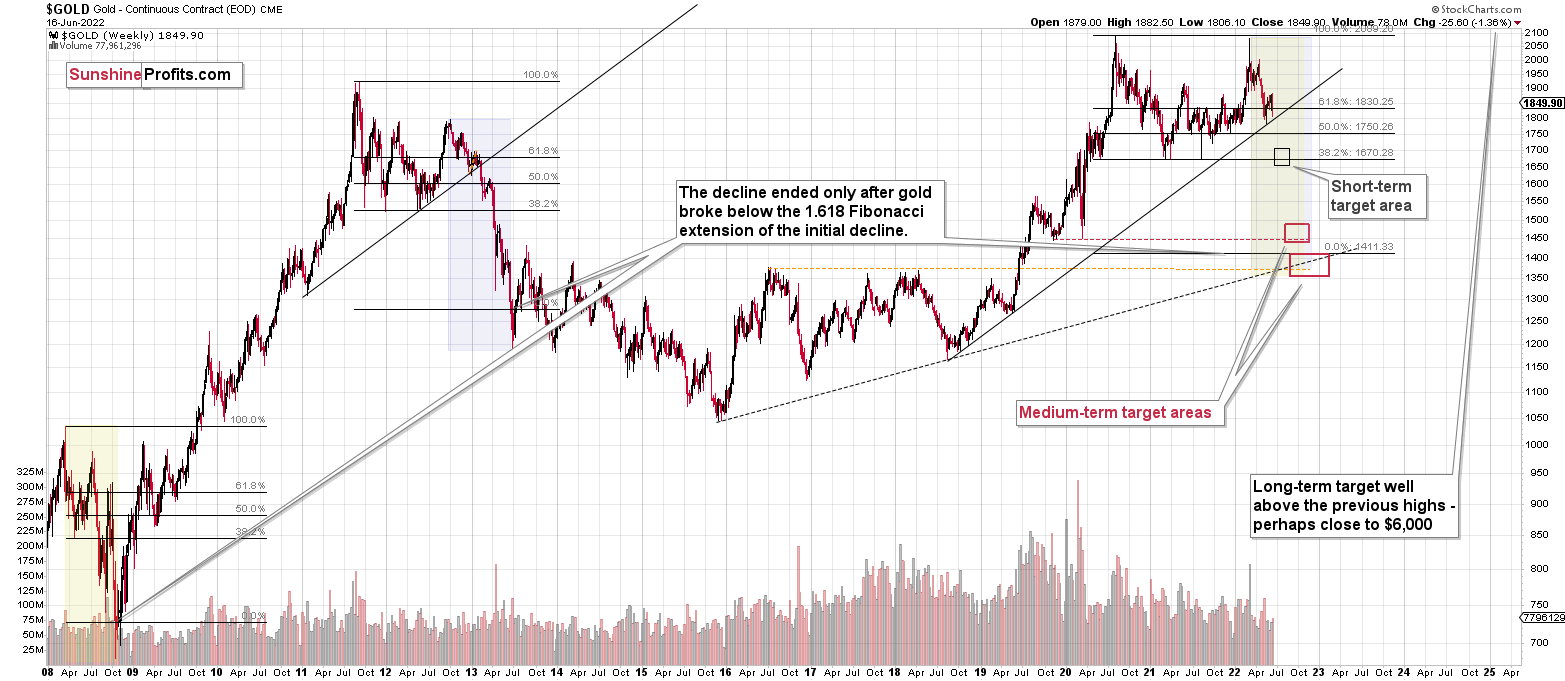
Please note that the above timing details are relatively broad and “for general overview only” – so that you know more or less what I think and how volatile I think the moves are likely to be – on an approximate basis. These time targets are not binding or clear enough for me to think that they should be used for purchasing options, warrants, or similar instruments.
Letters to the Editor
Q: This session is pretty weird. The SPX is down, gold is down, the USD is up, and the GDXJ is up. Is this one of those times when miners are in the lead? How does anyone predict that with no pointers to show where it is headed?
A: It seems to me that since miners have declined so significantly recently, they are simply correcting this decline – nothing more than that. A single session doesn’t have to indicate anything, and if it’s after a massive move in any way, then a breather (correction) is a completely normal phenomenon.
I wouldn’t say that there are “no pointers to show where it is headed” – as you can read in my analyses, especially the big, flagship ones, there are myriads of signs, and those coming from the long-term charts are not going to change based on a daily correction. In fact, that’s why the broader the scope, the more reliable the indications are. Very short-term and short-term indications are often misleading as relatively random events can impact price moves without changing the outlook as they are just temporary. However, medium- and long-term charts often show trends and shifts that have important meaning and that won’t be reversed “randomly”.
Q: It looks like we have an outside reversal day. This could spell trouble for your forecast. Any thoughts?
A: It could, or it could not. Is every counter-trend move the beginning of a big rally? No. There have to be some smaller breathers, and there will be. During the volatile 2008 slide, there were quite a few daily corrections, but none of them prevented gold stocks’ profound decline.
So, it’s a matter of asking a different question – does the way mining stocks rallied recently indicate anything more than a regular, normal breather? I don’t see any signs of that, so I don’t see a reason to think that the outlook has changed – in my view, it remains extremely bearish for the next weeks and months (please note that I’m not making any day-to-day predictions here).
Q: Question in Friday’s JDST market. Silver is down around 41, but the JDST is also down 85. I thought this was an inverse trade in which if silver is down, the JDST is up. Please explain the divergence.
A: The JDST is an inverse (2x leveraged) proxy for gold and silver junior (mostly) mining stocks, not for silver. There is a significant correlation between silver prices and junior mining stock prices, but ultimately it’s not the same market. While the medium-term moves are very likely to be aligned, there can be – and will be – some differences on a day-to-day basis.
On Friday, silver ended lower, while mining stocks ended higher. That’s likely a result of the fact that junior miners were so weak in the prior days that they already had to correct and silver was still in the decline mode. In my view, it doesn’t change anything with regard to the outlook for the next few weeks, which remains extremely bearish.
Summary
Summing up, it seems to me that the short-term rally in the precious metals market is over, and the decline will now continue. And the tiny correction’s days are likely numbered, too.
I previously wrote that the profits from the previous long position (congratulations once again) were likely to further enhance the profits on this huge decline, and that’s exactly what happened. The profit potential with regard to the upcoming gargantuan decline remains huge.
As investors are starting to wake up to reality, the precious metals sector (particularly junior mining stocks) is declining sharply. Here are the key aspects of the reality that market participants have ignored:
- rising real interest rates,
- rising USD Index values.
Both of the aforementioned are the two most important fundamental drivers of the gold price. Since neither the USD Index nor real interest rates are likely to stop rising anytime soon (especially now that inflation has become highly political), the gold price is likely to fall sooner or later. Given the analogy to 2012 in gold, silver, and mining stocks, “sooner” is the more likely outcome.
After the final sell-off (that takes gold to about $1,350-$1,500), I expect the precious metals to rally significantly. The final part of the decline might take as little as 1-5 weeks, so it's important to stay alert to any changes.
As always, we'll keep you – our subscribers – informed.
To summarize:
Trading capital (supplementary part of the portfolio; our opinion): Full speculative short positions (300% of the full position) in junior mining stocks are justified from the risk to reward point of view with the following binding exit profit-take price levels:
Mining stocks (price levels for the GDXJ ETF): binding profit-take exit price: $27.32; stop-loss: $38.33
Alternatively, if one seeks leverage, we’re providing the binding profit-take levels for the JDST (2x leveraged). The binding profit-take level for the JDST: $18.35; stop-loss for the JDST: $10.28
For-your-information targets (our opinion; we continue to think that mining stocks are the preferred way of taking advantage of the upcoming price move, but if for whatever reason one wants / has to use silver or gold for this trade, we are providing the details anyway.):
Silver futures downside profit-take exit price: $17.22; stop-loss: $23.22
SLV profit-take exit price: $16.22; stop-loss: $21.22
ZSL profit-take exit price: $41.47; stop-loss: $25.44
Gold futures downside profit-take exit price: $1,706; stop-loss: $1,911
HGD.TO – alternative (Canadian) 2x inverse leveraged gold stocks ETF – the upside profit-take exit price: $11.87; stop-loss: $7.17
HZD.TO – alternative (Canadian) 2x inverse leveraged silver ETF – the upside profit-take exit price: $31.87; stop-loss: $19.88
Long-term capital (core part of the portfolio; our opinion): No positions (in other words: cash)
Insurance capital (core part of the portfolio; our opinion): Full position
Whether you’ve already subscribed or not, we encourage you to find out how to make the most of our alerts and read our replies to the most common alert-and-gold-trading-related-questions.
Please note that we describe the situation for the day that the alert is posted in the trading section. In other words, if we are writing about a speculative position, it means that it is up-to-date on the day it was posted. We are also featuring the initial target prices to decide whether keeping a position on a given day is in tune with your approach (some moves are too small for medium-term traders, and some might appear too big for day-traders).
Additionally, you might want to read why our stop-loss orders are usually relatively far from the current price.
Please note that a full position doesn't mean using all of the capital for a given trade. You will find details on our thoughts on gold portfolio structuring in the Key Insights section on our website.
As a reminder - "initial target price" means exactly that - an "initial" one. It's not a price level at which we suggest closing positions. If this becomes the case (as it did in the previous trade), we will refer to these levels as levels of exit orders (exactly as we've done previously). Stop-loss levels, however, are naturally not "initial", but something that, in our opinion, might be entered as an order.
Since it is impossible to synchronize target prices and stop-loss levels for all the ETFs and ETNs with the main markets that we provide these levels for (gold, silver and mining stocks - the GDX ETF), the stop-loss levels and target prices for other ETNs and ETF (among other: UGL, GLL, AGQ, ZSL, NUGT, DUST, JNUG, JDST) are provided as supplementary, and not as "final". This means that if a stop-loss or a target level is reached for any of the "additional instruments" (GLL for instance), but not for the "main instrument" (gold in this case), we will view positions in both gold and GLL as still open and the stop-loss for GLL would have to be moved lower. On the other hand, if gold moves to a stop-loss level but GLL doesn't, then we will view both positions (in gold and GLL) as closed. In other words, since it's not possible to be 100% certain that each related instrument moves to a given level when the underlying instrument does, we can't provide levels that would be binding. The levels that we do provide are our best estimate of the levels that will correspond to the levels in the underlying assets, but it will be the underlying assets that one will need to focus on regarding the signs pointing to closing a given position or keeping it open. We might adjust the levels in the "additional instruments" without adjusting the levels in the "main instruments", which will simply mean that we have improved our estimation of these levels, not that we changed our outlook on the markets. We are already working on a tool that would update these levels daily for the most popular ETFs, ETNs and individual mining stocks.
Our preferred ways to invest in and to trade gold along with the reasoning can be found in the how to buy gold section. Furthermore, our preferred ETFs and ETNs can be found in our Gold & Silver ETF Ranking.
As a reminder, Gold & Silver Trading Alerts are posted before or on each trading day (we usually post them before the opening bell, but we don't promise doing that each day). If there's anything urgent, we will send you an additional small alert before posting the main one.
Thank you.
Przemyslaw Radomski, CFA
Founder, Editor-in-chief

