

Briefly: in our opinion, full (300% of the regular position size) speculative short positions in junior mining stocks are justified from the risk/reward point of view at the moment of publishing this Alert.
In yesterday’s analysis, I wrote the following right below the USD Index charts:
This move is in tune with what we saw at previous local bottoms. The RSI moved slightly below 50, and it’s the turn of the month – this combination was enough to trigger rallies in the U.S. dollar index.
Let’s keep in mind that the latter tends to form important bottoms close to the middle of the year.
So, the scenario in which the USD Index bottoms shortly (or that it just bottomed) seems quite likely.
There’s also the possibility that the USD Index keeps declining until it reaches the very strong support at about the 104 level – the previous long-term highs. Right now, it’s at about 105.5, which means that it could decline by another 1.5 index points or so. It doesn’t necessarily mean that gold, silver, and mining stocks would need to rally substantially if the above materialized. Conversely, since gold might now be reluctant to react to the USD’s lead and miners might be reluctant to react to gold’s lead, it seems that the possible upside for junior miners is very limited.
In other words, even if the big decline really picks up in a few weeks, I think that the risk-to-reward ratio already favors being on the short side of the precious metals sector. In particular, on the short side of the junior mining stocks.
That’s exactly what happened.
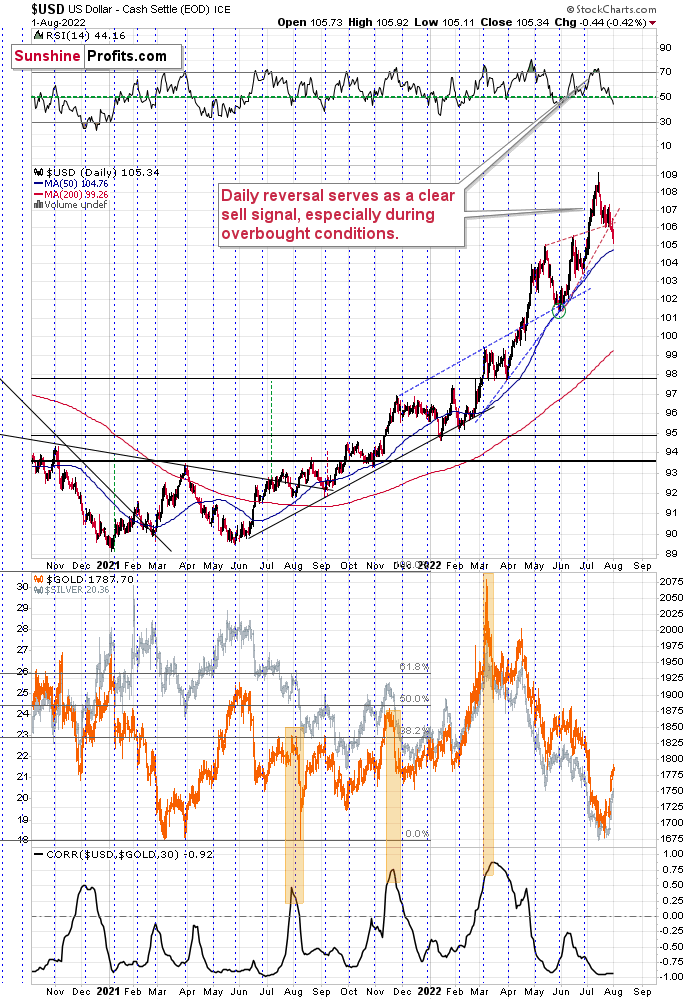
The USD Index declined quite visibly yesterday, almost reaching its 50-day moving average – and this average has been serving as reliable support for more than a year now.
While the USDX moved lower in a visible manner, gold didn’t move higher in a particularly meaningful way, and neither did silver.
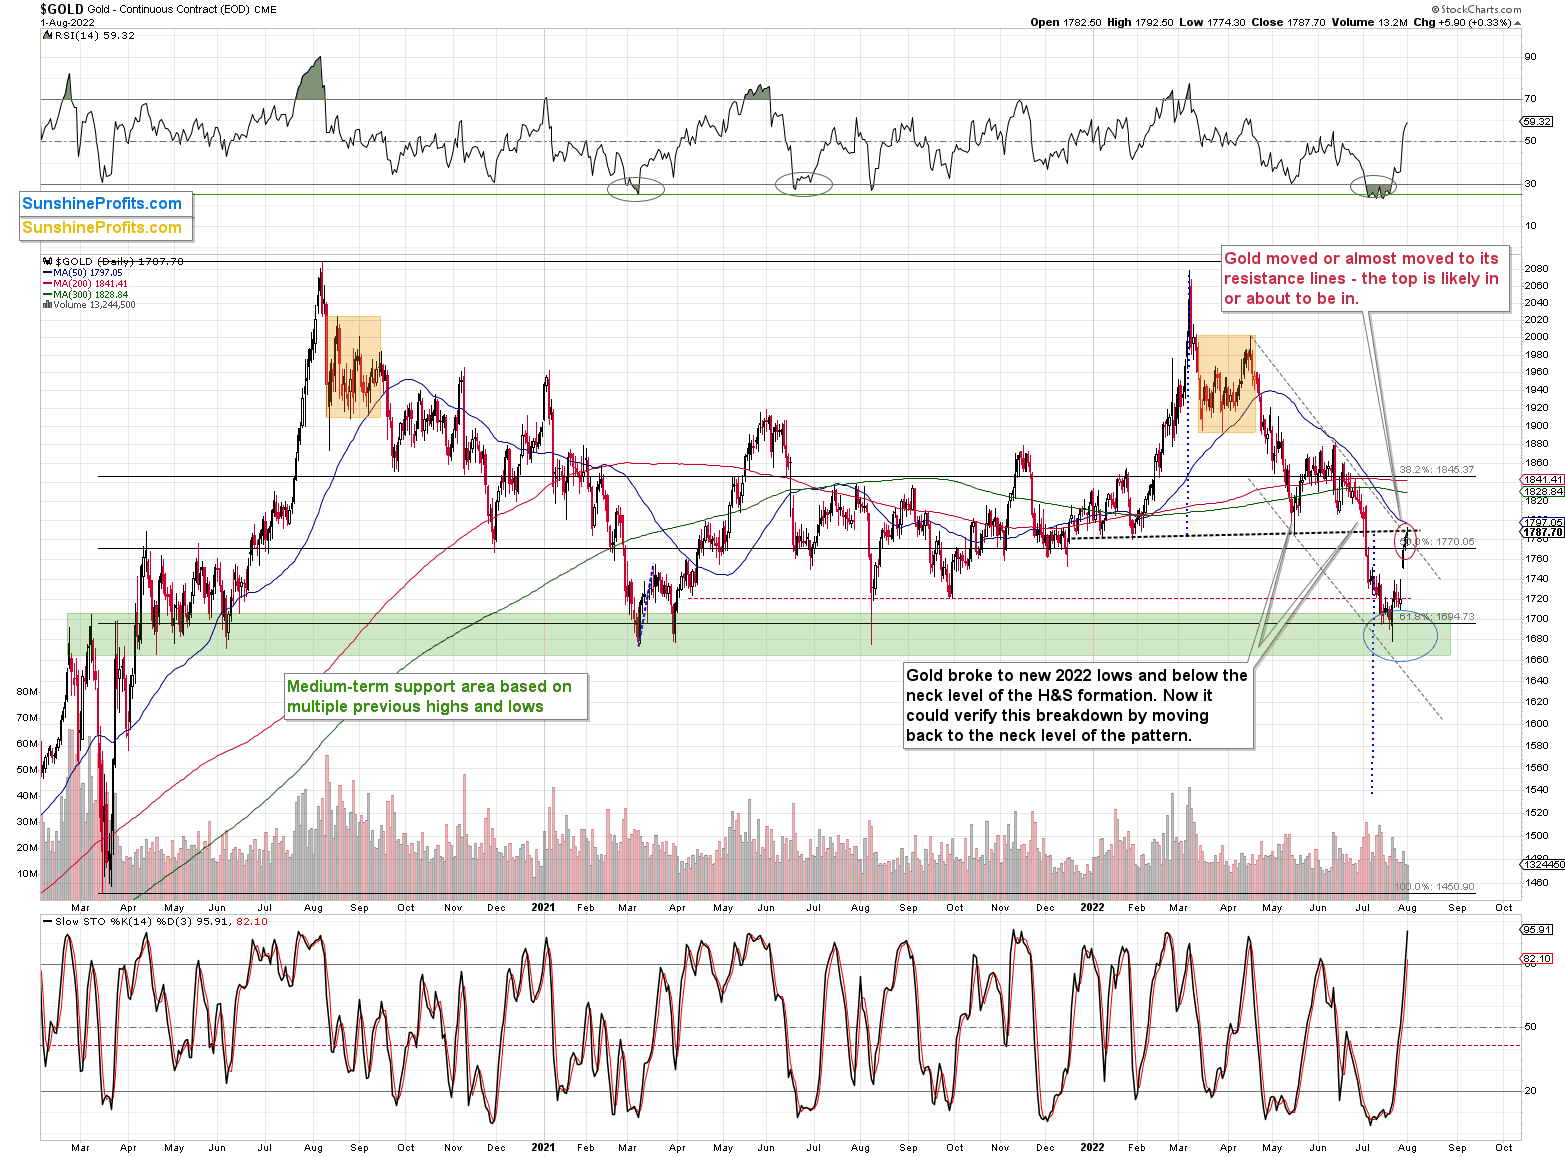
Yes, it did end yesterday’s session higher, but it rallied by only $5.90 (it moved back from its intraday highs before the closing bell).
Based on the above, gold moved to the upper part of my previous target area, and it touched the neck level of the previously broken head-and-shoulders pattern.
While gold moved insignificantly higher, junior miners actually declined.
Consequently, they are underperforming gold, which in turn is not really reacting to USDX’s bullish (for gold) indications. This is simply a bearish combination.
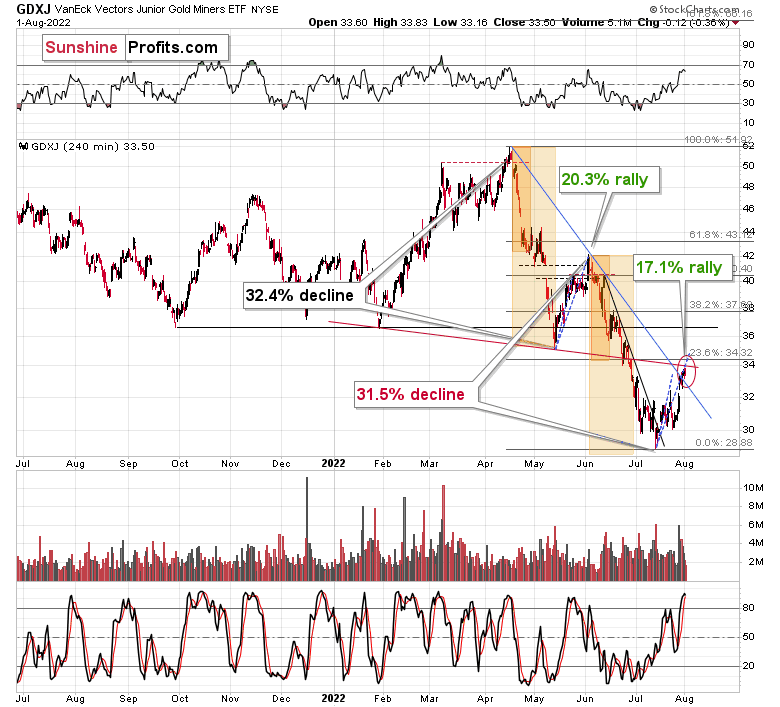
What’s also quite interesting on the above chart is the similarity between the recent upswing and the one that we saw in May and early June. In fact, even the timing relative to the days of the month is similar.
The previous rally started right before the middle of May, while the current upswing began just before the middle of July. The previous one consisted of two smaller rallies, which I marked with blue, dashed lines and copied to the current situation. The first part of the move that we saw in July was not as big as in May, but the timing of the reversals was almost identical.
The second small rally is also aligned – at least so far. If this self-similar pattern is to continue, junior mining stocks are likely to top any day now, and the same goes for other mining stocks, silver, and gold. In fact, perhaps they have just topped.
Oh, and the previous rally ended with an RSI just below 70 – that’s where it is right now as well, which further adds to the credibility of the bearish case for the following weeks.
Having said that, let’s take a look at the market from a more fundamental point of view.
Peak Faith
With the old adage of ‘bad news is good news’ gripping Wall Street, the bulls cheer on weak economic data in hopes that it will elicit a dovish pivot. Moreover, if the Fed cuts rates or restarts QE, Big Tech can fly, and the S&P 500 can reach new heights (which would be bullish for the GDXJ ETF).
However, while the narrative has become popular recently, medium-term realities should materially shift sentiment. For example, the Institute for Supply Management (ISM) released its manufacturing PMI on Aug. 1. Moreover, Timothy R. Fiore, Chair of the ISM Manufacturing Business Survey Committee, said: “The Prices Index registered 60 percent, down 18.5 percentage points compared to the June figure of 78.5 percent; this is the index’s lowest reading since August 2020 (59.5 percent).”
For context, the ISM measures prices paid, and with commodity prices declining sharply last month, the deceleration is far from a surprise. However, he also noted:
“Companies continue to hire at strong rates, with few indications of layoffs, hiring freezes or headcount reduction through attrition. Panelists reported higher rates of quits, reversing June’s positive trend.”
As a result, with “strong rates” of payroll additions and “higher rates of quits” reported in July versus June, employees remain in control of the U.S. labor market. Therefore, while lower commodity prices helped ease the prices paid burden, the labor results highlight why the Atlanta Fed’s Wage Growth Tracker hit an all-time high in June. Thus, while investors celebrate the dip in commodity inflation, their views are increasingly short-sighted.
Second, I noted on Aug. 1 how the consensus makes assertions without doing any critical thinking. For example:
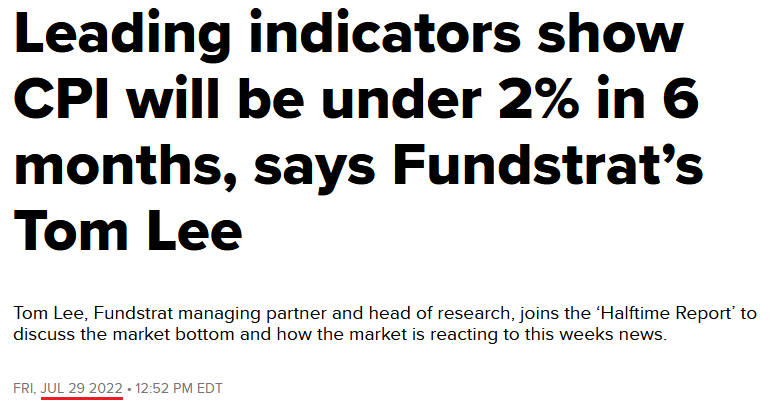 Source: CNBC
In addition, I noted how Preston Caldwell, Head of U.S. Economics for Morningstar, wrote the following after Fed Chairman Jerome Powell’s press conference:
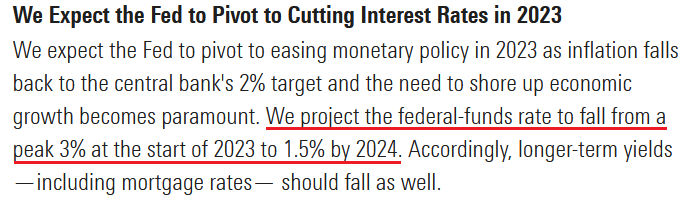
“Falling inflation should clear the way for the Fed to cut interest rates. We're projecting price pressures to swing from inflationary to deflationary by 2023, owing greatly to the unwinding of price spikes caused by supply constraints in durables, energy, and other areas. As such, we project inflation to average just 1.5% over 2023 through 2026. Once the war on inflation is won, the Fed could shift to doing what’s needed to jump-start economic growth.”
Please see below:
 Source: Morningstar
However, their projections don’t make any mathematical sense.
Please see below:
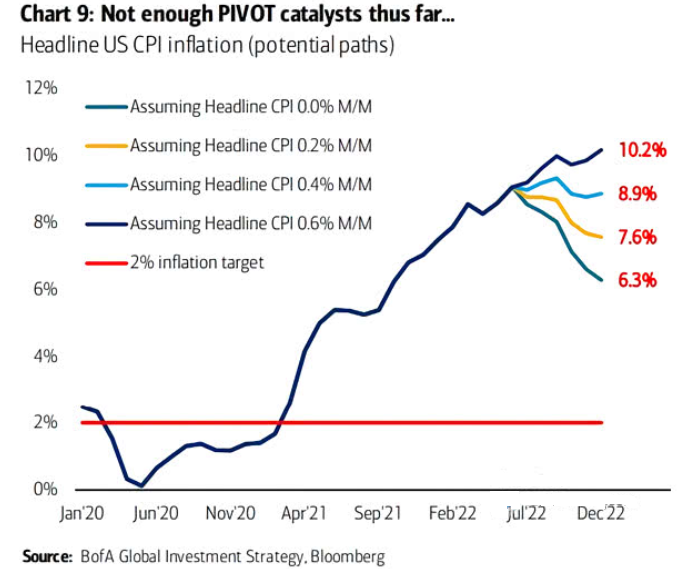
To explain, the various lines above project the year-over-year (YoY) percentage changes in the headline Consumer Price Index (CPI) at the end of 2022. If you analyze the teal colored line on the right, it highlights how the headline CPI will end 2022 at 6.3% YoY if inflation remains flat month-over-month (MoM) for the next six months (including July data). In a nutshell: we would need to have no MoM inflation for six months to realize this figure (extremely unrealistic).
In contrast, the yellow, light blue and dark blue lines above highlight how the headline CPI will end 2022 at 7.6%, 8.9%, or 10.2% YoY if inflation increases by 0.2%, 0.4%, or 0.6% MoM (much more realistic). Therefore, the 'Fed pivot' crowd is providing directions to a destination that doesn't exist.
Please see below:
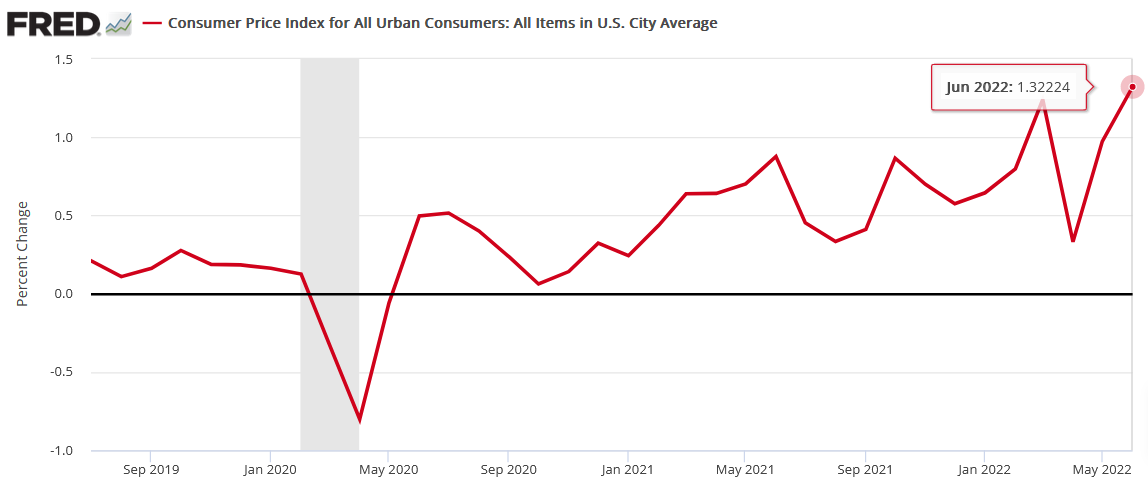
To explain, the red line above tracks the MoM percentage change in the headline CPI since July 2019. As you can see, the headline CPI only dipped below 0% MoM during the pandemic (the shaded gray area). Furthermore, the headline CPI printed a 1.32% MoM increase in June, and the January 2021 reading of 0.24% MoM is the lowest in the last 18 months.
As such, it will take a miracle for the headline CPI to stay at 0% MoM for six months and end 2022 at 6.3% YoY. Moreover, even if it did, the number is still 3.15x the Fed’s 2% annual target.
As further evidence, the Cleveland Fed updated its inflation nowcast on Aug. 1.
Please see below:
 Source: Cleveland Fed
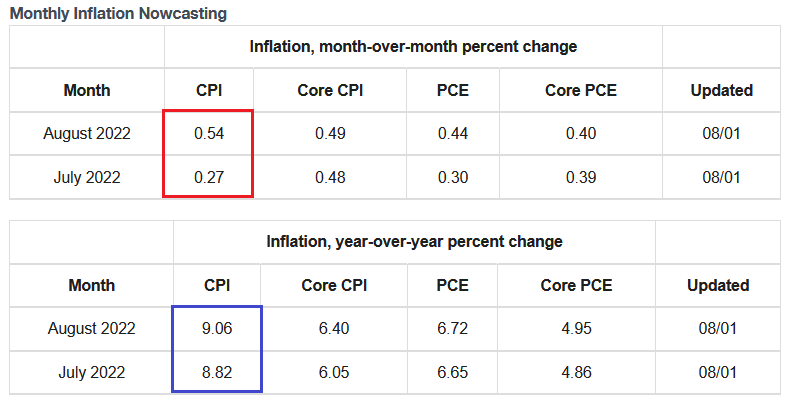
To explain, the red and blue boxes above highlight how the Cleveland Fed expects the headline CPI to rise by 0.27% MoM and by 8.82% YoY in July. Moreover, with commodities falling hard during that period (like the ISM data highlighted), a deceleration is largely expected.
However, I repeatedly warned about how commodities rallied sharply last week after financial conditions loosened and real yields fell. Therefore, the Cleveland Fed expects the headline CPI to increase by 0.54% MoM and by 9.06% YoY in August.
More importantly, the Cleveland Fed’s July and August projections of 0.27% and 0.54% MoM are materially above 0%. Thus, Bank of America’s chart above shows that continued trends of 0.2% (conservative) to 0.6% (aggressive) MoM will put the headline CPI at 7.6% to 10.2% YoY by the end of 2022. As a result, consensus expectations of 2% inflation and a 3% U.S. federal funds rate (FFR) are profoundly out of touch with reality.
Listen to the Calls
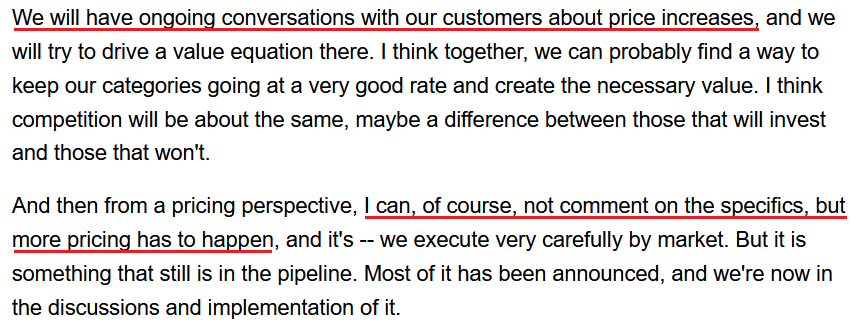
While I’ve highlighted how earnings calls have been riddled with mentions of inflation and price increases, the consensus underestimates the situation on the ground. For example, Mondelez released its second-quarter earnings on Jul. 26. For context, it’s one of the largest confectionary companies in the U.S. and is home to brands like Oreo, Cadbury, Ritz, and Maynards. CEO Dirk Van de Put said during the Q2 earnings call:
“Input cost inflation remains challenging. And although we may see commodity inflation beginning to ease, we expect other costs like wages to show significant inflation (…). North America grew 9.2% in Q2, driven by higher pricing in biscuits as well as double-digit gum & candy growth. Volume mix was down 1% as a result of continued supply chain constraints.”
Please see below:
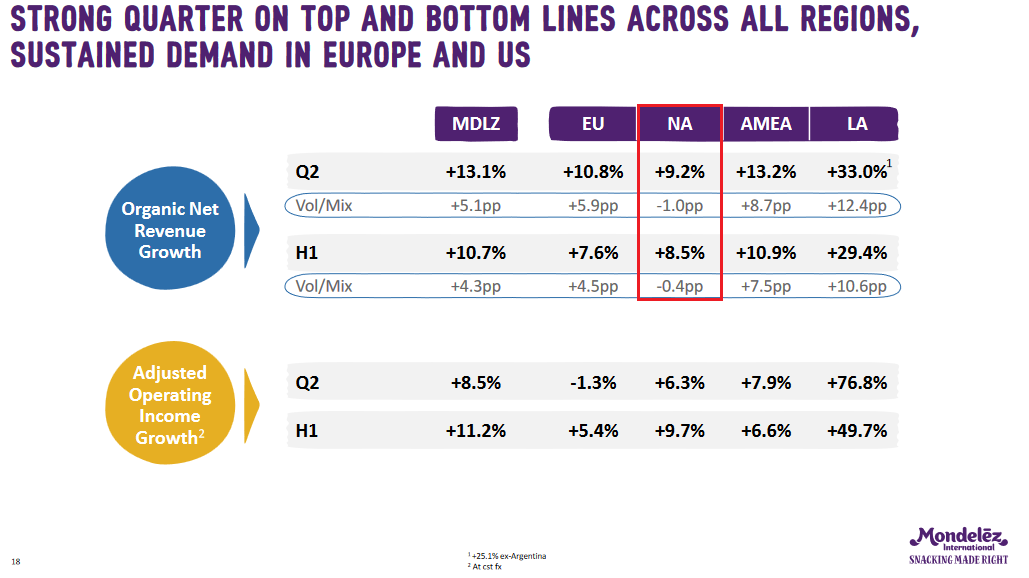
To explain, the red box above shows how Mondelez recorded 9.2% YoY organic net revenue growth in North America in Q2 (which was higher than Q1), with volume down by 1%. Thus, the company raised its prices by ~10.2%. Moreover, Van de Put said Q3 should be more of the same:
“We expect to see is relatively high pricing for probably in the 8% to 10% range, maybe even double-digit pricing. And that would be accompanied by flat to maybe a 1% volume growth.”
Thus, even before Powell went and loosened financial conditions and suppressed real yields on Jul. 27, Van de Put was planning for more price increases in the months ahead.
Please see below:
 Source: Mondelez/Seeking Alpha
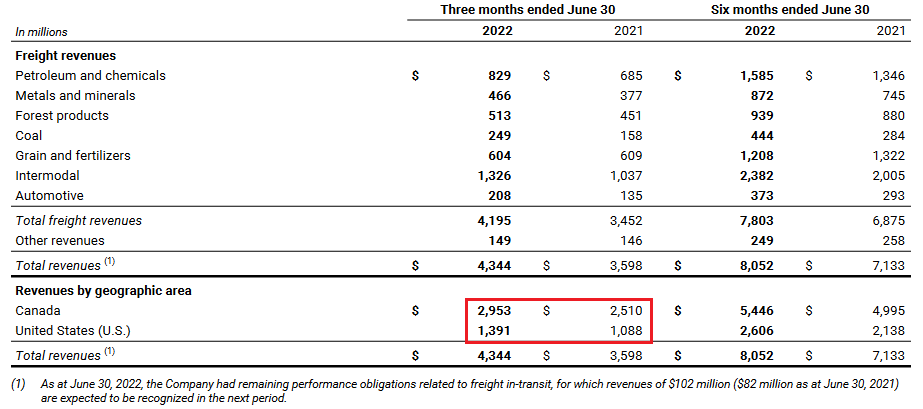
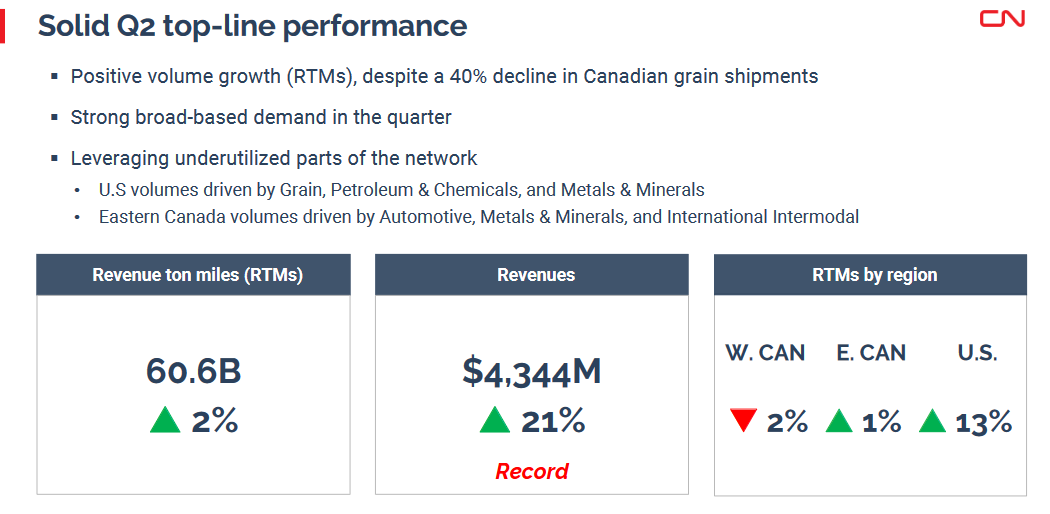
Likewise, Canadian National Railway (CN) – which earned 32% of its Q2 revenue in the U.S. – released its second-quarter earnings on Jul. 26. CFO Ghislain Houle said during the Q2 earnings call:
“While we are seeing some inflationary pressures starting to impact our costs, we are closely monitoring the situation and making sure that we control our expenses and continue to price above rail inflation on contract renewals.”
Moreover, CMO Doug MacDonald added: “we don't guide on what our price is, but we continue to do it well above inflation.”
Therefore, while management is coy about revealing their pricing practices, the company’s financial results provide important clues about the magnitude of rail inflation. For example, CN’s U.S. revenue increased by 28% YoY in Q2.
Please see below:
 Source: CN
However, the company’s revenue ton miles (RTMs) – which measure “the weight and distance of freight transported by CN” – increased by 13% in the U.S.
 Source: CN
As such, the gap between RTMs (volume) and revenue is 15%. Moreover, with the USD/CAD increasing by 3% in Q2 (stronger USD increases CAD revenue), the company likely raised its prices by ~12%. Moreover, with MacDonald noting that CN increased its prices “well above inflation,” a 9%+ CPI makes the ~12% projection reasonable.
Furthermore, Canadian revenue increased by 18%, while RTMs were roughly flat. As a result, price increases may have surpassed 12% in the Great White North.
On top of that, CEO Tracy Robinson said: “We have more demand than capacity,” and MacDonald added: “We're not seeing anything around the demand side right now, and the customers say, we may be soft because of some demand issues this month, but next month, they're telling us, please expect a full boat load to come in. So we're planning based on what the customers are telling us. And right now, it's to keep running what we're doing.”
Thus, while the consensus assumes that inflation is abating, many companies are pricing their products and services well above the headline CPI. Therefore, inflationary realities should materially shift investors’ expectations over the medium term.
The Bottom Line
While investors assume that a Fed pivot is a done deal (some assume it’s already happened), the false narrative should lead to plenty of pain for the S&P 500 and the GDXJ ETF over the medium term. Moreover, with the bulls making CPI projections without explaining how 2% mathematically materializes, market participants continue to live in fantasy land. However, reality is undefeated, and this time is likely no different.
In conclusion, the PMs were mixed on Aug. 1, as mining stocks cooled with the S&P 500. But with the U.S. 5-Year real yield declining to -0.07%, Powell has plenty of work to do to reshape the market narrative. As a result, look out below when the wake-up call arrives.
Overview of the Upcoming Part of the Decline
- It seems to me that the corrective upswing is either over or about to be over, and that the next big move lower is about to start.
- If we see a situation where miners slide in a meaningful and volatile way while silver doesn’t (it just declines moderately), I plan to – once again – switch from short positions in miners to short positions in silver. At this time, it’s too early to say at what price levels this could take place and if we get this kind of opportunity at all – perhaps with gold prices close to $1,600.
- I plan to exit all remaining short positions once gold shows substantial strength relative to the USD Index while the latter is still rallying. This may be the case with gold prices close to $1,400. I expect silver to fall the hardest in the final part of the move. This moment (when gold performs very strongly against the rallying USD and miners are strong relative to gold after its substantial decline) is likely to be the best entry point for long-term investments, in my view. This can also happen with gold close to $1,400, but at the moment it’s too early to say with certainty.
- The above is based on the information available today, and it might change in the following days/weeks.
You will find my general overview of the outlook for gold on the chart below:
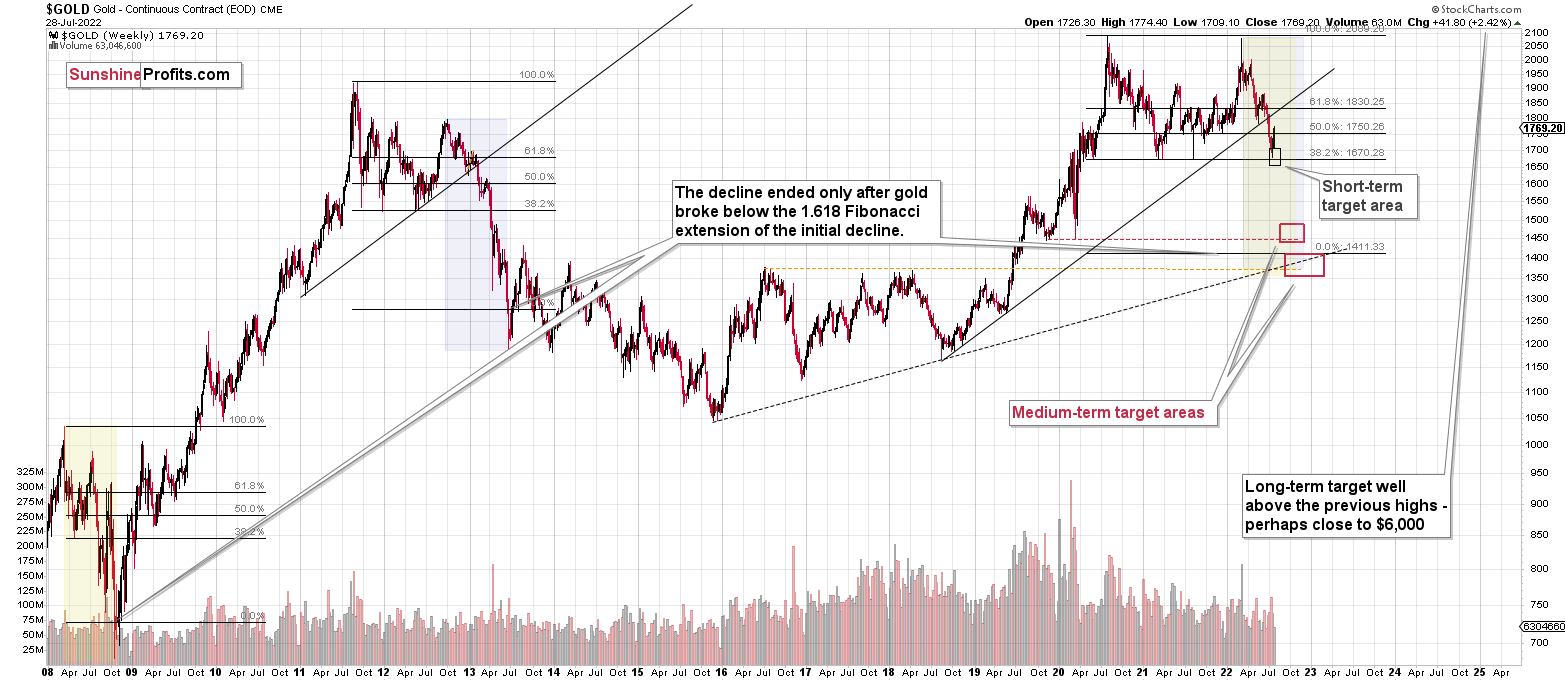
Please note that the above timing details are relatively broad and “for general overview only” – so that you know more or less what I think and how volatile I think the moves are likely to be – on an approximate basis. These time targets are not binding nor clear enough for me to think that they should be used for purchasing options, warrants, or similar instruments.
Letters to the Editor
Q: In your summary, you have the GDXJ exit price at $20.32, but the current price is $33.32. The JDST exit price is $29.87, but the current price is $12.32. The GDXJ doesn't make sense. Is the JDST the updated exit price?
Secondly, I'm looking for a leveraged long product when miners bottom. What are the options? I've read about Proshares Ultra Gold fund (UGL) and DB Gold Double Long (DGL). What are your thoughts? Thanks.
A: I’m not sure about the first question, because I don’t understand why you think those price targets don’t make sense. If it is the size of the move that appears so big that it seems unrealistic, I’d encourage you to read the recent flagship analysis with multiple long-term charts – they provide details. The most recent of those analyses was posted on Friday. In particular, I’d suggest that you examine long-term gold and HUI Index charts.
Please note that the GDXJ already declined even more in the last several months, so what might seem unrealistic – already happened in the recent past.
When it was above $50, it might have been unrealistic to expect to see it below $30 – and yet, that’s exactly what we saw. In fact, those two price points are just about 60 trading days away from each other.
If it is the relation between the price moves in GDXJ and JDST that appears perplexing, I encourage you to read yesterday’s “Letters to the Editor” section, as that’s where I put a simple simulation while explaining the details behind the target for the JDST.
However, to make it even more simple, if the GDXJ is about to decline as much as it already did this year (I’m using the 2022 top as the starting point), then the JDST might do something similar, right? The GDXJ declined by over 40% from this high to this low. During the same time, the JDST rallied by over 160% (from $6.20 to $16.53). If the JDST just bottomed at about $12 and it was to rally by about 160%, then it would need to rally over $30.
As for your second question, the answer depends on what part of the precious metals sector you would like to invest in. If you’re asking about a leveraged product that would be a proxy for mining stocks, then two of the options would be NUGT (for senior miners) and JNUG (for junior miners). The UGL and DGL are proxies for gold, not for mining stocks.
Based on my research, in the first part of the rally, mining stocks tend to outperform, so I will plan to focus on this part of the precious metals sector. If juniors are severely oversold compared to seniors (which could be the case, similarly to what we saw in mid-July), then I’ll probably focus on and buy junior miners in order to benefit from the rebound in the relative valuations – which is also what we profited on recently during the previous long position.
Finally, even though the current price targets are relatively far, if we see a combination of bullish factors before they are reached, it might close the short position and/or reopen a long one regardless of the targets. I’m keeping my eyes – and mind – open, and I’ll report to you – my subscribers – accordingly.
Q: If you are going to short silver when gold is close to 1600. But if you expect gold down to 1490, why close gold short at 1600?
A: Let’s start with a full quote of point 2 from the “Overview of the Upcoming Part of the Decline” section, which your questions are based on.
If we see a situation where miners slide in a meaningful and volatile way while silver doesn’t (it just declines moderately), I plan to – once again – switch from short positions in miners to short positions in silver. At this time, it’s too early to say at what price levels this could take place and if we get this kind of opportunity at all – perhaps with gold prices close to $1,600.
I put some of the key parts in bold. First of all, it’s a big “if”. We might see something like that, and we might not. I’m mentioning this because if it happens, it will likely be during volatile price moves, and I want you to be aware that I might write about something like that at any time. We saw something like that (miners declined first and silver followed with a delay) in the final part of the 2020 decline, and if we see it again, I’d like to take advantage of that.
Second, I will probably not have short positions in gold, but rather in mining stocks.
Finally, the reason why I would close the short position in mining stocks is to… simultaneously open one in silver. That’s how I would make the switch – I wouldn’t be able to do it while keeping the original position intact. If I did, it would not be a switch, but rather an additional position.
Why do it at all? Of course, it’s not obligatory or even suggested that everyone do that, just as with everything else that I’m writing. I’m describing what I view as justified from the risk-to-reward point of view, but I don’t know if this will be applicable to “you” (the person reading this), because there are quite many “yous” reading it, and each “you” has a different risk tolerance, approach, liquidity requirements, time available that they can dedicate to the markets (and reading my analyses) and so on. So, it’s up to you to decide which parts of my analyses and opinions you’d like to focus on and implement in your trading / investment strategies.
Why am I planning to do this? Because it might be a good opportunity to very smoothly increase profits on this entire decline by an extra 10-40% or so. If I expect that a part of the precious metals market (miners) has already declined profoundly and now I expect that a different part (silver) will decline more, then why would I want to continue to hold (short) the part that doesn’t decline as much?
It’s like switching gears while driving a car. Why make the switch if you could drive all the way to your destination in first gear? Theoretically, you could, but… Why not use technology/technique to make the process more efficient?
Of course, I’m exaggerating here, as staying in first gear at all times will harm the engine, etc., and in the case of this trade, it would be a calmer trade that is likely to end up being very profitable nonetheless. From my point of view, the “hassle” involved with the switch and taking the risk (I could be wrong with regard to the moment of the switch and it results in lower profits instead of higher ones) is worth the likely reward (increased overall profitability).
Q: Can you please give some levels that you see for copper prices during this upcoming PM fall? Thank you.
A: Sure.
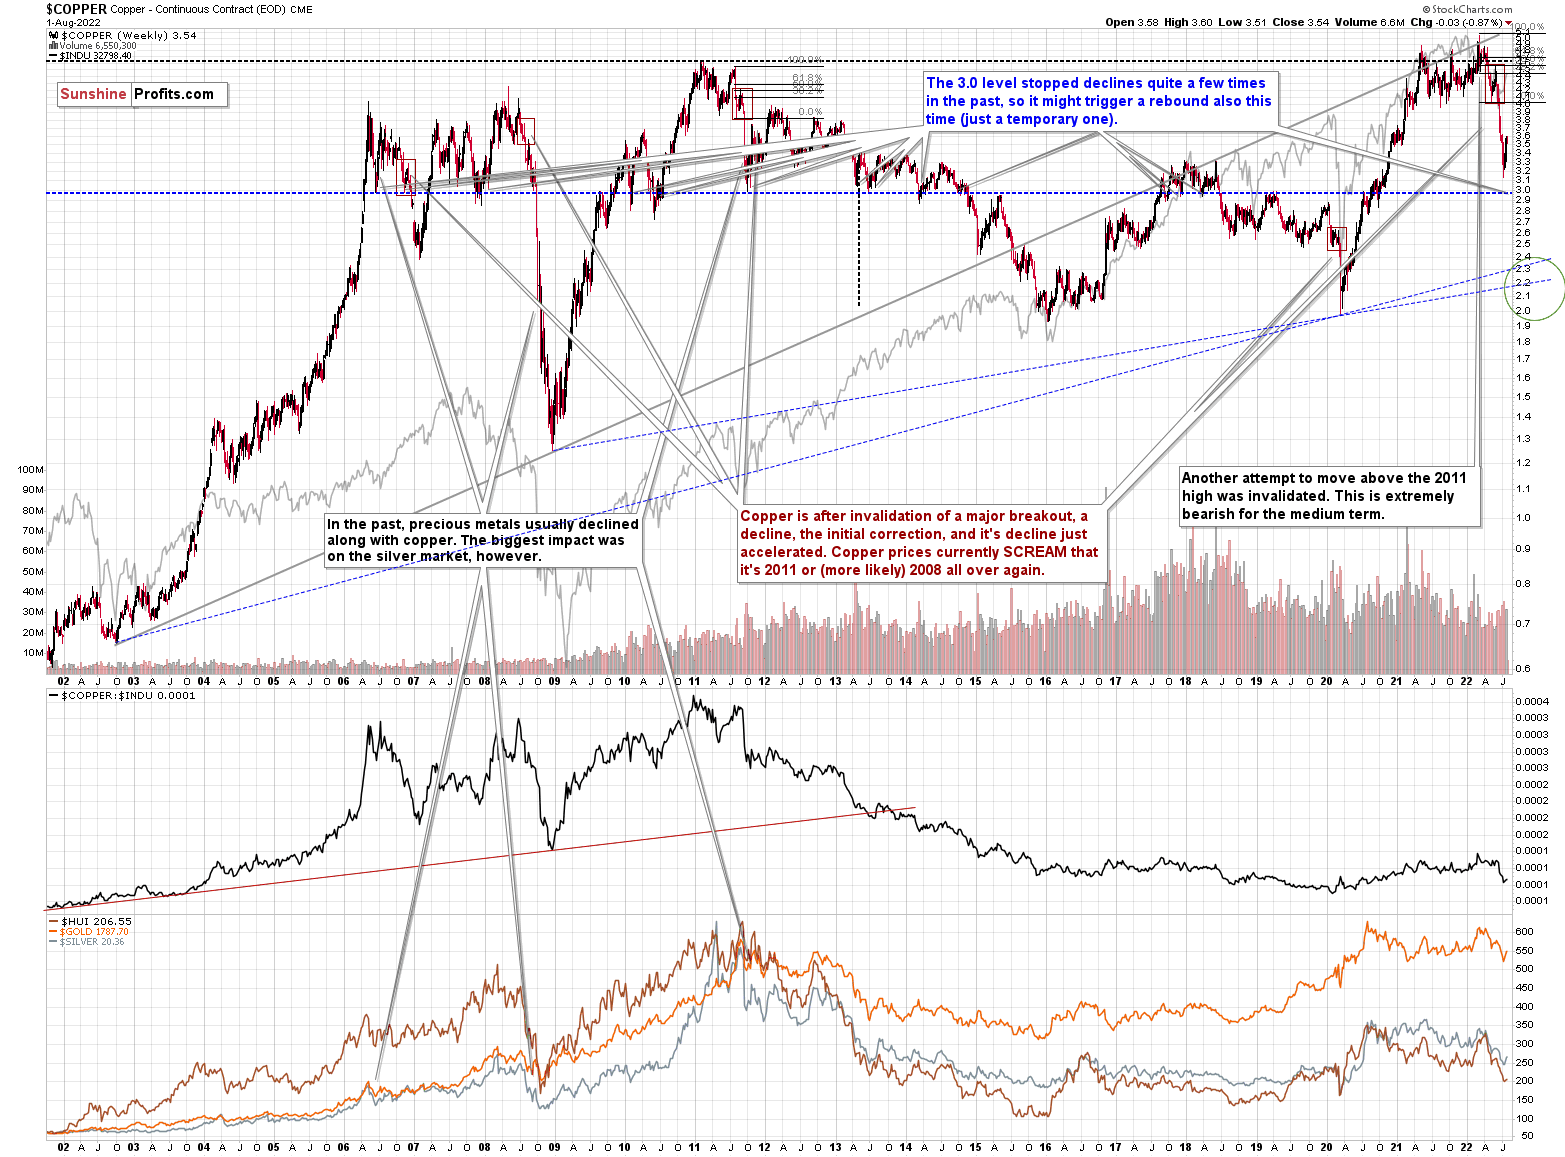
It seems to me that there might be some kind of smaller corrective upswing or a pause when copper moves to about $3.0, but that it would then decline profoundly once again, only to bottom in the $2.0-2.4 area. That’s where we have rising, long-term support lines and also the previous – 2016 and 2020 – lows.
Summary
Summing up, it seems that the corrective upswing is over (or close to being over), which means that the powerful medium-term downtrend can now resume.
Last week, we closed yet another profitable trade in a row. This year’s profits are already enormous, but it seems likely to me that they will grow even more in the following weeks and months. Making money on corrections during powerful trends is a difficult feat, but you managed to do just that – congratulations!
Moreover, please note that it’s not only the profits on the long positions that are so great about this success – it’s also the ability to get back on the short side of the market at more favorable (higher) prices, thus increasing the likely profits from the current trade. Congratulations, once again!
Also, please note that I will be updating the targets for the leveraged ETFs as we move closer to them, as their prices will depend on the path prices take to reach their targets.
After the final sell-off (that takes gold to about $1,350-$1,500), I expect the precious metals to rally significantly. The final part of the decline might take as little as 1-5 weeks, so it's important to stay alert to any changes.
As always, we'll keep you – our subscribers – informed.
To summarize:
Trading capital (supplementary part of the portfolio; our opinion): Full speculative short positions (300% of the full position) in junior mining stocks are justified from the risk to reward point of view with the following binding exit profit-take price levels:
Mining stocks (price levels for the GDXJ ETF): binding profit-take exit price: $20.32; stop-loss: none (the volatility is too big to justify a stop-loss order in case of this particular trade)
Alternatively, if one seeks leverage, we’re providing the binding profit-take levels for the JDST (2x leveraged). The binding profit-take level for the JDST: $29.87; stop-loss for the JDST: none (the volatility is too big to justify a SL order in case of this particular trade).
For-your-information targets (our opinion; we continue to think that mining stocks are the preferred way of taking advantage of the upcoming price move, but if for whatever reason one wants / has to use silver or gold for this trade, we are providing the details anyway.):
Silver futures downside profit-take exit price: $12.32
SLV profit-take exit price: $11.32
ZSL profit-take exit price: $79.87
Gold futures downside profit-take exit price: $1,504
HGD.TO – alternative (Canadian) 2x inverse leveraged gold stocks ETF – the upside profit-take exit price: $19.87
HZD.TO – alternative (Canadian) 2x inverse leveraged silver ETF – the upside profit-take exit price: $49.87
Long-term capital (core part of the portfolio; our opinion): No positions (in other words: cash)
Insurance capital (core part of the portfolio; our opinion): Full position
Whether you’ve already subscribed or not, we encourage you to find out how to make the most of our alerts and read our replies to the most common alert-and-gold-trading-related-questions.
Please note that we describe the situation for the day that the alert is posted in the trading section. In other words, if we are writing about a speculative position, it means that it is up-to-date on the day it was posted. We are also featuring the initial target prices to decide whether keeping a position on a given day is in tune with your approach (some moves are too small for medium-term traders, and some might appear too big for day-traders).
Additionally, you might want to read why our stop-loss orders are usually relatively far from the current price.
Please note that a full position doesn't mean using all of the capital for a given trade. You will find details on our thoughts on gold portfolio structuring in the Key Insights section on our website.
As a reminder - "initial target price" means exactly that - an "initial" one. It's not a price level at which we suggest closing positions. If this becomes the case (as it did in the previous trade), we will refer to these levels as levels of exit orders (exactly as we've done previously). Stop-loss levels, however, are naturally not "initial", but something that, in our opinion, might be entered as an order.
Since it is impossible to synchronize target prices and stop-loss levels for all the ETFs and ETNs with the main markets that we provide these levels for (gold, silver and mining stocks - the GDX ETF), the stop-loss levels and target prices for other ETNs and ETF (among other: UGL, GLL, AGQ, ZSL, NUGT, DUST, JNUG, JDST) are provided as supplementary, and not as "final". This means that if a stop-loss or a target level is reached for any of the "additional instruments" (GLL for instance), but not for the "main instrument" (gold in this case), we will view positions in both gold and GLL as still open and the stop-loss for GLL would have to be moved lower. On the other hand, if gold moves to a stop-loss level but GLL doesn't, then we will view both positions (in gold and GLL) as closed. In other words, since it's not possible to be 100% certain that each related instrument moves to a given level when the underlying instrument does, we can't provide levels that would be binding. The levels that we do provide are our best estimate of the levels that will correspond to the levels in the underlying assets, but it will be the underlying assets that one will need to focus on regarding the signs pointing to closing a given position or keeping it open. We might adjust the levels in the "additional instruments" without adjusting the levels in the "main instruments", which will simply mean that we have improved our estimation of these levels, not that we changed our outlook on the markets. We are already working on a tool that would update these levels daily for the most popular ETFs, ETNs and individual mining stocks.
Our preferred ways to invest in and to trade gold along with the reasoning can be found in the how to buy gold section. Furthermore, our preferred ETFs and ETNs can be found in our Gold & Silver ETF Ranking.
As a reminder, Gold & Silver Trading Alerts are posted before or on each trading day (we usually post them before the opening bell, but we don't promise doing that each day). If there's anything urgent, we will send you an additional small alert before posting the main one.
Thank you.
Przemyslaw Radomski, CFA
Founder, Editor-in-chief

