
tools spotlight

-
What Happens After a Bullish Stampede?
December 8, 2021, 8:13 AMThe bulls pumped up the market, but with fundamentals deteriorating and corporations largely responsible for the spike, regular investors will be left holding the bag.
With investors betting on a Santa Clause rally despite the deteriorating fundamentals, the S&P 500 helped the GDXJ ETF (proxy for junior mining stocks) outperform on Dec. 7. However, with short-covering and corporate buybacks primarily responsible for the daily spike, another ‘Minsky Moment’ could be on the horizon.
To explain, I wrote on Nov. 19:
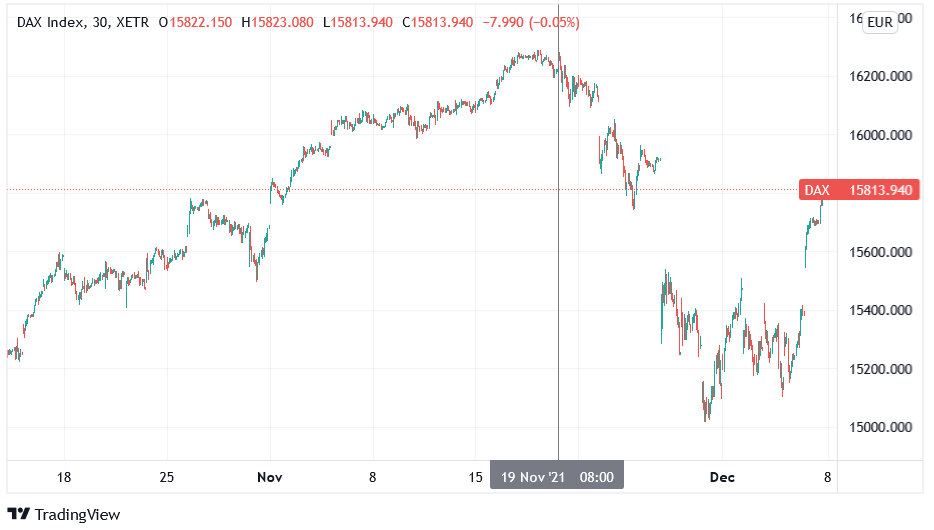
While European markets have largely ignored the recent coronavirus spikes, a sharp sell-off could be the spark that lights the S&P 500’s correction. To explain, the DAX 30 Index (Germany) and the CAC 40 Index (France) both closed slightly lower on Nov. 18. However, prior to Nov. 18, the DAX 30 had closed in the green for 13 of the last 15 trading days, and one-upping its European counterpart, the CAC 40 had closed in the green for 15 of the last 16 trading days.
On top of that, the CAC 40 had an RSI (Relative Strength Index) north of 80, while the DAX 30 had an RSI north of 75. As a result, both indices are materially overbought at a time when Germany is implementing new restrictions. Thus, if a Minsky Moment strikes in Europe, don’t be surprised if the negativity cascades across the Atlantic.
To that point, after volatility erupted on cue, the DAX 30 suffered an intraday peak-to-trough decline of 7.8%, the CAC 40 dropped by 7.3%, and the S&P 500 dropped by 5.2%.
Please see below:
However, with overzealous equity bulls back at it again on Dec. 7, the PMs benefited from the risk-on sentiment. However, with the fundamental problems still present, investors may have set themselves up for more disappointment.
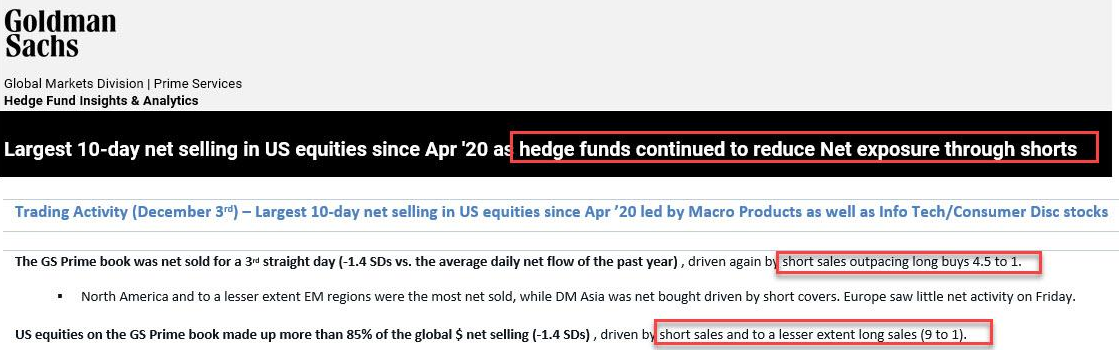
To explain, with hedge funds increasing their short bets a little too late, Goldman Sachs Prime Brokerage reported that last week, “US equities on the GS Prime book made up more than 85% of the global $ net selling (-1.4 SDs), driven by short sales and to a lesser extent long sales (9 to 1).”
In a nutshell: hedge funds increased their short bets at the worst possible time.
Please see below:
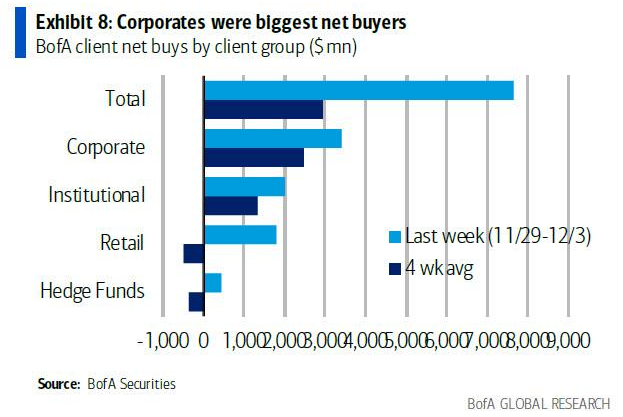
Thus, with the Dec. 7 rally driven mainly by a reversal of these positions, the profound short squeeze helped uplift the PMs. For example, Bank of America data shows that last week’s corporate buybacks were the highest weekly total since March. And by repurchasing nearly $3.4 billion of their own stock (focus on the first blue column from the left), their bids helped calm the S&P 500’s selling pressure.
Please see below:
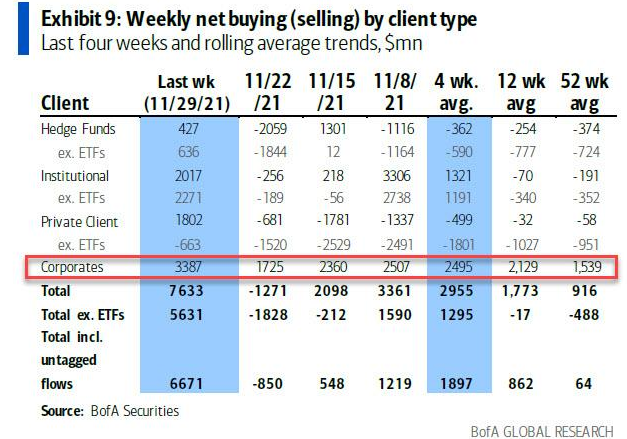
What’s more, while Bank of America said that hedge funds and retail investors somewhat bought the dip last week (though, they’re still net-sellers over the last four weeks), corporations did much of the heavy lifting.
As a result, with retail investors running out of gas and hedge funds mainly closing out their shorts on Dec. 7, the S&P 500 should resume its correction. More importantly, though, mining stocks’ recent strength should wilt away as the drama unfolds.
Please see below:
And now for the grand reveal: corporations' buyback blackout period begins on Dec. 10. And since they can't repurchase more shares until the New Year, the elephant in the room won't be able to support the S&P 500. Likewise, after hedge funds covered their shorts on Dec. 7, short-covering won't be able to support the S&P 500 either. As a result, mining stocks should suffer if the negativity resurfaces over the next few weeks.
Please see below:
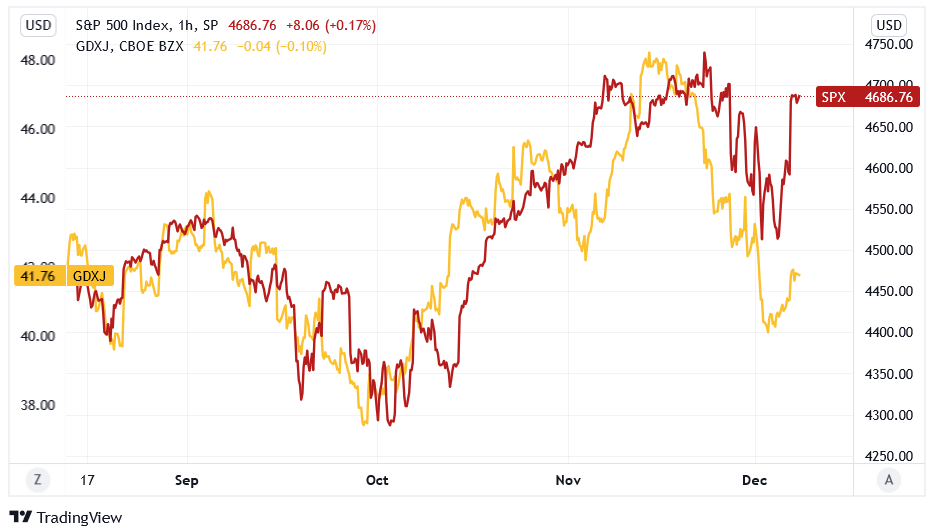
To explain, the red line above tracks the hourly movement of the S&P 500, while the gold line above tracks the hourly movement of the GDXJ ETF. As you can see, the junior miners often follow in the S&P 500’s footsteps. And with the S&P 500 setting itself up for another drop, the GDXJ ETF likely won’t be far behind.
To that point, with the headline Consumer Price Index (CPI) scheduled for release on Dec. 10 and the Fed’s next monetary policy meeting scheduled for Dec. 14/15, sources of volatility will arrive at a time when corporations are stuck on the sidelines.
For context, I wrote on Nov. 12:
I’ve highlighted on several occasions how the Commodity Producer Price Index (PPI) often leads the following month’s headline CPI. And after the former increased by 2% month-over-month (MoM) on Nov. 9 – which is a material MoM increase – and by 22.2% YoY (a new 2021 high), it implies a headline CPI print of roughly 5.75% to 6.25% when the data is released on Dec. 10.
Please see below:
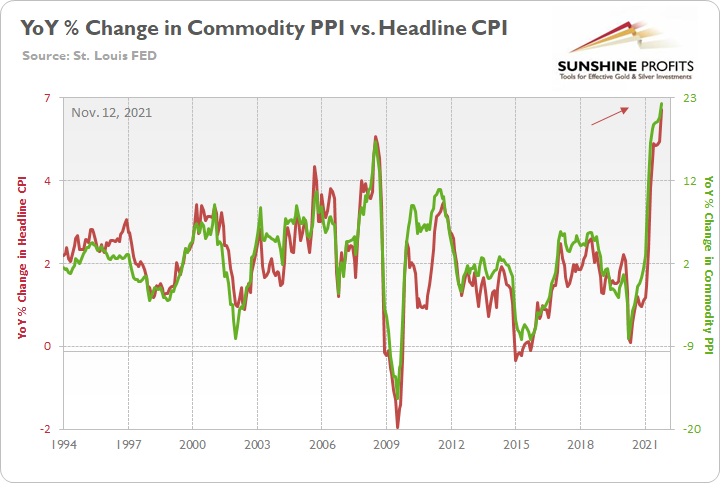
To explain, the green line above tracks the YoY percentage change in the commodity PPI, while the red line above tracks the YoY percentage change in the headline CPI. If you analyze the relationship, you can see that the pair have a close connection.
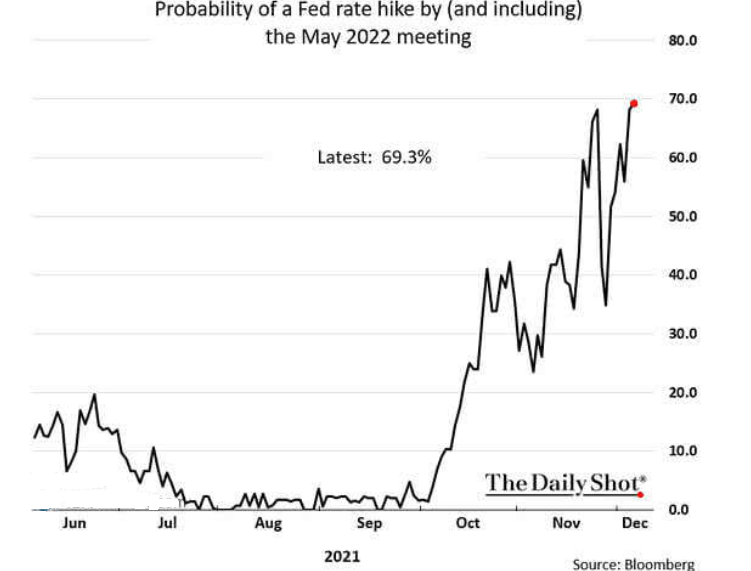
In addition, after expectations for September were pulled forward to July, and then expectations for July were pulled forward to June, now, the probability of a Fed rate hike in May 2022 has reached ~69%.
Please see below:
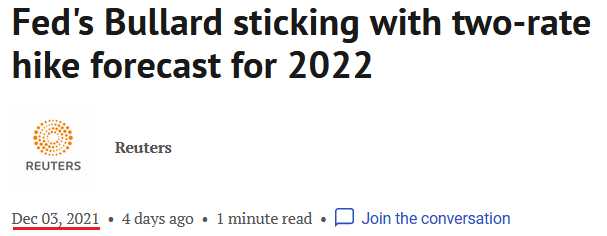
Also noteworthy, St. Louis Fed President James Bullard said on Dec. 3 that “the danger now is that we get too much inflation.... It's time for the [Fed] to react at upcoming meetings.”
He added: “the inflation numbers are high enough that I think [ending the taper by March] would really help us to create the optionality to do more if we had to, if inflation doesn't dissipate as expected in the next couple of months.”
For context, Bullard reiterated that he expects two Fed rate hikes in 2022.
The bottom line? While the bulls stampeded through Wall Street on Dec. 7, things aren’t as rosy as they appear. And while the PMs benefited from the renewed optimism, their tepid rallies are even more fragile. Moreover, with another inflation print on the horizon and the FOMC’s Dec. 15 decision including its Summary of Economic Projections, the hawkish revelations could rattle the financial markets. And with corporate buybacks starting their holiday vacation on Dec. 10, stock market investors are on their own to navigate what comes next.
In conclusion, the PMs rallied on Dec. 7, as risk-on sentiment reigned supreme. However, with the S&P 500 rallying by more than 2% and WTI rallying by nearly 4%, the PMs’ daily upswings were relatively muted. As a result, precious metals investors sense that caution is warranted. And with their trepidation a sign of heightened anxiety, they likely realize that going long the PMs involves much more risk than reward.
Thank you for reading our free analysis today. Please note that the above is just a small fraction of the full analyses that our subscribers enjoy on a regular basis. They include multiple premium details such as the interim targets for gold and mining stocks that could be reached in the next few weeks. We invite you to subscribe now and read today’s issue right away.
Sincerely,
Przemyslaw Radomski, CFA
Founder, Editor-in-chief -
The Upward Price Action In Gold Miners Was… Boring
December 7, 2021, 9:26 AMSo, gold miners moved higher yesterday. What does this daily rally change? Nothing.
There are days when things are particularly interesting and many things change. Yesterday was not one of those days.
The price action in the GDX ETF was relatively boring, and the same goes for other markets as well. In the case of gold, this boredom is actually bearish, but we’ll get to that shortly. For now, let’s take a look at the GDX chart.
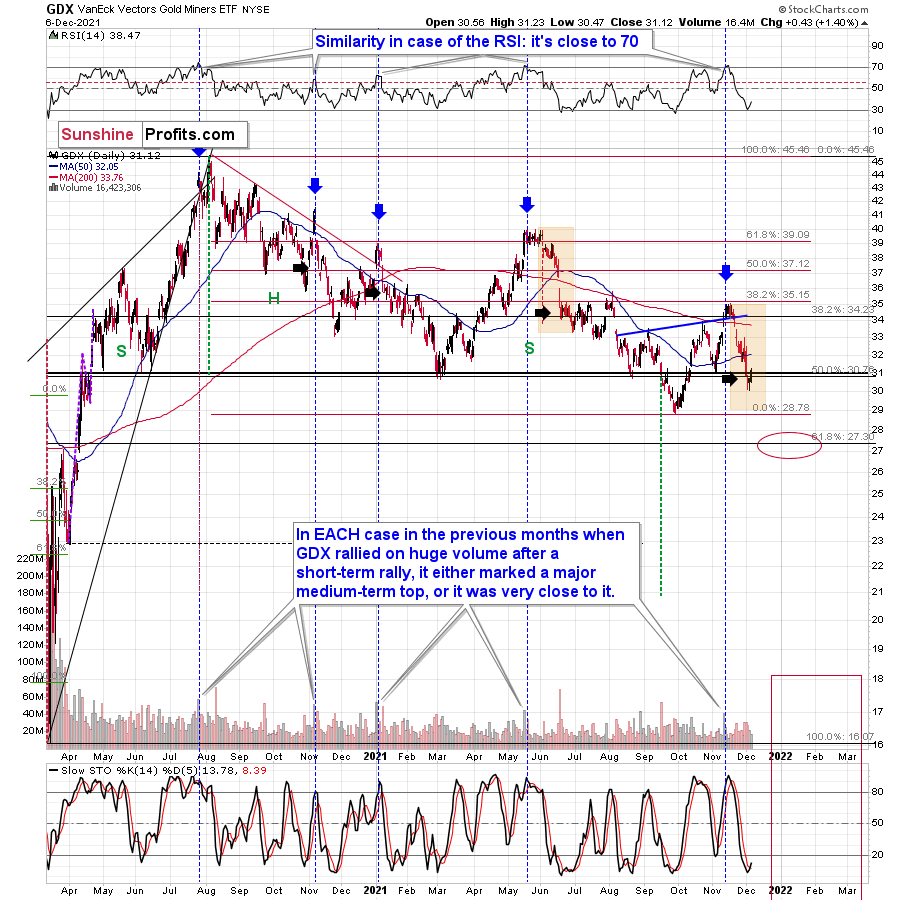
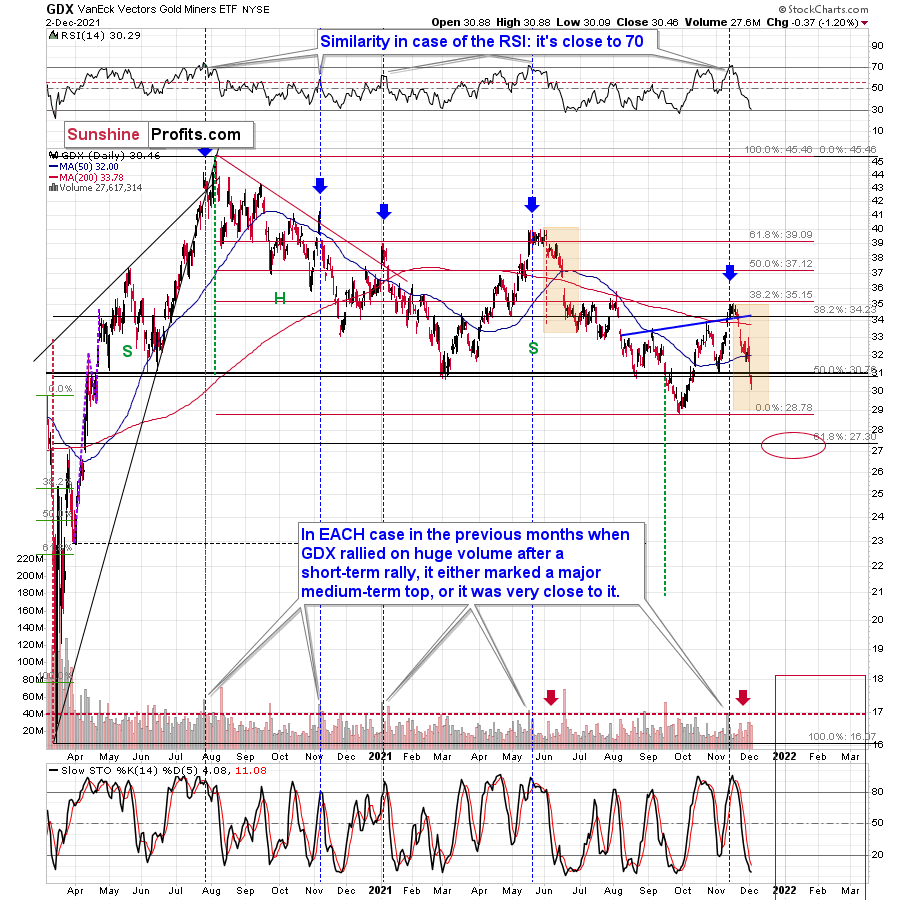
We saw a small upswing, which is in tune with what we saw previously after sharp rallies that followed high-volume rallies/tops. I marked those previous high-volume sessions with blue vertical lines and in three out of four previous cases, I also placed black arrows after the initial part of the decline.
I did that to illustrate what happened in those previous cases and to provide the context for what happened yesterday. In those three cases, we saw tiny upswings that were then followed by lower prices. So, that is the default price action that one should expect here. And, well, that’s what happened yesterday. Expected, regular – and boring.
On a side note, I’m not saying that the situation being “boring” is a bad thing. If the markets only do boring stuff – behaving as expected – it means that they will likely do things more or less in tune with their outlook, which in turn means that they will likely move in tune with our trading positions, thus making them more profitable.
In this case, the daily move up is not in tune with them, but it’s in tune with the bigger – and very bearish – picture, which is positive for our trading positions as it increases the chances that they will become very, very, very profitable in the not-too-distant future.
The volume that accompanied yesterday’s small upswing was relatively low, so that’s also something suggesting that the increase was just a breather within a decline.
The GDX also moved close to its early-November lows, so let’s zoom in.
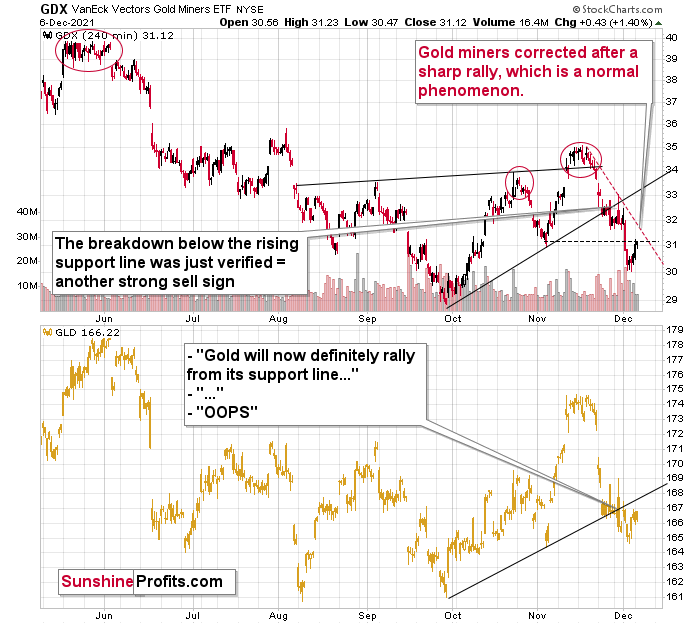
After verifying the breakdown below its rising support line, the GDX moved lower, just as I expected it to. Now it’s after a breakdown below its previous (November) lows, and it seems to be verifying that breakdown just as it verified the breakdown below the rising support line in late November.
The black dashed line in the above chart shows the resistance provided by the previous lows. It wasn’t invalidated. At the same time, the GDX is well below its declining red resistance line, and even if it moves close to this line but then declines, it will not be viewed as something bullish.
But will it really move higher? I wouldn’t bet the farm on that scenario. Why? Because, for instance, the breakdown in the GLD ETF has been more than verified, and it seems that the flagship ETF for gold is now ready to slide lower - and if it does, miners are likely to slide as well.
By the way, please note that junior miners are once again declining more than senior miners, also in tune with my previous expectations.
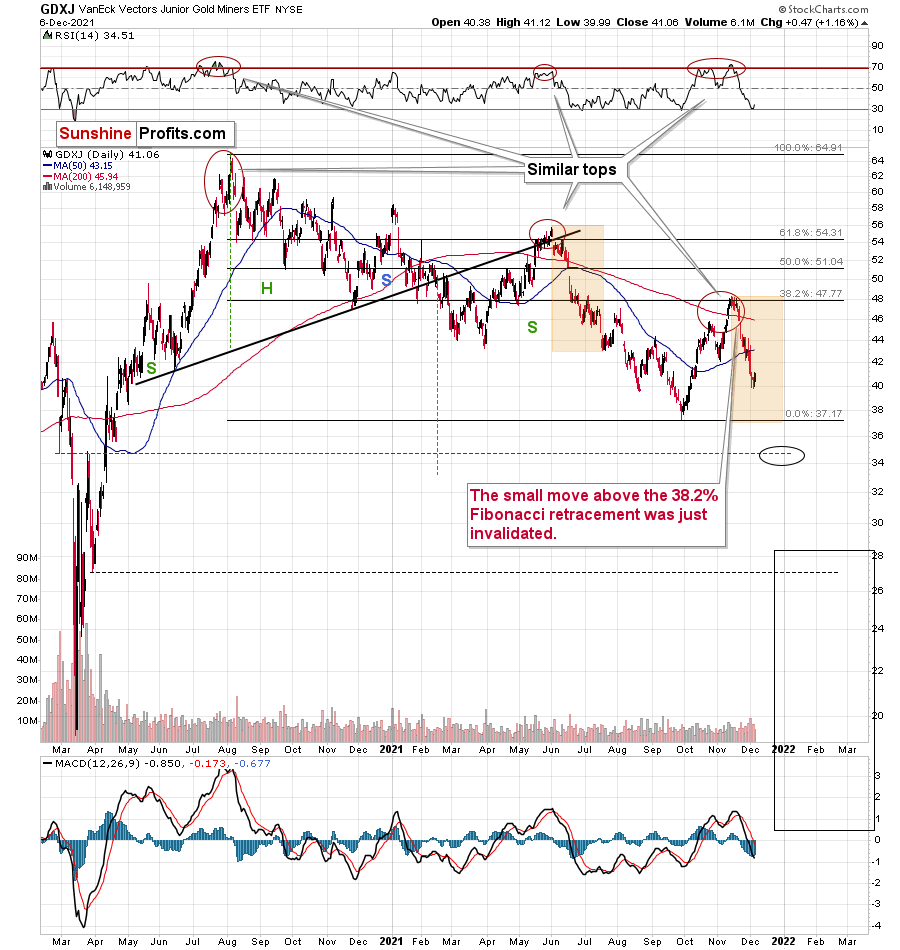
While the GDX ETF moved back to its November lows, the GDXJ ETF (a proxy for junior mining stocks) is well below the analogous lows.
What’s likely to happen next? Well… let’s take a look at gold.
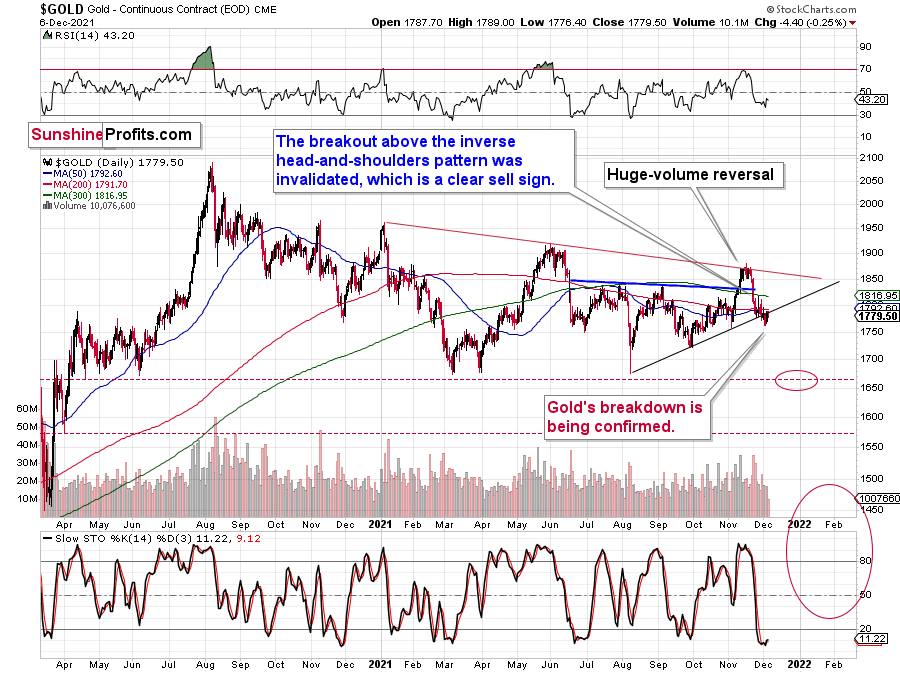
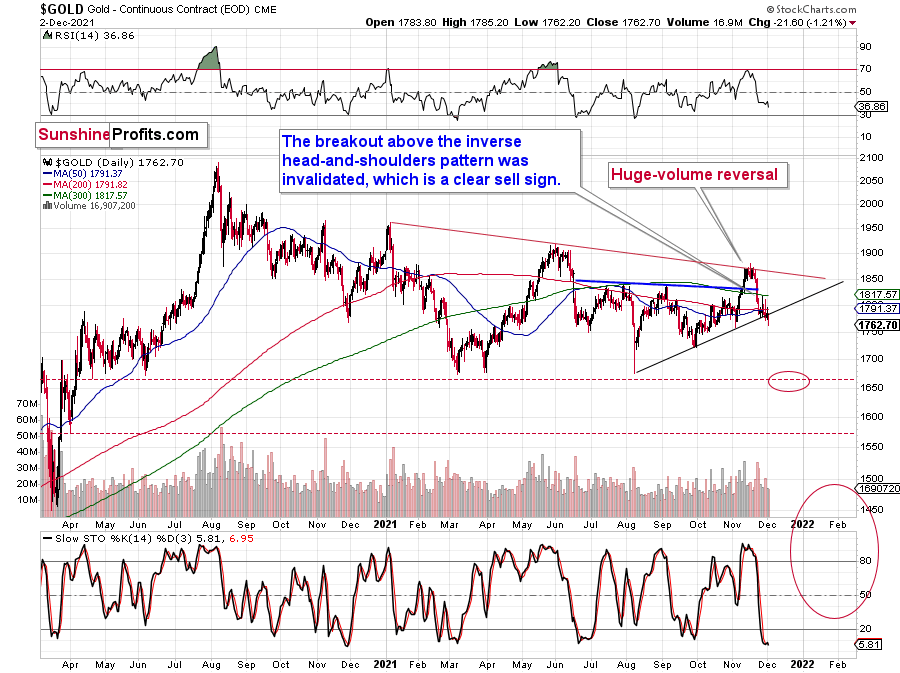
Gold is after a breakdown below its rising support line based on previous lows, and this breakdown is now being verified.
Gold broke below this support line on Thursday (Dec. 2), moved back to it on Friday (Dec. 3) without breaking back above it, and declined once again yesterday (Dec. 6). The decline was not huge (just $4.40), but it was enough as what counts is that it was the third consecutive trading day during which gold didn’t invalidate the breakdown. This makes it a confirmed breakdown, with very bearish implications going forward.
In this environment, gold, silver, and mining stocks are likely to move lower in the short term.
This is especially the case given that the USD Index is likely to move higher once again.
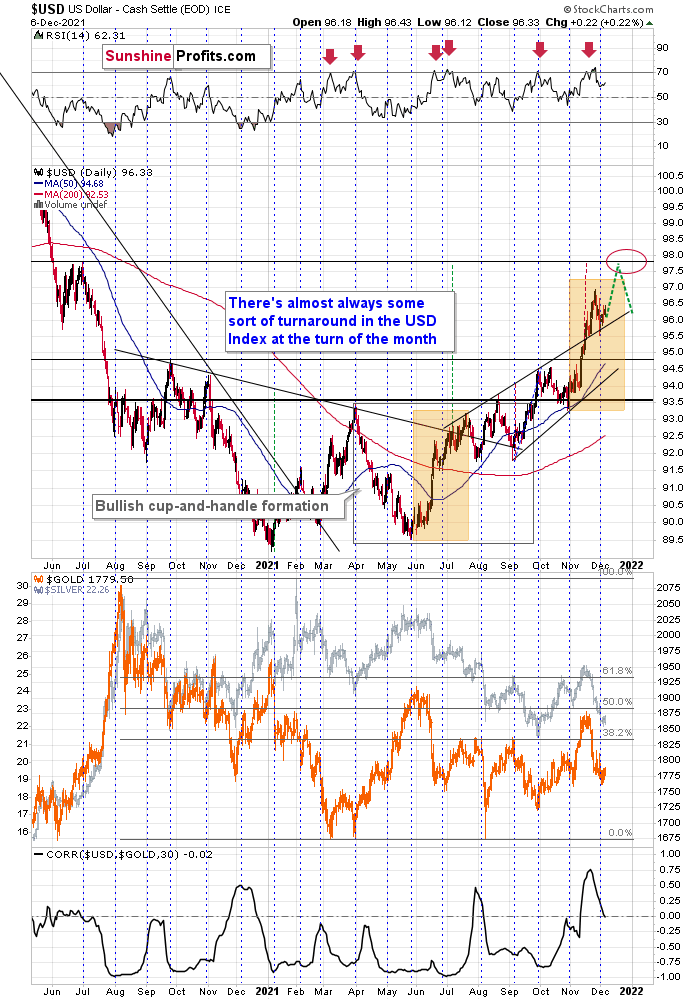
This would be in tune with what I wrote previously about the shape of the USD’s rally. Namely, that the July performance is being somewhat repeated.
This time, though, it seems that the upside target might be higher than the upper part of the orange rectangle (which would make this and the mid-2021 rallies identical).
Namely, there’s strong resistance provided by the mid-2020 high, and there’s also another trading technique pointing to the proximity of 98 to be the target for the current rally.
The USD Index broke above the rising wedge, and it then verified the breakout above this wedge (that’s the recent short-term decline). The size of the rally that is likely to follow the breakout is quite likely to be equal or similar to the width of the wedge. I marked that with red, dashed lines, and this technique confirms the target just below the 98 level.
I also marked the USD’s most likely short-term price path with green lines. It seems to me that the USD Index will rally soon, and then correct to more or less current levels (or perhaps lower).
The short-term upswing could trigger gold’s decline to the previous lows, while the following corrective pullback in the USDX could trigger gold’s corrective upswing (from its 2021 lows). This would be in perfect tune with what happened in 2013 right before the huge slide in the precious metals and mining stocks.
The mid-December FOMC could be the turning moment for the U.S. dollar and for other markets, but it’s not 100% clear whether it will be this development that triggers the short-term reversal.
So, all in all, the short-term outlook for the precious metals market remains bearish, and so does the outlook for the next few months. It’s likely that we’ll see some kind of a rebound once gold moves to its previous 2021 lows, though.
Thank you for reading our free analysis today. Please note that the above is just a small fraction of the full analyses that our subscribers enjoy on a regular basis. They include multiple premium details such as the interim targets for gold and mining stocks that could be reached in the next few weeks. We invite you to subscribe now and read today’s issue right away.
Sincerely,
Przemyslaw Radomski, CFA
Founder, Editor-in-chief -
US Dollar Still Has the Green Light
December 6, 2021, 9:22 AMThe dollar looks poised for another rally, to gold’s dismay. So, what’s the price target for the greenback over the winter months?
While the consensus across the financial markets (especially at the beginning of the year) was that the U.S. dollar was destined for devaluation, I warned that the greenback would rise from the ashes. And with gold, silver, and mining stocks often moving inversely to the U.S. dollar, the latter’s ascent helped make the precious metals one of the worst-performing asset classes in 2021.
Moreover, after more dollar doubters emerged in October – and the precious metals rallied hard – the USD Index eventually cut through 94, 95, and then 96 like a knife through butter. And with the precious metals reversing sharply once again, I expect another rally to push the USD Index to ~98 over the medium term. Perhaps quite soon. And the implications for the precious metals sector, are bearish.
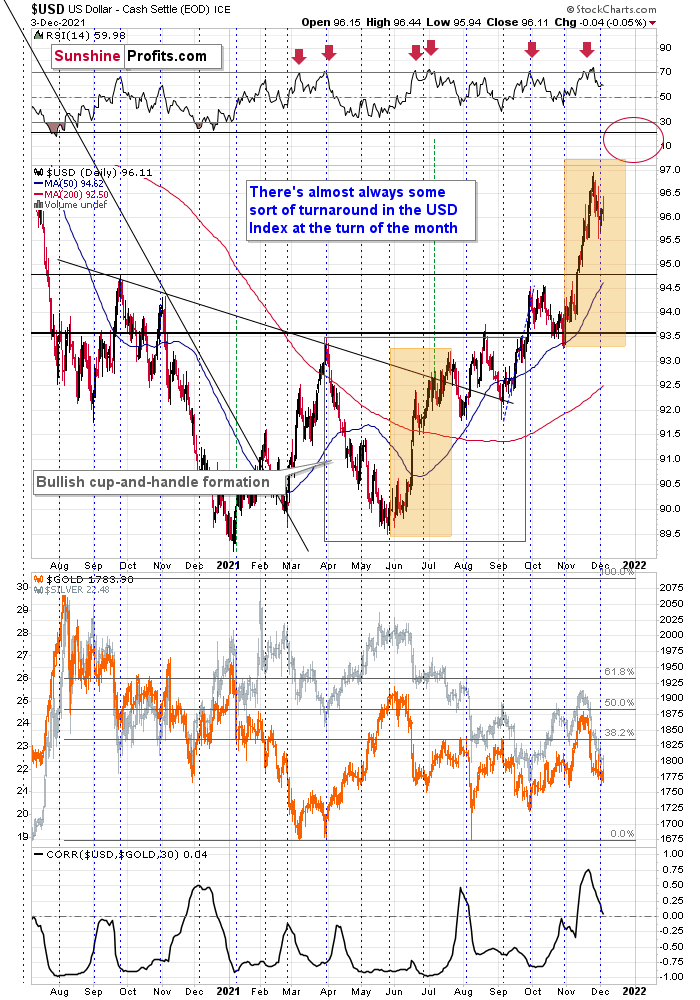
On top of that, while overbought conditions elicited a short-term pullback, end-of-month turnarounds and / or rallies are commonplace for the greenback.
For context, I warned that a consolidation was likely overdue by highlighting the USD Index’s overbought RSI (Relative Strength Index) readings with the red arrows above.
Conversely, the blue vertical dashed lines above demonstrate how the USD Index often bottoms near the end of each month, and rallies often follow. And while the current consolidation may need some more time to run its course, higher highs should materialize over the medium term.
To explain, after the USD Index recorded sharp rallies in June and July, consolidation phases unfolded before the uptrends continued. And while the secondary uprisings occurred at more moderate paces, the USD Index still managed to make new highs. As a result, ~98 should materialize during the winter months.
Furthermore, if the forecast proves prescient, the USD Index’s strength will likely usher gold back to its previous 2021 lows.
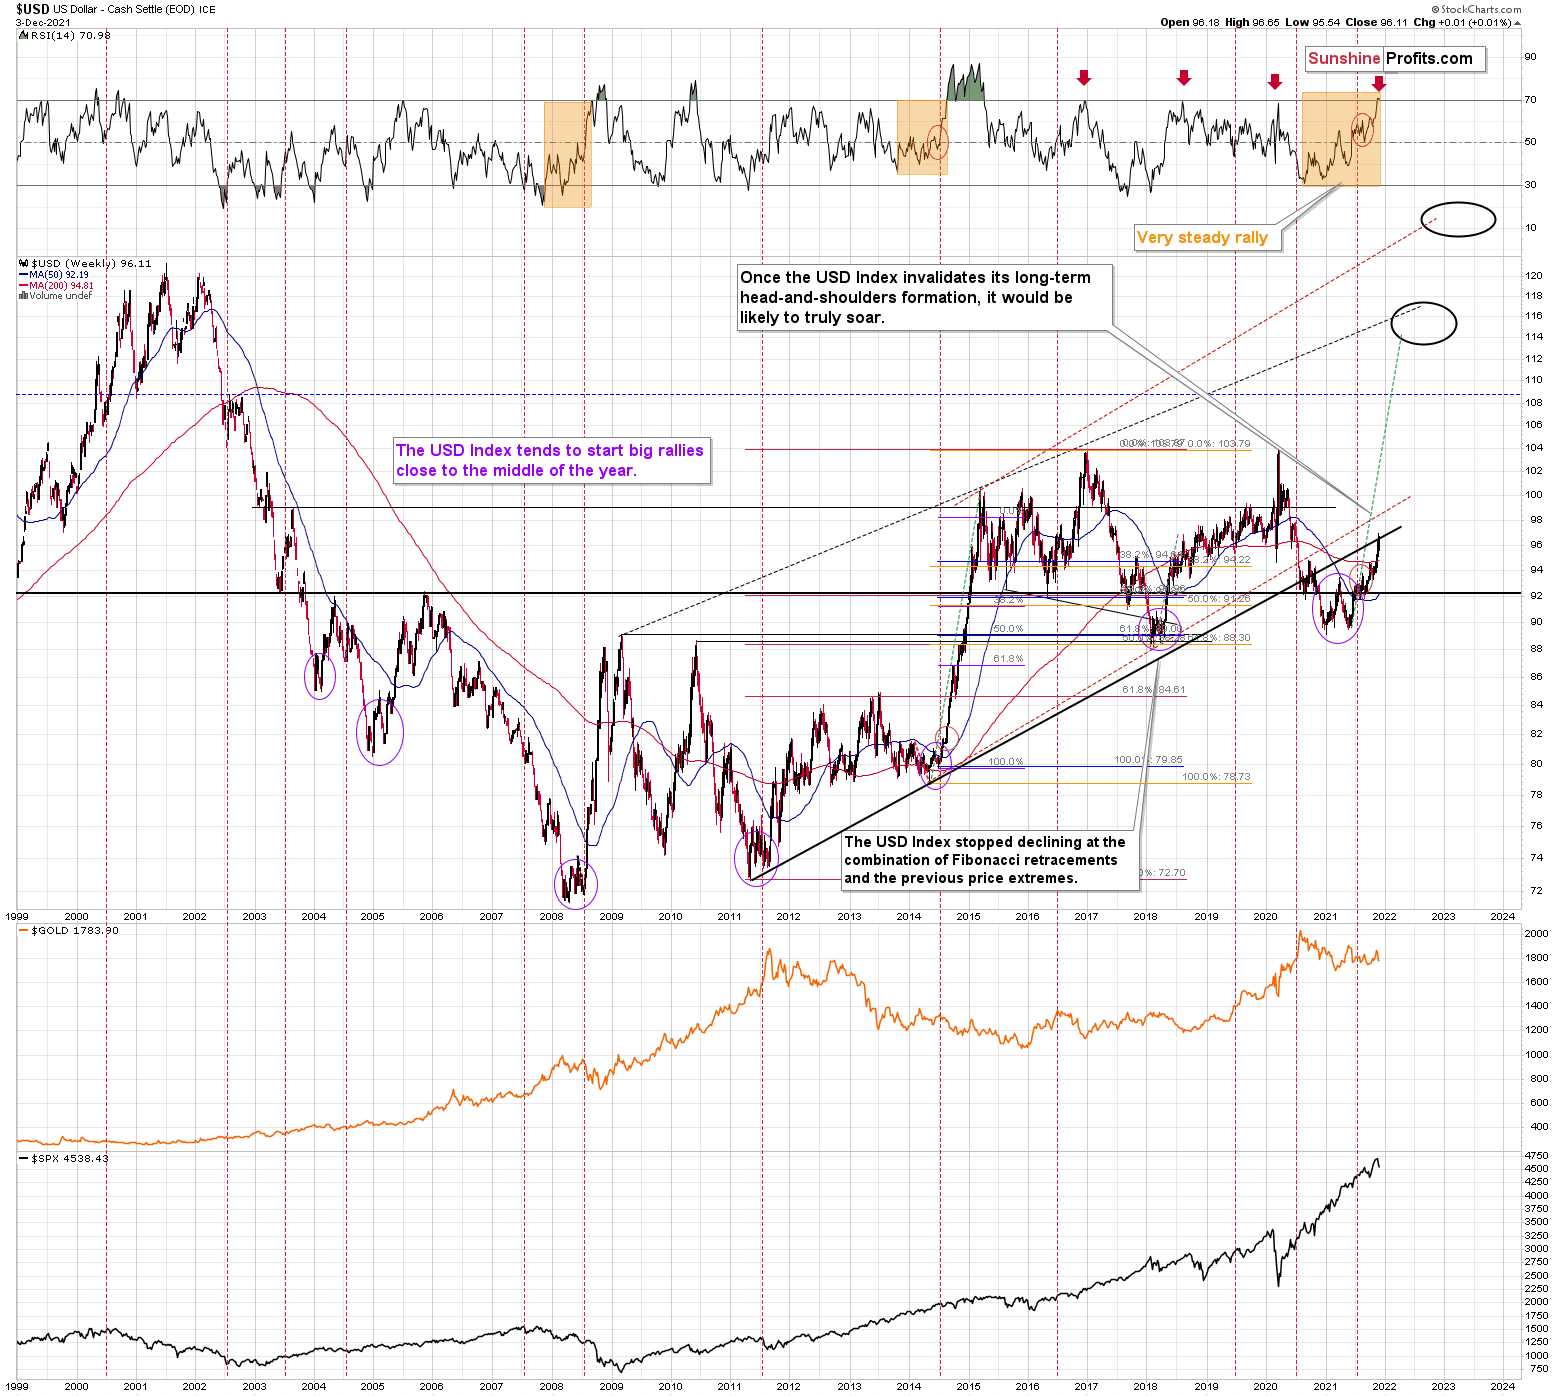
Adding to our confidence (don’t get me wrong, there are no certainties in any market; it’s just that the bullish narrative for the USDX is even more bullish in my view), the USD Index often sizzles in the summer sun and major USDX rallies often start during the middle of the year. Summertime spikes have been mainstays on the USD Index’s historical record and in 2004, 2005, 2008, 2011, 2014 and 2018 a retest of the lows (or close to them) occurred before the USD Index began its upward flights (which is exactly what’s happened this time around).
Furthermore, profound rallies (marked by the red vertical dashed lines below) followed in 2008, 2011 and 2014. With the current situation mirroring the latter, a small consolidation on the long-term chart is exactly what occurred before the USD Index surged in 2014. Likewise, the USD Index recently bottomed near its 50-week moving average; an identical development occurred in 2014. More importantly, though, with bottoms in the precious metals market often occurring when gold trades in unison with the USD Index (after ceasing to respond to the USD’s rallies with declines), we’re still far away from that milestone in terms of both price and duration. Again, the recent move higher in the USD Index doesn’t necessarily apply in the case of the above rule, as it was not the strength of the USD but weakness in the euro that has driven it.
Likewise, with the USD Index now approaching its long-term rising support line (which is now resistance), a rally above the upward sloping black line below would invalidate the prior breakdown and support a move back above 100.
Also, please note that the recent medium-term rally has been calmer than any major upswing witnessed over the last 20 years, where the USD Index’s RSI has hit 70. I marked the recent rally in the RSI with an orange rectangle and I did the same with the second-least and third-least volatile of the medium-term upswings.
The sharp rallies in 2008 and 2014 were of much larger magnitudes. And in those historical analogies, the USD Index continued its surge for some time without suffering any material corrections.
As a result, the short-term outlook is more of a coin flip. However, the medium-term outlook remains profoundly bullish, and gold, silver, and mining stocks may resent the USD Index’s forthcoming uprising.
Just as the USD Index took a breather before its massive rally in 2014, it seems that we saw the same recently. This means that predicting higher gold prices (or the ones of silver) here is likely not a good idea.
Continuing the theme, the eye in the sky doesn’t lie. And with the USDX’s long-term breakout clearly visible, the wind remains at the dollar’s back. Furthermore, dollar bears often miss the forest through the trees: with the USD Index’s long-term breakout gaining steam, the implications of the chart below are profound. And while very few analysts cite the material impact (when was the last time you saw the USDX chart starting in 1985 anywhere else?), the USD Index has been sending bullish signals for years.
Please see below:
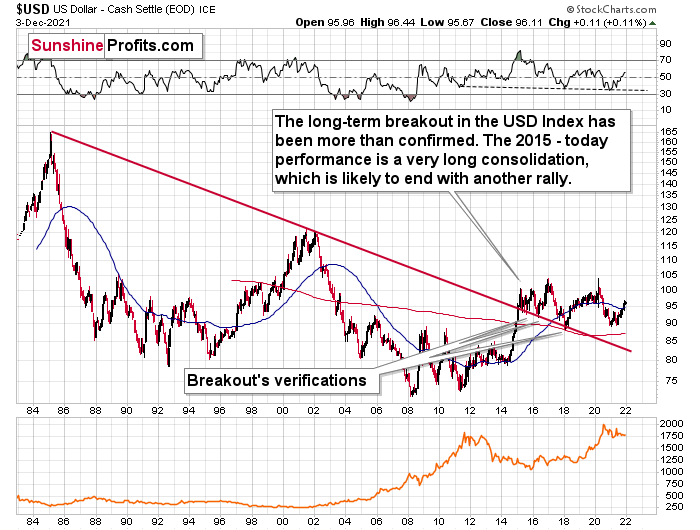
The bottom line?
With my initial 2021 target of 94.5 already hit, the ~98 target is likely to be reached over the medium term (and perhaps quite soon), mind, though: we’re not bullish on the greenback because of the U.S.’ absolute outperformance. It’s because the region is fundamentally outperforming the Eurozone, the EUR/USD accounts for nearly 58% of the movement of the USD Index, and the relative performance is what really matters.
In conclusion, gold, silver, and mining stocks have reversed sharply in recent weeks. And though the trio tried to ignore the USD Index’s recent uprising, I wrote on Jul. 23 that the time-tested relationship of ‘U.S. dollar up, PMs down’ will likely be a major storyline during the Autumn months. To that point, with the theme likely to continue over the medium term, lower lows should confront gold, silver, and mining stocks over the next few months.
Thank you for reading our free analysis today. Please note that the above is just a small fraction of the full analyses that our subscribers enjoy on a regular basis. They include multiple premium details such as the interim targets for gold and mining stocks that could be reached in the next few weeks. We invite you to subscribe now and read today’s issue right away.
Sincerely,
Przemyslaw Radomski, CFA
Founder, Editor-in-chief -
Early (Gold Video) Heads-up before the Next Week
December 4, 2021, 12:17 PMIn today’s early heads-up video, I’m talking about yesterday’s rally in gold, what it changed and, most importantly, what it didn’t change. Did you know that gold price declined by just $1.60 last week (0.09%)? Gold stocks (the HUI Index) declined by almost 4%! Let’s just say that the forecast for gold price is not that bullish at this time…
You can access the video using the following link:
-
Mining Stocks - “Soooo Oversold” You Say? Well, No
December 3, 2021, 7:36 AMThe general stock market moved higher by 1.42% yesterday, and one would have thought that it would trigger a rally in mining stocks as well – after all, the latter are “soooo oversold” right now, right?
Well, no.
The GDX ETF declined by 1.20% yesterday, and there were actually just 12 sessions this year when the GDX closed the day at lower levels.
On Wednesday, gold was up, while stocks (S&P 500) were down significantly, and the GDX declined significantly.
Yesterday (on Thursday), gold was down, while stocks (S&P 500) were up significantly, and the GDX declined visibly anyway.
If we take the last two trading days into account, the GLD is down by a mere $0.26 (0.16%), while the SPY ETF (a proxy for stocks) is up by 1.84 (0.4%). Since gold miners are mostly influenced by gold, but also – temporarily – by stocks, one could have expected the GDX to be more or less flat over the last 2 days.
The GDX ETF declined by $1.34, which is 4.4%, and the GDXJ ETF declined by $2.09, which is 5.15%.
So much for the bullish narrative for 2021.
Is a rebound coming?
Well, the RSI at about 30 would suggest so, but please note that this could mean just a slight pause, and not necessarily a rebound that is big enough to be worth trading. We saw something like that in June, for example. The RSI moved below 30, but the GDX itself moved only slightly higher and then the decline continued.
So, a rebound might be coming, but it might as well not be coming, at least not right now. A meaningful rebound might not be here until gold reaches its previous 2021 lows. Why would it be the case (other than the fact that I’ve been writing about that for many weeks and emphasized the reasoning behind it in multiple flagship Gold & Silver Trading Alerts)?
To clarify, my reasons (that I’ve been going over and over again) are what’s likely to initially make gold slide to its previous lows. Afterwards, we might (!) see a corrective upswing and then another – huge – wave down.
But why would one think that the slide to the previous 2021 lows is about to start now or shortly?
Because of gold’s breakdown!
The gold price declined by $21.60 yesterday, and it closed visibly below the rising support line. The breakdown is not confirmed yet, but since gold broke lower without any meaningful movement in the USD Index, it’s likely that the breakdown was a true one, and that it will indeed be confirmed.
Also, let’s keep in mind the extremely bearish situation in world stocks.
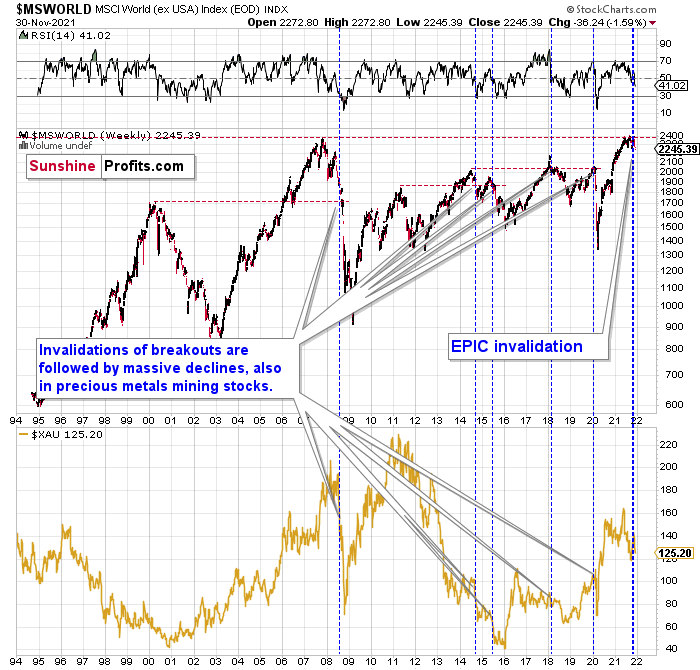
My Tuesday’s comments on the above chart remain up-to-date:
Something truly epic is happening in this chart. Namely, world stocks tried to soar above their 2007 high, they managed to do so and… they failed to hold the ground. Despite a few attempts, the breakout was invalidated. Given that there were a few attempts and that the previous high was the all-time high (so it doesn’t get more important than that), the invalidation is a truly critical development.
It's a strong sell signal for the medium- and quite possibly for the long term.
From our – precious metals investors’ and traders’ – point of view, this is also of critical importance. All previous important invalidations of breakouts in world stocks were followed by massive declines in the mining stocks (represented by the XAU Index).
Two of the four similar cases are the 2008 and 2020 declines. In all cases, the declines were huge, and the only reason why they appear “moderate” in the lower part of the above chart is that it has a “linear” and not “logarithmic” scale. You probably still remember how significant and painful (if you were long that is) the decline at the beginning of 2020 was.
Now, all those invalidations triggered big declines in the mining stocks, and we have “the mother of all stock market invalidations” at the moment, so the implications are not only bearish, but extremely bearish.
What does it mean? It means that it is time when being out of the short position in mining stocks to get a few extra dollars from immediate-term trades might be risky. The possibility that the omicron variant of Covid makes vaccination ineffective is too big to be ignored as well. If that happens, we might see 2020 all over again – to some extent. In this environment, it looks like the situation is “pennies to the upside and dollars to the downside” for mining stocks. Perhaps tens of dollars to the downside… You have been warned.
Thank you for reading our free analysis today. Please note that the above is just a small fraction of the full analyses that our subscribers enjoy on a regular basis. They include multiple premium details such as the interim targets for gold and mining stocks that could be reached in the next few weeks. We invite you to subscribe now and read today’s issue right away.
Sincerely,
Przemyslaw Radomski, CFA
Founder, Editor-in-chief


Gold Investment News
Delivered To Your Inbox
Free Of Charge
Bonus: A week of free access to Gold & Silver StockPickers.
Gold Alerts
More-
Status
New 2024 Lows in Miners, New Highs in The USD Index
January 17, 2024, 12:19 PM -
Status
Soaring USD is SO Unsurprising – And SO Full of Implications
January 16, 2024, 8:40 AM -
Status
Rare Opportunity in Rare Earth Minerals?
January 15, 2024, 2:06 PM

