

Briefly: In our opinion, short positions (full position) in gold, silver and mining stocks are justified from the risk/reward perspective. We are moving the stop-loss levels, though, and we’re moving them below the entry prices, so we are effectively locking in profits, while at the same time letting them grow.
Gold, silver and mining stocks moved back and forth yesterday, but there was no meaningful rebound in any of them. No wonder – as we discussed yesterday, gold didn’t reach any of its key support levels. Consequently, we have little to comment on in terms of price changes – everything that we wrote previously remains up-to-date.
In yesterday’s alert we replied to 2 key questions that we had received from quite a few subscribers and in today’s alert we’ll provide our replies to a few additional ones as they may be important for all subscribers.
Still, before we proceed, let’s take a look at gold’s chart (charts courtesy of http://stockcharts.com).
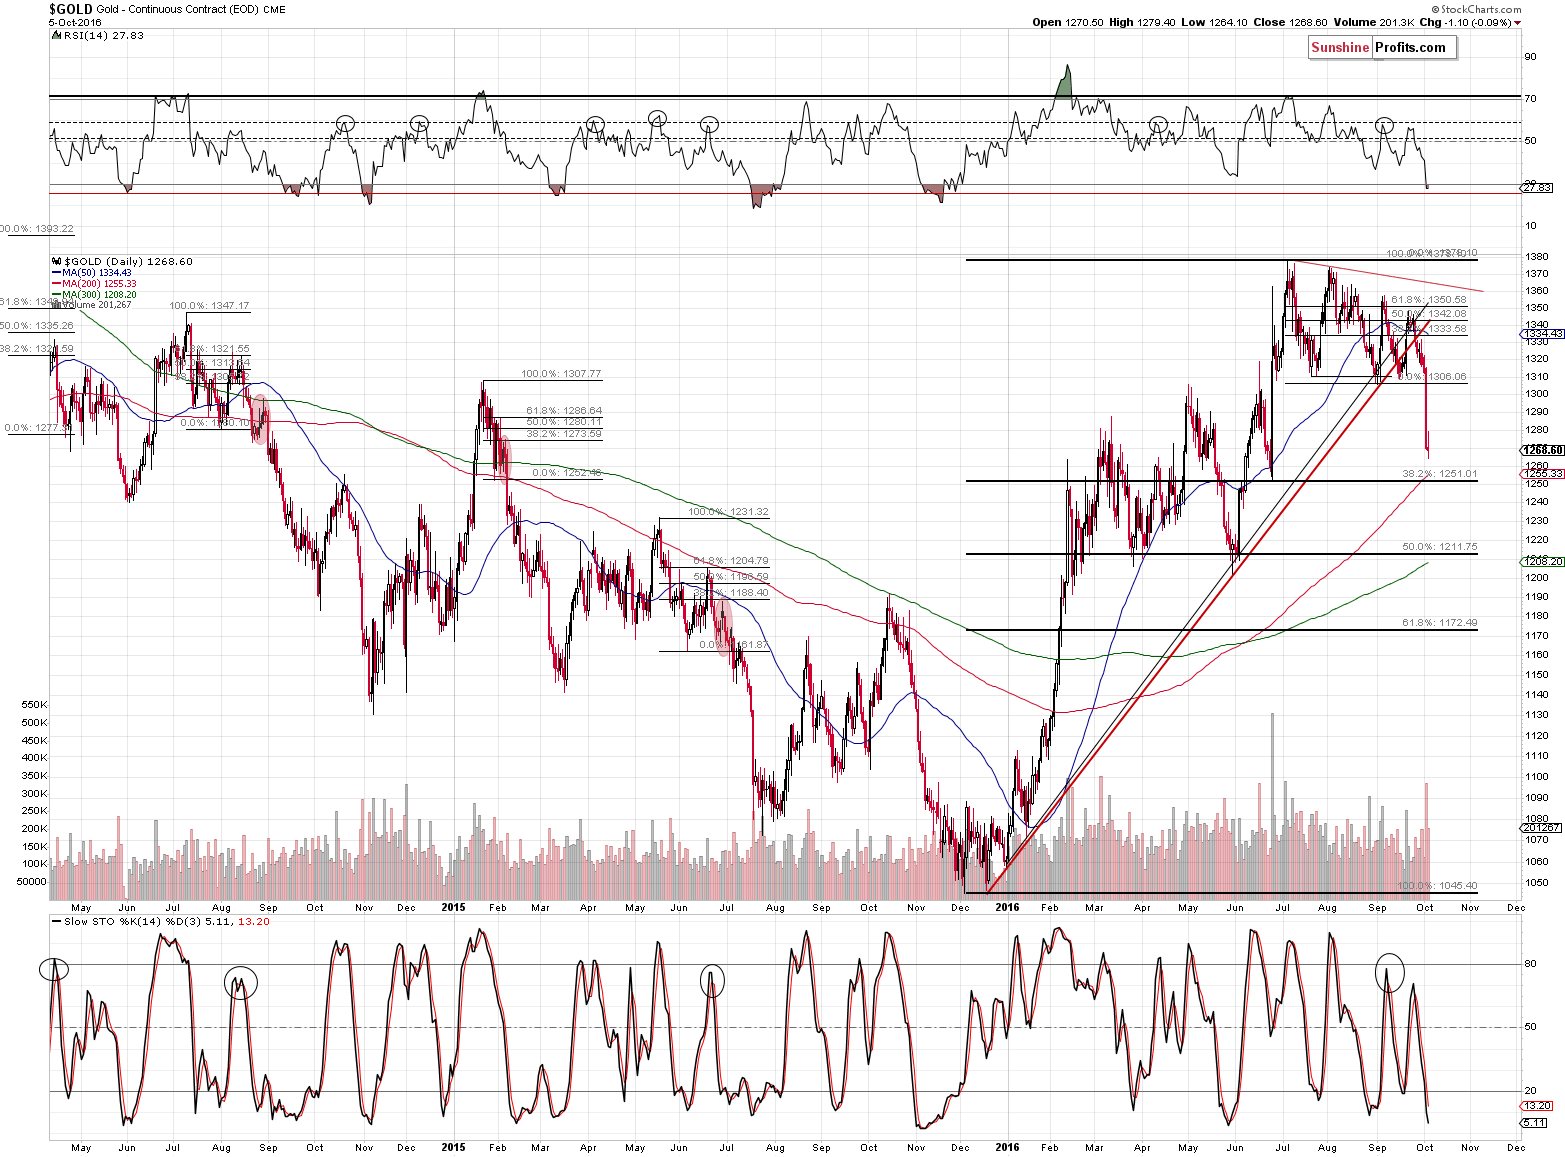
As indicated above, gold moved both lower and higher, ending the session a bit lower. The volume was not huge, which suggests that the session was not an important reversal, but rather a pause after a big move.
Having said that, let’s move to questions and our replies.
Q: Good Afternoon P.R.
Since it seems that gold has a very long way to fall until the final bottom is in. when is it justified to raise the position size to 150%?? If gold is going below 1000 and mining stocks to 9.00 gdx? I realize this is NO WAYa guaranteed but you have had position sizes at 150% before. Thank you
A: Unfortunately, it depends on too many combinations of factors too mention them all. The long-story-short reply is that we may increase the size of the position to 150% of the regular position when we see additional bearish confirmations and their number is be huge. Just several days ago we were waiting for silver’s outperformance and since we finally saw it, we opened short positions (as several other factors had already been indicating lower PM prices). If we had seen even more bearish signs at that time, we would have already increased the positions to 150% - but we didn’t. Since we already have a decline in PMs and miners, we will likely not see silver’s outperformance again in the nearest future.
One scenario that we would like to take place (and it is somewhat likely, but we’re not making it our official prediction) is a sharp decline to about $1,200 and a rally back to $1,250 or so. The end of the rally could be accompanied by all sorts of bearish confirmations and indications of a reversal. If the above happens, we might – depending on the number of bearish signals and their strength – increase the size of the short positions beyond 100%.
Q: Why the Correlation Matrix does not show Gold / OIL correlation. Oil can also be a driver of the gold prices
A: After investigating both markets, it seems to us that the relationship between them is too unstable and can be misleading for extended periods - like is currently the case. Gold and crude oil should theoretically move together, but instead they move in the opposite directions - gold is down this week while crude oil moved higher (and at the same time – until yesterday – we had long positions in crude oil and short position in PMs; yesterday we took profits from the long positions in crude oil). Consequently, we’ll stick to the links that proved useful in the previous years and seem more stable (like gold vs the USD and gold stocks vs gold).
Q: What do you figure gold and miners will do when Deutsche Bank collapses?
A: It would likely depend on what would be the reason for DB's collapse and what would follow. The initial reaction could be positive but if it means a run for liquidity like was the case in 2008, gold and miners could collapse - just like in 2008.
Q: I obviously do not understand how these things work. If DUST were to increase from approx. $36 to $297 that would be approx. a 700% increase. I thought DUST was supposed to go up three times as much as GDX went down, but nothing can decrease more than 100%, so how could this happen?
A: DUST reflects daily changes in GDX – times 3. If GDX declines by 1% from $30, then it costs $29.7 on the next day. If this continues (GDX keeps declining by 1% each day), here’s how the values would look like:
Day 1: $30
Day 2: $29.70
$29.40
$29.11
$28.82
$28.53
$28.24
$27.96
$27.68
$27.41
$27.13
$26.86
$26.59
$26.33
$26.06
$25.80
$25.54
$25.29
$25.04
$24.79
$24.54
$24.29
$24.05
$23.81
$23.57
$23.33
$23.10
$22.87
$22.64
$22.42
$22.19
$21.97
$21.75
$21.53
$21.32
$21.10
$20.89
$20.68
$20.48
$20.27
$20.07
$19.87
$19.67
$19.47
$19.28
$19.09
$18.89
$18.71
$18.52
$18.33
$18.15
$17.97
$17.79
$17.61
$17.43
$17.26
$17.09
$16.92
$16.75
$16.58
$16.41
$16.25
$16.09
$15.93
$15.77
$15.61
$15.45
$15.30
$15.15
$15.00
$14.85
$14.70
$14.55
$14.40
$14.26
$14.12
$13.98
$13.84
$13.70
$13.56
$13.43
$13.29
$13.16
$13.03
$12.90
$12.77
$12.64
$12.51
$12.39
$12.26
$12.14
$12.02
$11.90
$11.78
$11.66
$11.55
$11.43
$11.32
Day 99: $11.20
Day 100: $11.09
After 100 days of decreases by 1%, the price is not $0, but about 1/3 of the initial price. Why? Because on each following day this 1% is based on a lower value. 1% of $30 is $0.3, but 1% of 13.03 is about $0.13.
Consequently, even though GDX can’t drop more than 100% altogether, it can decline by 1% for much more than 100 days. The price of DUST would therefore depend not only on how high or low GDX moves, but also on the way it gets there.
Q: Dear Team, Dear Mr Radomski, First of all, i want to thank you all for your great effort and upon all your super great service, your analysis are such a tool that add real value to the investment. I am a new but real admirer of your service. Once again, yesterday signal was short, and we saw a big rally on gold... i have experience trading for some times, but sometimes the human side of myself makes me do mistake even though i was on the right track. Could you share any tips that will keep me from doing errors on my trading? I was short in XAU since 1316 since your signal from last friday, i had great profit until 1304, when the market moved down to 1297 and stop there a a little while, the human nature of myself made me enter a long position, thinking that after such a big down there will be a rebound... what a stupid thing i did, and i cried all night about it, my break even price no is at 1285, running price at this email is 1268, there is a gap of 20 points, do you think price could get to my break even point ? Do you think this can happen before this week NFP? Do you have a method or shared experience that could take away bad decision out of the human emotion. Can you please reply to my email please, i am in a state of mind that is very bad now, and i am scared that i make even more bad decision. Again, I do know this is entirely my own fault, and that your service provide such a high level of expertise. Looking forward to reading from you. An admired client of your service. Best Regards
A: Thank you for the feedback, I really appreciate it. Regarding the tips for trading, some time ago I wrote a text for an entire section with them:
http://www.sunshineprofits.com/gold-silver/gold-trading-tips/
There's a lot of them and the most important one is the first one - don't overdo it with position sizes. That's particularly difficult after a series of profitable trades when one feels invincible. Keeping the trades reasonable is the way to go - big losses will result from some big trades and it's hard to recover from them.
The second thing is to... well... Chill out. The more stressed you are about a trade, the more the odds are against you making profits. It seems that yesterday you focused on gains and losses and were afraid to lose the gains. Instead, if you focus on what the outlook is and what the targets are, you would not care much about a $10 correction or so.
The second thing about "chilling out" is accepting that there will be losses from time to time - even a few times in a row. That's just part of the trading and if you can't avoid it (nobody can), it's better to just accept it. Keeping the positions small makes it much easier.
Another thing that might be of interest to you is portfolio structuring. If you dedicate a lot of capital to trading and leave little or nothing to long-term investments, then it makes the risk in your entire portfolio rather significant. It also makes you emotional (which appears to be the case). You will find details here: http://www.sunshineprofits.com/gold-silver/key-insights/gold-portfolio/ but long story short - the trading part of the portfolio is supplementary and it is the long-term investment part that is the core (in my opinion, it’s critical – that’s where the biggest money will likely be made in the coming years). Again, you will find details in the mentioned report.
Q: Hi Przemyslaw,
Great call on gold and silver just before the drop yesterday. All your subscribers that put the short trade on are in good potenual profits now. Please can you let me know what would happen to gold if there is a sharp drop in the US stock indices as the markets are coralated at the moment. In the past I have seen gold go up sharply and offcourse go down sharply just like in 2008? (Not that we expect another 2008 magnitude event now).
Thank-you,
Best regards,
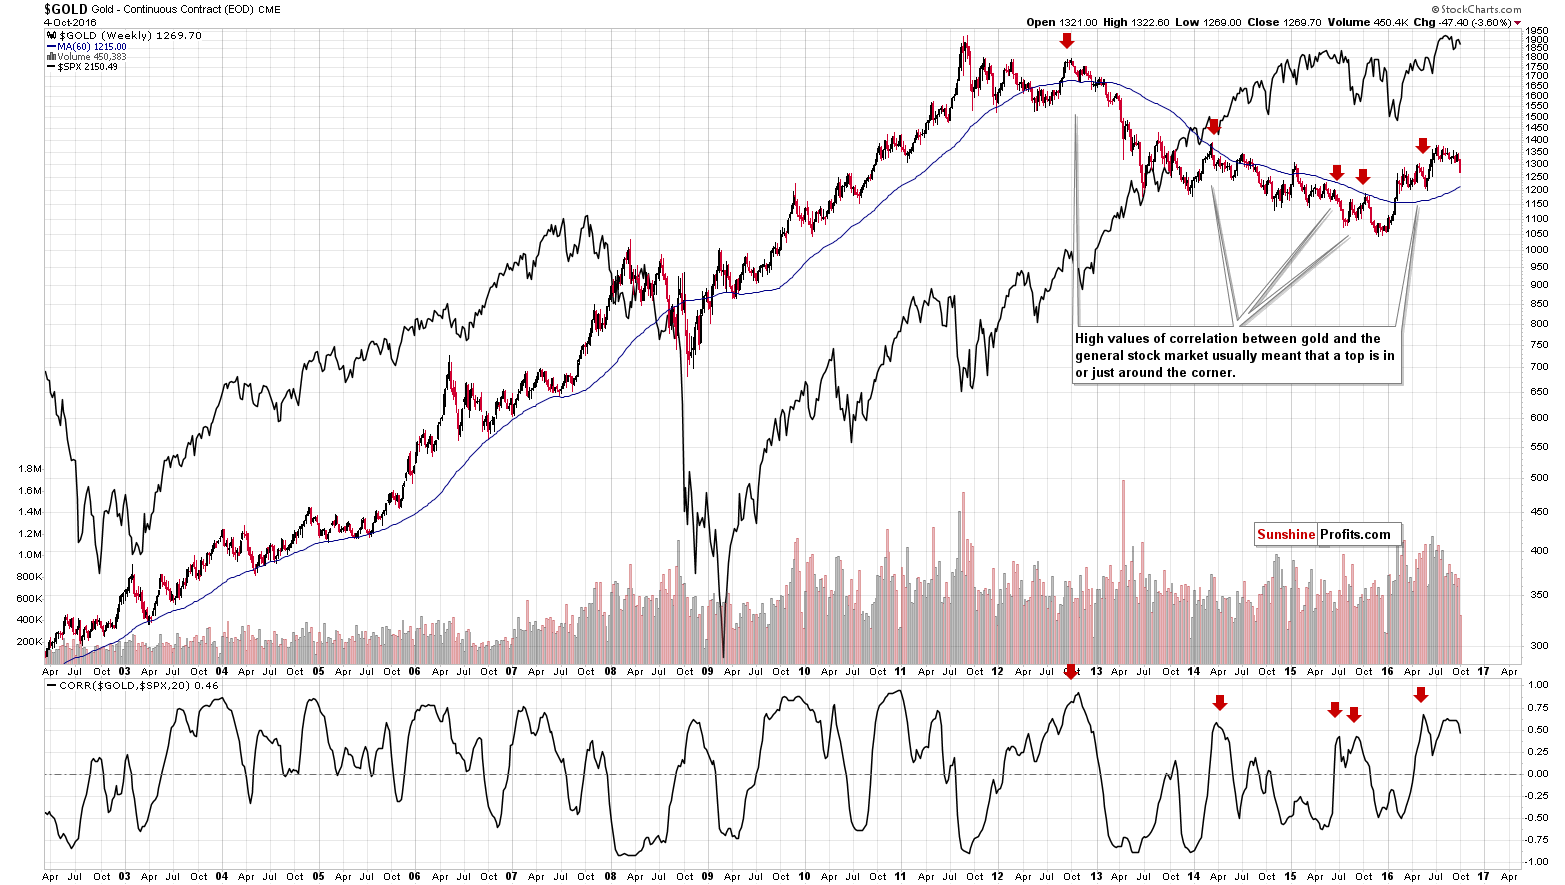
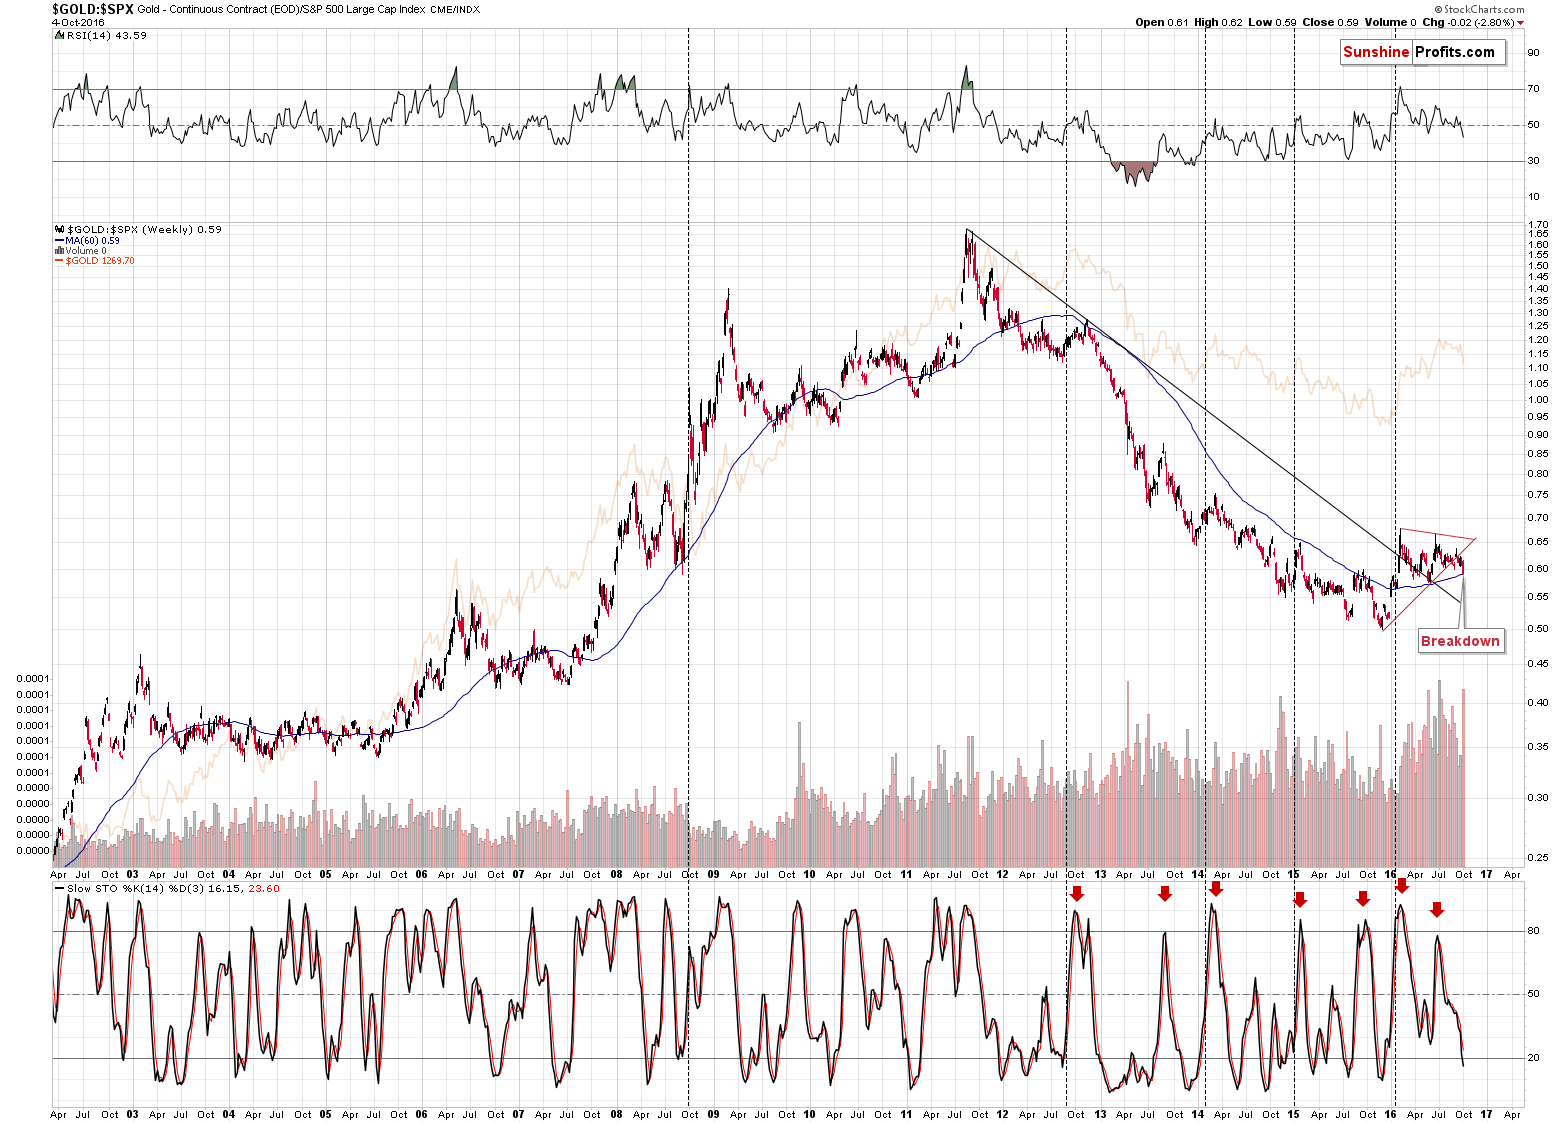
A: Thanks for the message! I think that it would be possible and likely for gold and U.S. stocks to decline at the same time. In the previous cases when gold was highly correlated with stocks, tops in both quite often followed. I'm attaching 2 charts - I marked tops in correlation with red arrows. The interesting thing (the second chart) is that the gold to stocks ratio is after an important breakdown. Consequently, if both gold and stocks were to fall, gold would likely fall first and / or more significantly. That's what appears more likely, in my opinion, based on the data that we have now. I'll keep you updated via the alerts. Thanks again!
Q: This question is for Mr. P.
I cannot at all understand where he is coming from in the latest alert. He writes about gold reaching $900. Rally drop, rally drop. Gold has ended a long correction , called an extended running flat. At the moment gold bottomed in Dec 2015 and has moved up and broken to the upside. Confirmed. Presently looking at the 08-09 correction we are at or about Oct 09. Back then we had a similar consolidation before the bull resumed. I expect the same this time. The next move should take us to 1570 or better before a 1/3 correction, if that.. I just cannot see the logic at all of what he is trying to explain! It must just be his own analysis. If the bottom is in, and it is IN then how are we going to $900 gold? $ 2000 gold is more likely, especially by January 2017, than $900 . The 6 yr. extended running flat is over. In all due respect this is still a good report and with great detailed charts but I feel the shorts will have to pull up their pants and run, soon.
A: The reply to this question will require an introduction. The large part of the question is based on the assumption that the bottom is in, but is it really the case?
In our opinion, technical developments are what reflects the market participants’ emotions, approach and willingness to push the market higher or lower. It is the emotionality that is the first and foremost thing that we are taking into account and the technical signs are only important as much as they reflect what’s really going on.
Knowing what’s going on “behind the price and volume moves” helps (or even allows) to know what really happened and what implications can be drawn from a specific action. For instance, on August 23, we discussed a reversal in gold and we argued that it wasn’t a reversal despite it looked to be such based on price alone. We explained why we look at reversals at all and what makes us view one as bullish or bearish and what should confirm it – and why. It turned out that reversal wasn’t a reversal at all.
Comparing the above paragraph to focusing on a “tree”, let’s now focus on the “forest”.
Why do bull markets end? Because there are too many buyers, everyone loves the asset and thinks that it will rally much higher. Finally, the market gets ahead of itself. Speculators have to be shaken off before the bull market can resume. The above is true for short-, medium- and long-term rallies, but the latter are generally characterized by another key thing – markets tend to move to the exact opposite of the above – everyone hates the asset and thinks that the price will continue to decline. The decline gets ahead of itself as the price moves to extreme lows. Then a true bottom is formed.
Back in late 2015, we were monitoring the analysts’ and investors’ views on gold (including various price surveys, gold-related headlines etc.; on a side note the survey on our Twitter page shows almost 80% optimism as far as the price of gold is concerned). There was not a single day when the vast majority of people really hated gold and thought that it would only move lower. People were still optimistic. That’s not what the end of a major decline is likely to look like.
Consequently, the final bottom for this decline is most likely not in. If we had seen a number of major bullish confirmations, we might have thought that the big decline was already over and that it had ended in an unlikely fashion – but we haven’t seen them so far.
Gold rallied to the $1,300 - $1,400 range, just like was the case in mid-2013, early 2014, and early 2015. This rally was longer than the previous ones, but that’s not enough to think that this is indeed the beginning of another major upleg in gold, especially that 2 unexpected events took place and somewhat artificially boosted gold’s price on a short-term basis. We discussed that in greater detail on September 5th, but long story short – if it hadn't been for Yellen’s brief mention of negative rates (which she had to do given how the question was structured) and the unlikely outcome of the Brexit vote (up to this day the UK is still in the EU), gold would have likely rallied only to $1,210 or $1,145 depending on which analogy we use. The entire 2016 rally would be another usual correction within a big decline.
Should 2 unexpected events really change the big picture? No.
Still, what happened technically? Gold rallied up to the first of the classic Fibonacci retracement levels – the 38.2% retracement. By technical means, this is a correction within a trend, not a proof of a beginning of another big uptrend.
Consequently, we respect each investors’ views and we also respect the decision for one to think that the final bottom in gold is already in, but we disagree. We think that this scenario and the final bottom in gold are far from being confirmed - just like Marcellus Wallace was far from being OK in one of the scenes in Pulp Fiction.
Q: PR,
I don't understand why gold's initial target price is $1,006, when it hasn't gone through the $1,250 or $1,200 levels. I thought the initial price target was for the current trade, which would put it somewhere around $1.250.
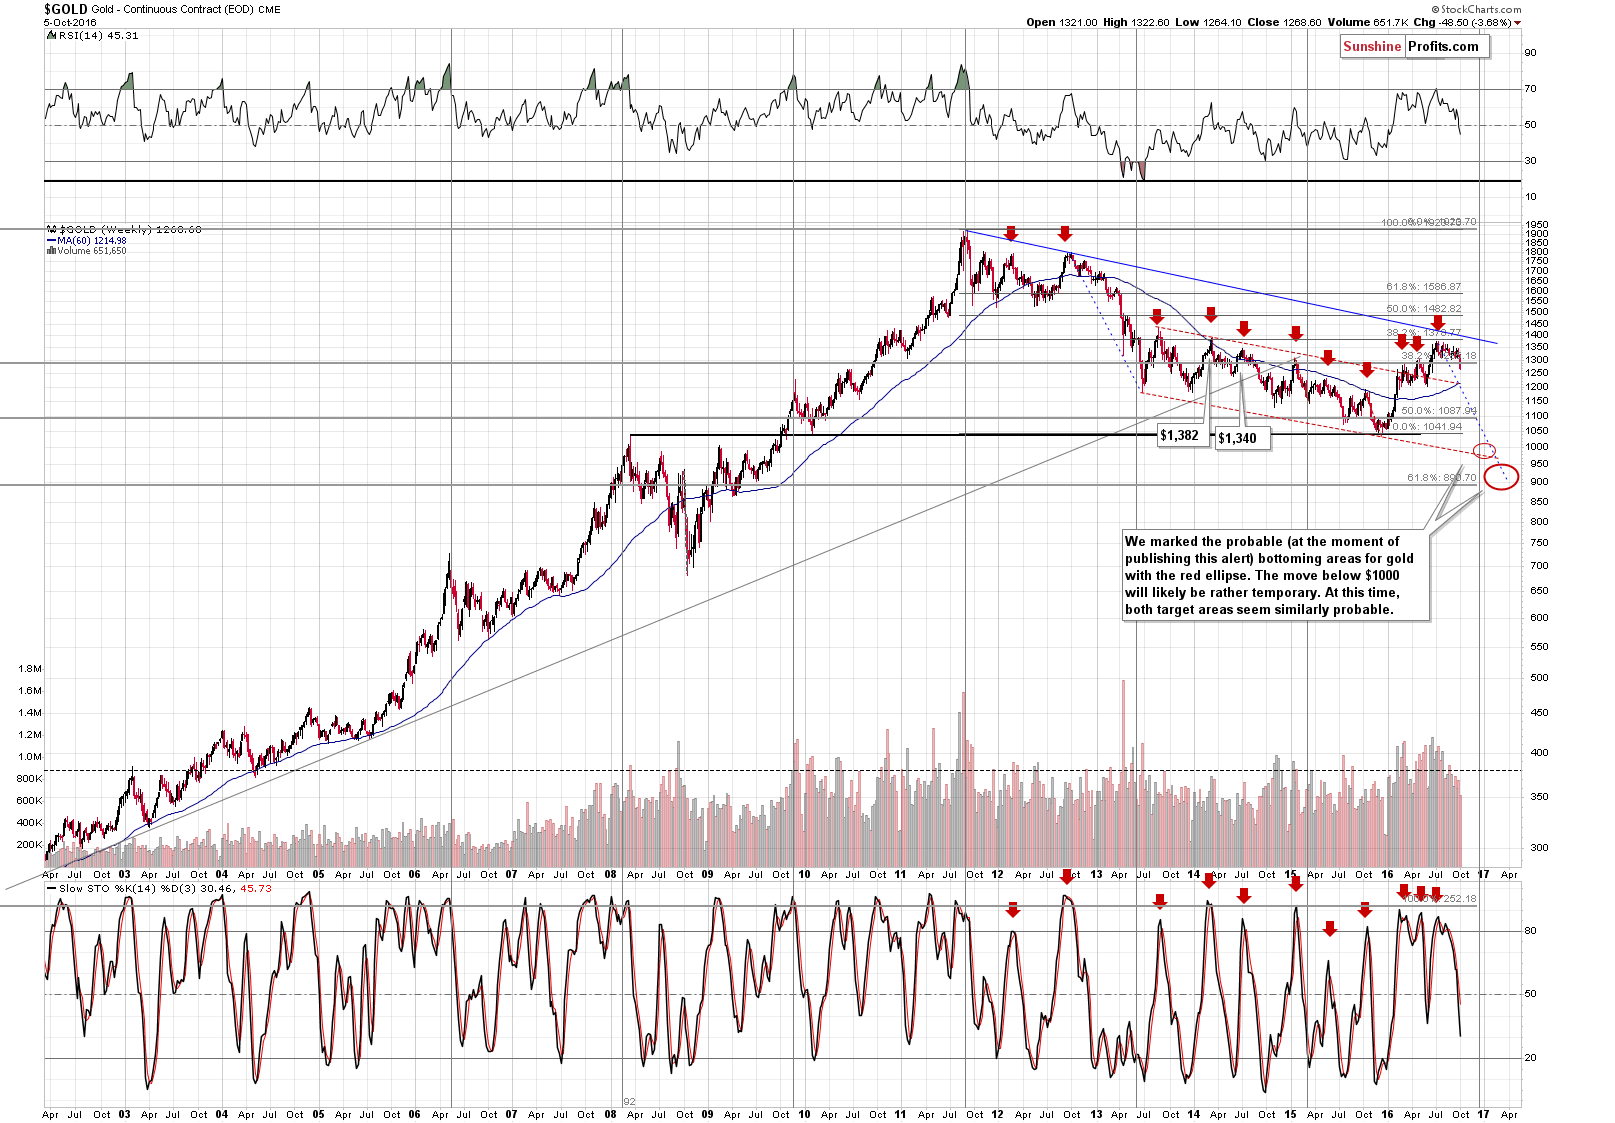
A: The reason is that while we are discussing the possibilities of rebounds and actions that we might take given proper confirmations, it is not clear that we will see them. The big move that we are aiming to profit on is the slide below $1,000 and we chose the price a few dollars above it as a conservative estimate. The above does not imply that we will stick to this trade or the target price in the following months – it will all depend on the circumstances. The point, however, is to show what size of a move lower we have generally in mind (not a $30 decline or something similar, but a big move to the downside).
Q&A: We also received a question about the Elliott Wave analysis, but this kind of analysis is so subjective and based on one’s own interpretation of the price of a given asset (sometimes the volume as well, but usually it’s just the price that is discussed) that we can’t really comment on it. In our view, more should be done to carefully analyze a given market than comparing the price patterns to a pre-defined model. This could work at times (like the past several months or so), but other approaches are likely to outperform over the long term. Of course one could aim to combine EWT (and we mean no disrespect to those practicing EWT) and other approaches, but we have found it most useful to apply parts of EWT and at the same time not to be overly concerned about how all waves need to play out. For instance, gold and mining stocks tend to correct in a zig-zag (ABC) fashion, but we think that it’s more useful to look for self-similar patterns in each market (in gold, silver, miners separately) and apply what has specifically proved to repeat over time, rather than to apply a “given” model that each of these markets “should” follow.
Summing up, it’s likely that the profits on the current short trade will become much bigger before the trade is completely over and “the bottom” is in. There will likely be interim bottoms along the way, but the closest likely target is still $20 lower (in gold). If gold slides through this level and gets to $1,200, we may have a good opportunity to take profits off the table and re-enter the short position at higher prices. We will be monitoring the market for opportunities and report to you accordingly.
We are moving the stop-loss levels, though, and we’re moving them below the entry prices, so we are effectively locking in profits, while at the same time letting them grow.
The above alert is quite large and it took quite some time to write and since we started the price of gold has managed to slide to about $1,253 – our take on this decline is that it’s in tune with the outlook and since the decline by itself is neither a bearish nor bullish sign at this time, we are not adjusting the current positions (besides the mentioned changes in stop-loss details). Based on how the session develops, we can either have bullish or bearish confirmations and we’ll keep you informed, should we see any significant ones (most likely we’ll either see no important signals or short-term bullish ones).
As always, we will keep you – our subscribers – updated.
To summarize:
Trading capital (supplementary part of the portfolio; our opinion): Short positions (100% of the full position) in gold, silver and mining stocks are justified from the risk/reward perspective with the following entry prices, stop-loss orders and initial target price levels:
- Gold: initial target price: $1,006; stop-loss: $1,313, initial target price for the DGLD ETN: $73.19; stop-loss for the DGLD ETN $44.28
- Silver: initial target price: $13.12; stop-loss: $19.03, initial target price for the DSLV ETN: $39.78; stop-loss for the DSLV ETN $20.43
- Mining stocks (price levels for the GDX ETF): initial target price: $9.34; stop-loss: $25.87, initial target price for the DUST ETF: $297; stop-loss for the DUST ETF $34.78
In case one wants to bet on junior mining stocks' prices (we do not suggest doing so – we think senior mining stocks are more predictable in the case of short-term trades – if one wants to do it anyway, we provide the details), here are the stop-loss details and initial target prices:
- GDXJ ETF: initial target price: $14.13; stop-loss: $43.22
- JDST ETF: initial target price: $245; stop-loss: $25.47
Long-term capital (core part of the portfolio; our opinion): No positions
Insurance capital (core part of the portfolio; our opinion): Full position
Plus, you might want to read why our stop-loss orders are usually relatively far from the current price.
Please note that a full position doesn’t mean using all of the capital for a given trade. You will find details on our thoughts on gold portfolio structuring in the Key Insights section on our website.
As a reminder – “initial target price” means exactly that – an “initial” one, it’s not a price level at which we suggest closing positions. If this becomes the case (like it did in the previous trade) we will refer to these levels as levels of exit orders (exactly as we’ve done previously). Stop-loss levels, however, are naturally not “initial”, but something that, in our opinion, might be entered as an order.
Since it is impossible to synchronize target prices and stop-loss levels for all the ETFs and ETNs with the main markets that we provide these levels for (gold, silver and mining stocks – the GDX ETF), the stop-loss levels and target prices for other ETNs and ETF (among other: UGLD, DGLD, USLV, DSLV, NUGT, DUST, JNUG, JDST) are provided as supplementary, and not as “final”. This means that if a stop-loss or a target level is reached for any of the “additional instruments” (DGLD for instance), but not for the “main instrument” (gold in this case), we will view positions in both gold and DGLD as still open and the stop-loss for DGLD would have to be moved lower. On the other hand, if gold moves to a stop-loss level but DGLD doesn’t, then we will view both positions (in gold and DGLD) as closed. In other words, since it’s not possible to be 100% certain that each related instrument moves to a given level when the underlying instrument does, we can’t provide levels that would be binding. The levels that we do provide are our best estimate of the levels that will correspond to the levels in the underlying assets, but it will be the underlying assets that one will need to focus on regarding the signs pointing to closing a given position or keeping it open. We might adjust the levels in the “additional instruments” without adjusting the levels in the “main instruments”, which will simply mean that we have improved our estimation of these levels, not that we changed our outlook on the markets. We are already working on a tool that would update these levels on a daily basis for the most popular ETFs, ETNs and individual mining stocks.
Our preferred ways to invest in and to trade gold along with the reasoning can be found in the how to buy gold section. Additionally, our preferred ETFs and ETNs can be found in our Gold & Silver ETF Ranking.
As always, we'll keep you - our subscribers - updated should our views on the market change. We will continue to send out Gold & Silver Trading Alerts on each trading day and we will send additional Alerts whenever appropriate.
The trading position presented above is the netted version of positions based on subjective signals (opinion) from your Editor, and the Tools and Indicators.
As a reminder, Gold & Silver Trading Alerts are posted before or on each trading day (we usually post them before the opening bell, but we don't promise doing that each day). If there's anything urgent, we will send you an additional small alert before posting the main one.
=====
Latest Free Trading Alerts:
There is only one month left before the U.S. presidential election. What are the current odds of both candidates and what do they mean for the gold market?
Gold One Month before U.S. Presidential Election
Earlier today, the U.S. Department of Labor reported that the number of initial jobless claims in the week ending Oct1 dropped by 5,000, beating analysts’ forecasts. As a result, the British pound extended losses against the greenback and hit a fresh multi-year lows. How low will the exchange go in the coming days?
Forex Trading Alert: GBP/USD Hits Fresh Lows
S&P 500 index continues to trade within a short-term consolidation following its mid-September rebound. Is this a topping pattern or just flat correction before another leg up? Is holding short position justified?
=====
Hand-picked precious-metals-related links:
PRECIOUS-Gold slips on stronger dollar ahead of U.S. jobs data
Investors Covet Gold Miners Once More in Search for Yield
Fed Hike Shouldn’t Shake Faith in Gold, Says Mining Chief
2016 gold uptrend ‘severed’: Commerzbank
=====
In other news:
Deutsche Bank’s $14 Billion Scare
Europe Stocks Erase Gains on Stimulus Concerns While Banks Rise
Pound Rally Didn’t Last Long as Brexit Concern Sparks Selling
RAY DALIO: There is a 'big squeeze' coming
Nobel laureate Stiglitz sees Italy, others leaving euro zone in coming years
BOJ Governor Kuroda: Don't expect JGB supply to run out for QE
Switzerland's Central Bank Offers a Glimpse Behind the Curtain
=====
Thank you.
Sincerely,
Przemyslaw Radomski, CFA
Founder, Editor-in-chief, Gold & Silver Fund Manager
Gold & Silver Trading Alerts
Forex Trading Alerts
Oil Investment Updates
Oil Trading Alerts

