

Briefly: In our opinion, speculative short positions (full) in gold, silver and mining stocks are justified from the risk/reward point of view.
The precious metals market moved higher on Friday and it erased some of the previous losses. Is the decline already over or is the contrary the case and the decline will resume shortly?
In short, the latter is much more likely in our view. Let’s see why (charts courtesy of http://stockcharts.com).
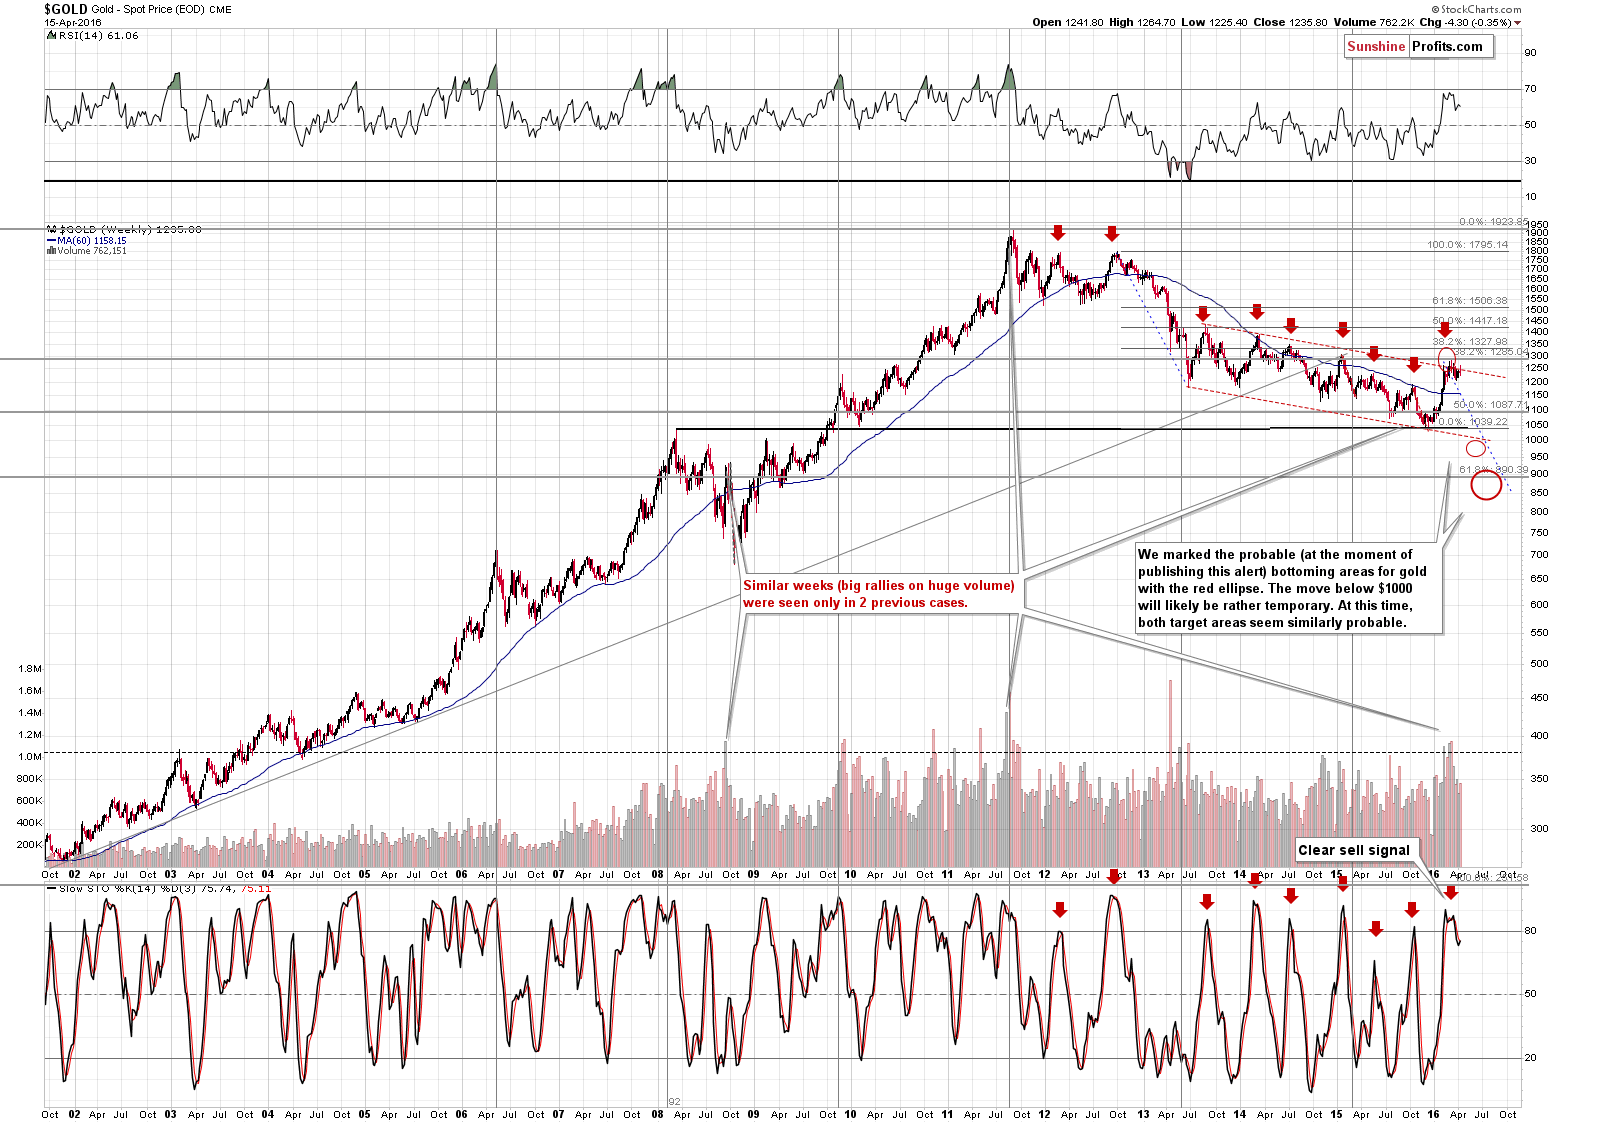
Gold formed a weekly reversal, declining $4 last week despite a visible initial move to the upside. The gold price remains within the declining trend channel, below its upper border and the implications are bearish.
In Friday’s alert we wrote the following:
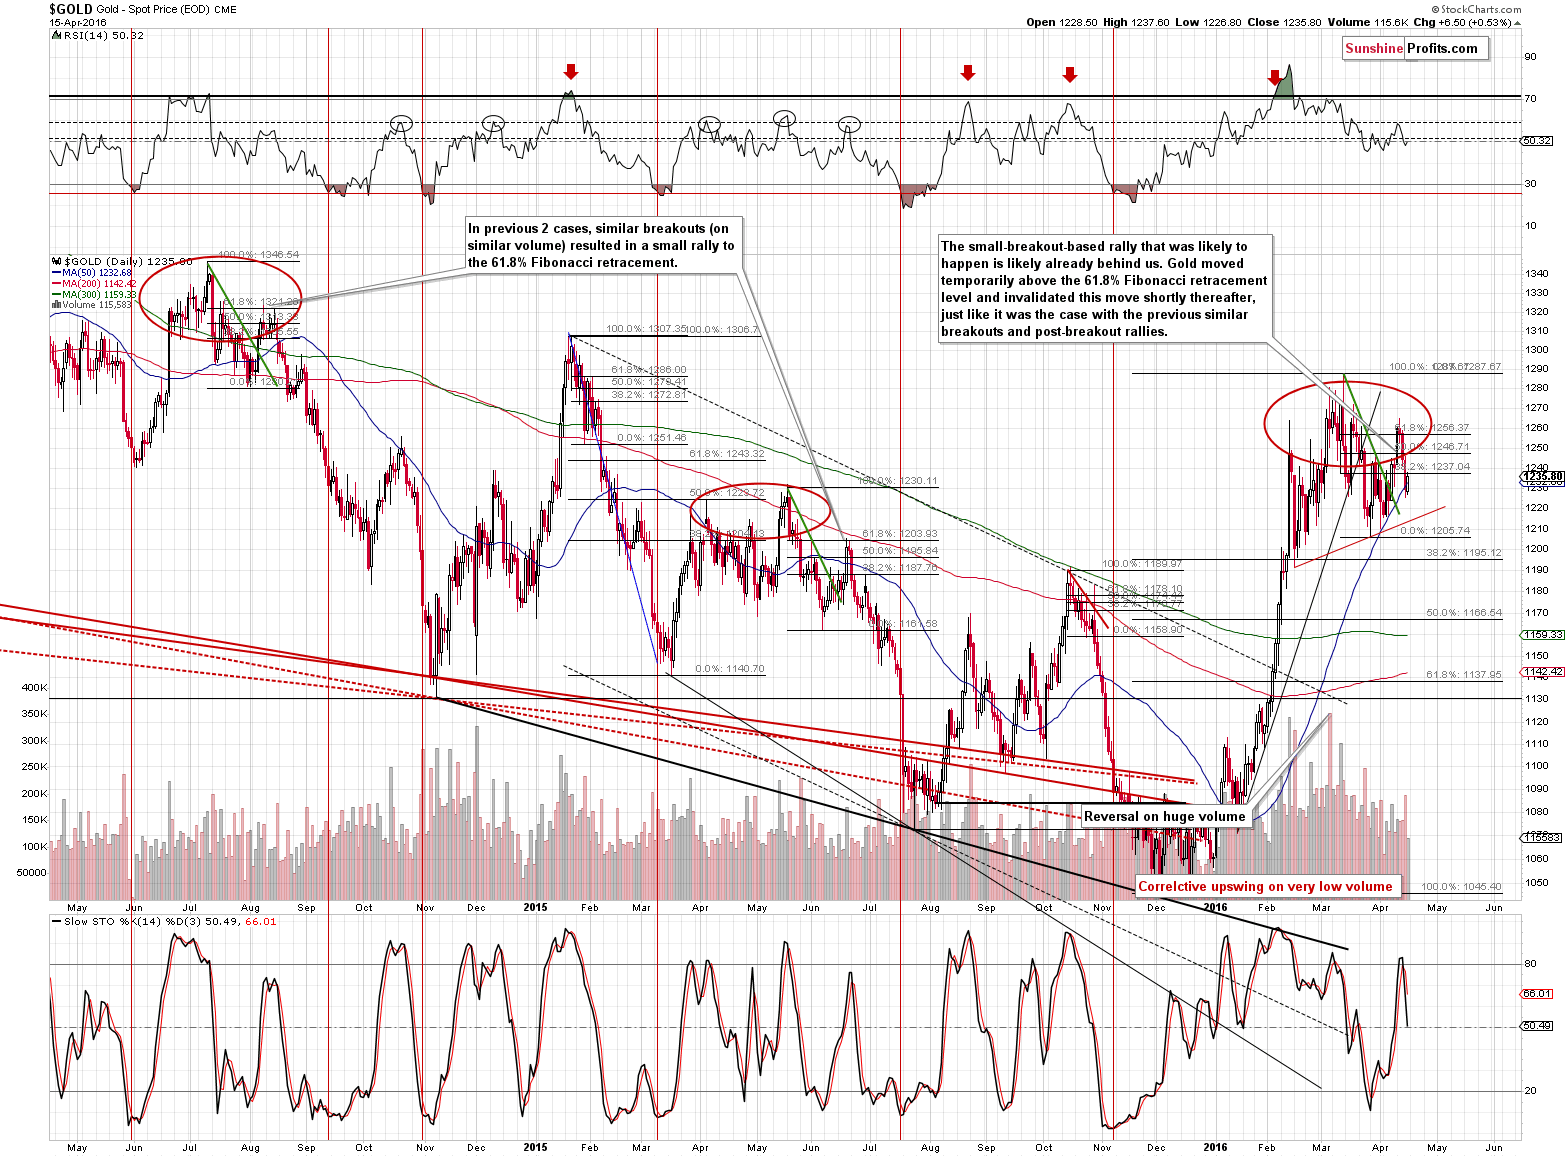
Moving to gold, we saw a decline on relatively big volume (biggest daily volume so far this month), which has bearish implications. It seems that the decline will be continue (especially if gold breaks below the red support line and the February-today head-and-shoulders pattern will be completed) and it appears that entering short positions when gold was at about $1,250 was a good idea.
The key thing is that gold declined on big volume while it moved (a bit) higher on much lower volume. That’s a clear sign that Friday’s move was a correction – nothing more than a pause within the decline. Please note that gold didn’t even move above the 38.2% Fibonacci retracement level. All in all, there was nothing bullish about Friday’s move higher and it appears that the decline will resume in the following days (not necessarily today, though).
In Friday’s alert we wrote the following:
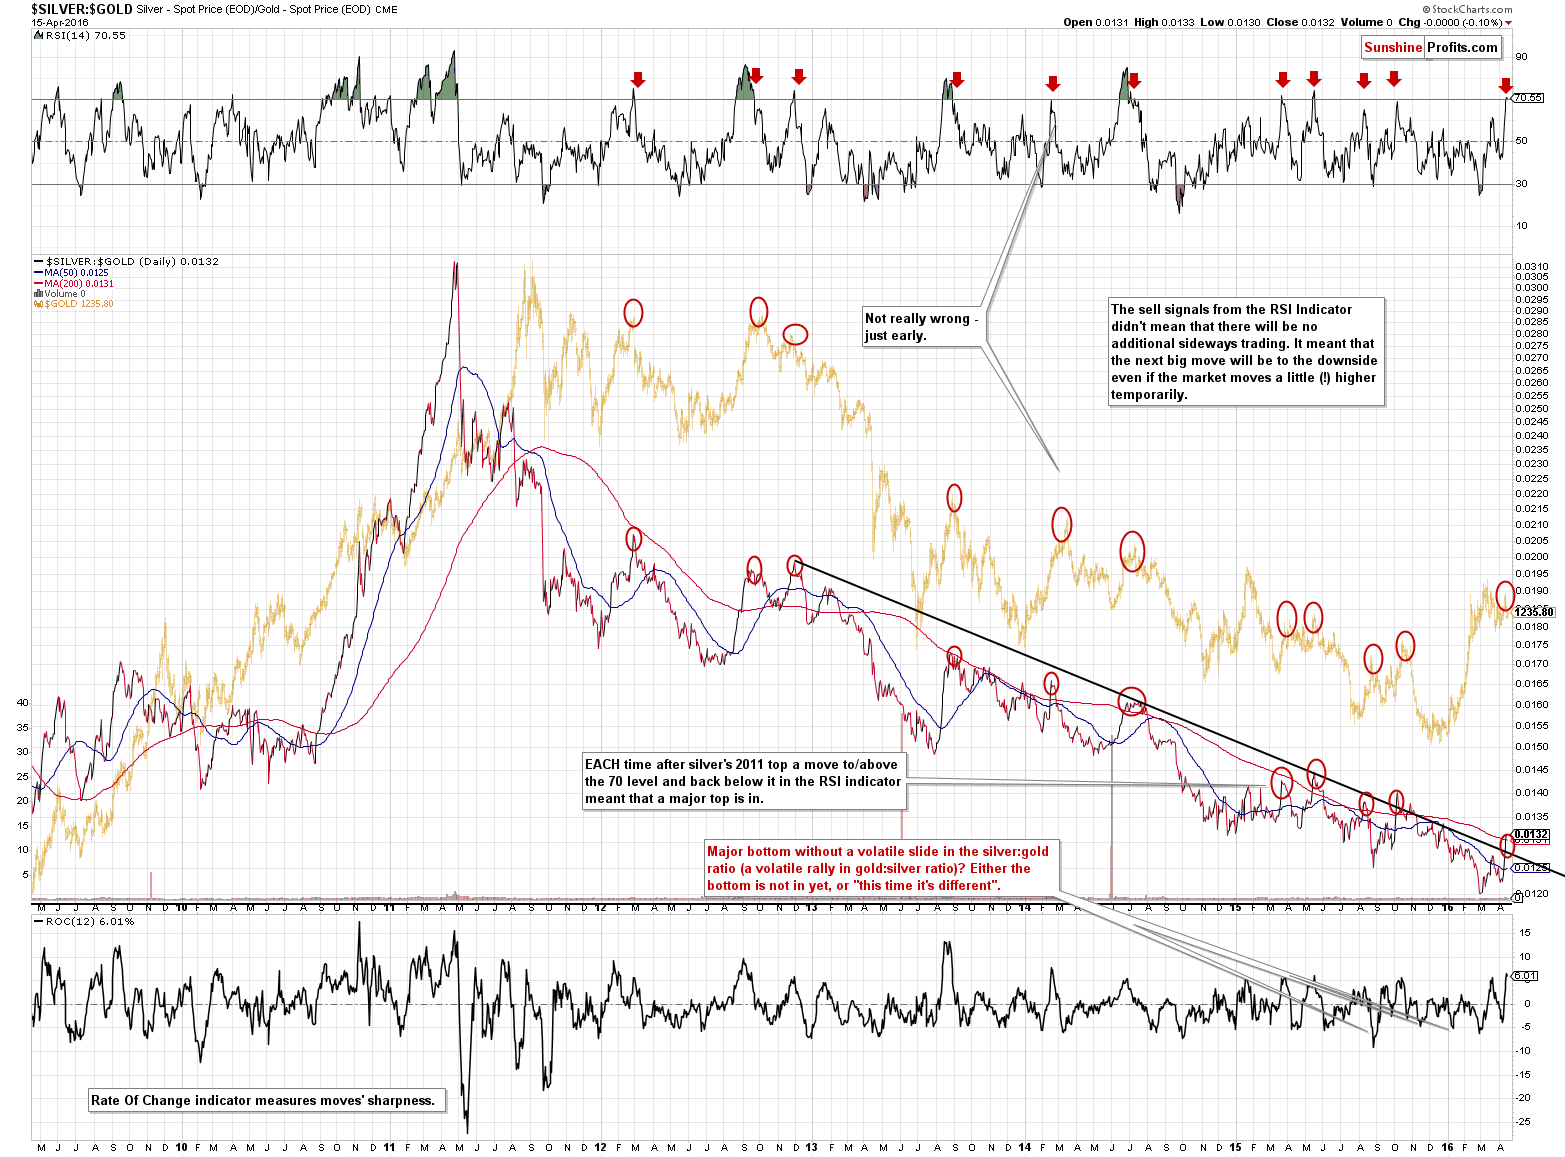
The silver to gold ratio and the indicators plotted on the chart show how often the above signal worked. The RSI close to 70 usually meant that an important top was in or about to be in, especially if the ratio was close to the declining resistance lined and / or the 200-day moving average. This is the case right now and the implications are bearish.
As you can read on the above chart, the signal was even clearer when the RSI moved above 70 and then declined back below it. Based on yesterday’s outperformance of silver relative to gold, the RSI moved above 70 and thus it’s only a matter of time (probably a very short amount of time) when the key sell signal is seen. It seems that one can already view the above situation as very bearish for the upcoming weeks.
Naturally, a question comes to mind: Why would silver’s temporary (!) outperformance be such a bearish sign in most cases? There is no specific fundamental reason for the above . However, in the short term, markets don’t move based on fundamentals, but emotions. The likely reason behind this phenomenon is the popularity of silver among small, individual investors and the relatively small size of the silver market (compared to other markets, like the gold market) and these investors tend to get in the market close to tops. Consequently, extraordinary performance of silver relative to gold may be viewed as a sign of the top. A similar phenomenon sometimes occurs for junior mining stocks (and you will find more details by clicking the above link) but in the past years, silver’s signals have become more meaningful and clearer than those from juniors.
On a side note, we expect silver to outperform gold in the upcoming years, but as far as short-term trading implications are concerned, the above remains to be a very useful trading technique.
The above remains up-to-date and the reason we are quoting it is that we will likely see a move lower in the ratio (based on today’s pre-market moves it seems even more likely – silver is underperforming). This is likely to cause a move lower in the RSI – below the 70 level, and a major sell signal that we described above.
What about silver itself?
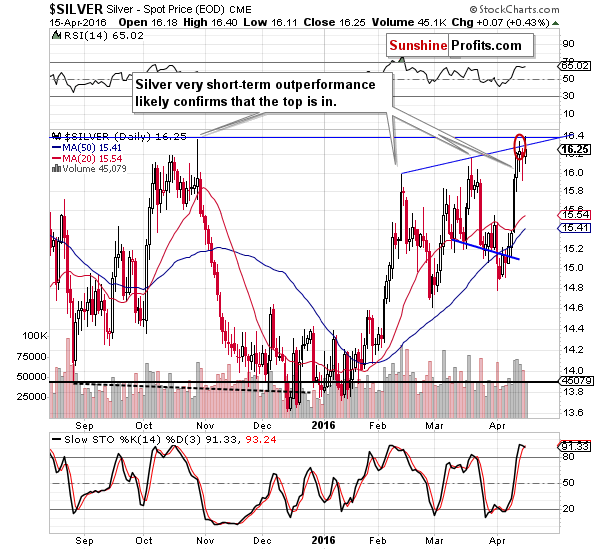
It once again moved to our target area – its upper part – and declined. It seems that the top is already in and if it’s not, it seems that silver would not rally far as both resistance levels (the rising blue line and the October 2015 high) are relatively close.
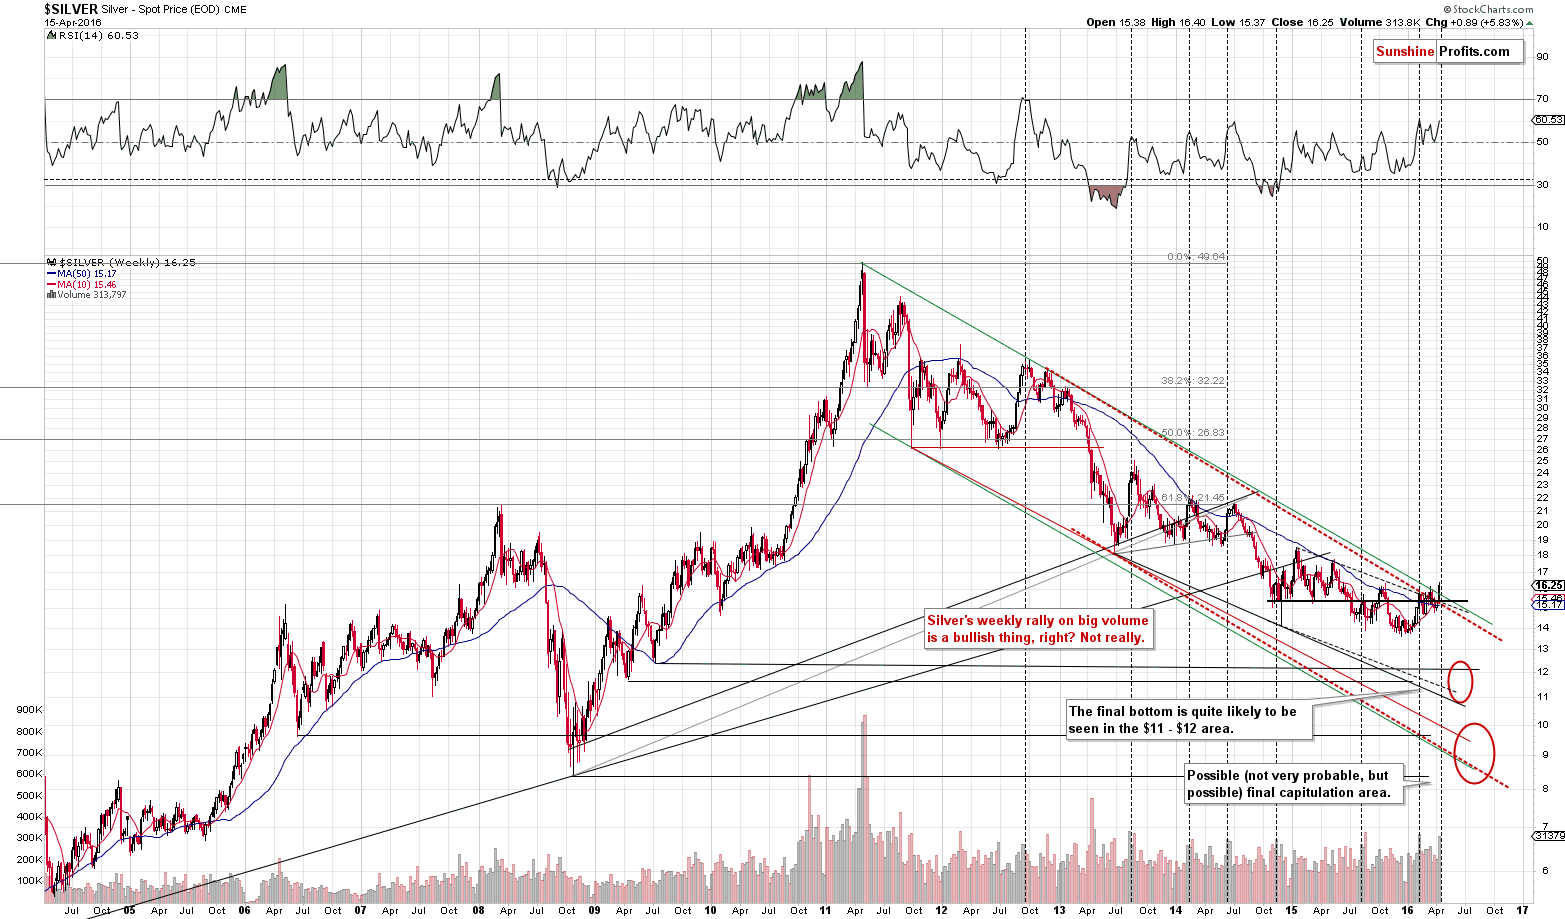
The long-term silver chart also suggests that a move lower is likely just ahead. Silver moved higher last week and the corresponding weekly volume was significant. This seems like a bullish sign… Until one checks what happened in the previous cases when silver rallied on similarly “strong” volume. We marked these situations with vertical, black, dashed lines. As you can see, silver declined at least some in practically all cases, and in most cases, it declined significantly. Consequently, taking the above signal at face value could be very misleading. The history shows that the implications of silver’s weekly rally on big volume are actually bearish.
Moreover, some may say that silver broke above the declining, long-term resistance line and closed the week above it and they may view such a breakout as bullish. Once again, we would like to remind about the fact that silver tens to “fake out” just before moving in the opposite direction. Consequently, we are not viewing this breakout as bullish. It can even be viewed as a bearish sign.
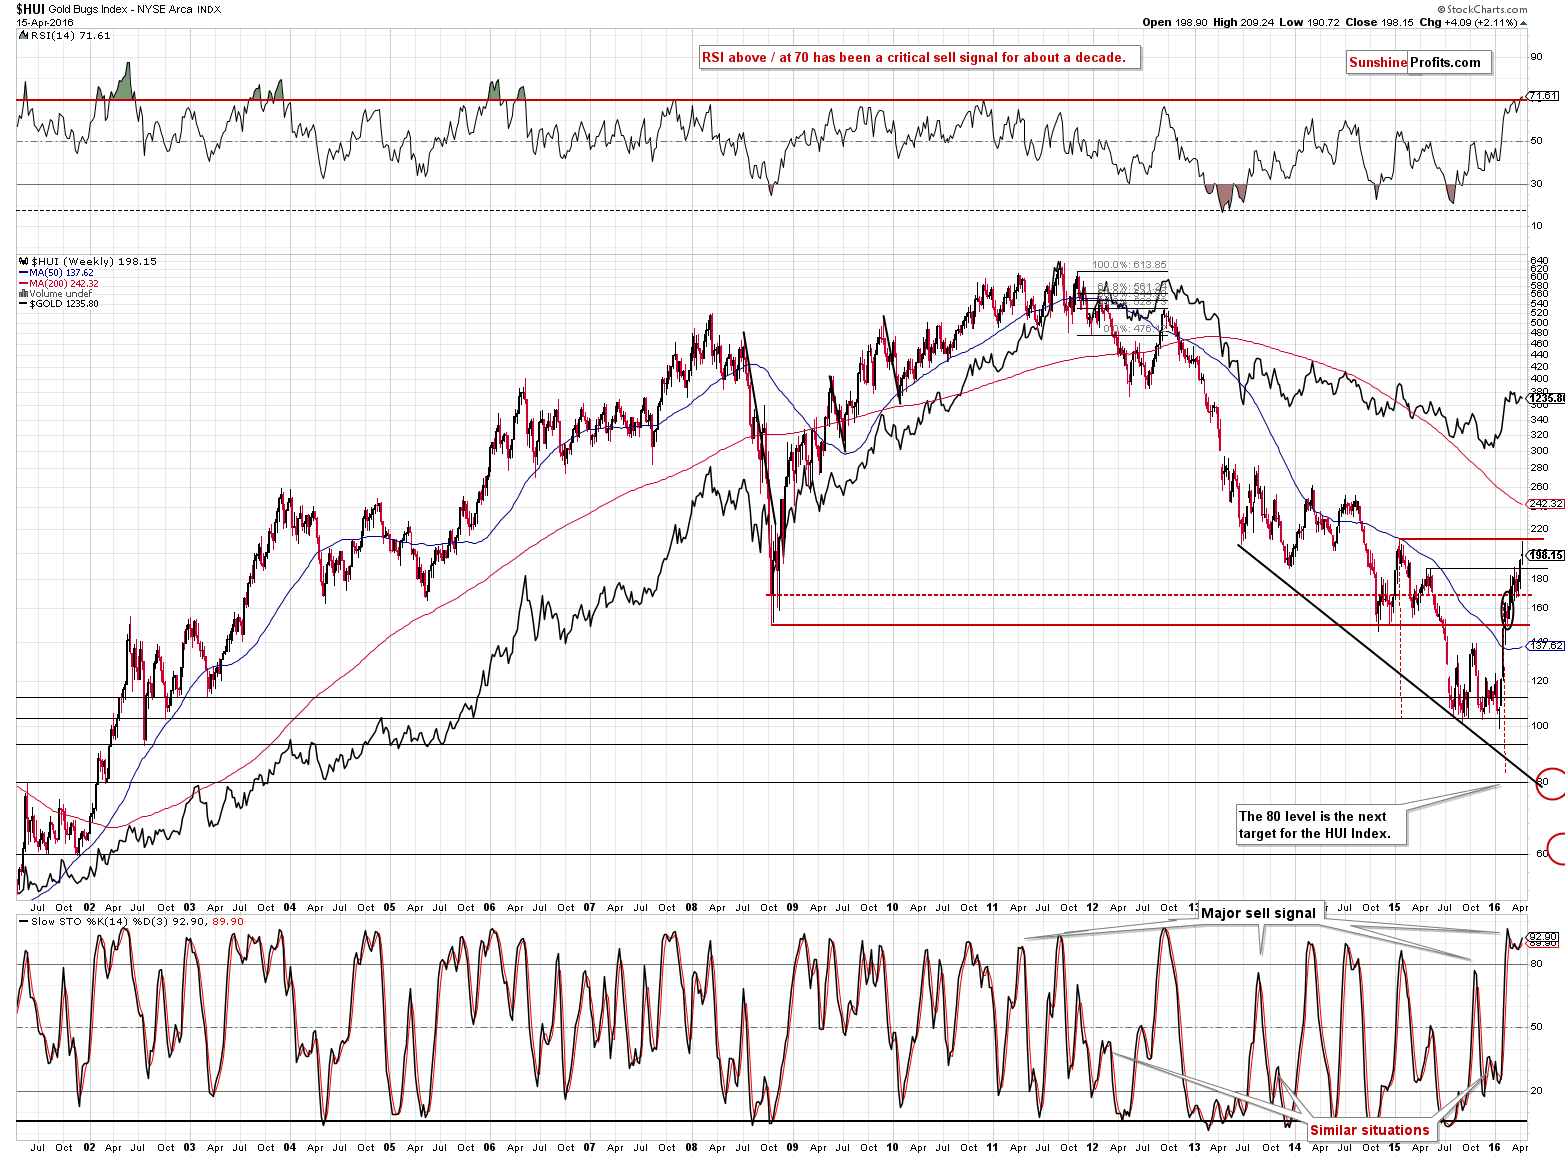
The HUI Index moved to its 2015 high last week and reversed. The top is likely in. It is not only the significance of the resistance level that was reached that makes it likely – it’s also confirmed by the RSI indicator, which moved to the 70 level and in the last 10 years or so this sign has always (!) corresponded to important tops.
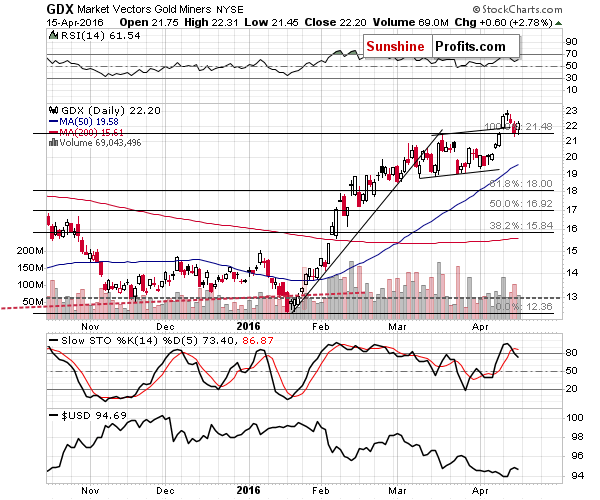
From the short-term point of view, we can see that mining stocks moved higher on relatively low volume, just like gold did. Once again, this suggests that Friday’s move higher was just a pause within a decline, not a beginning of another upleg.
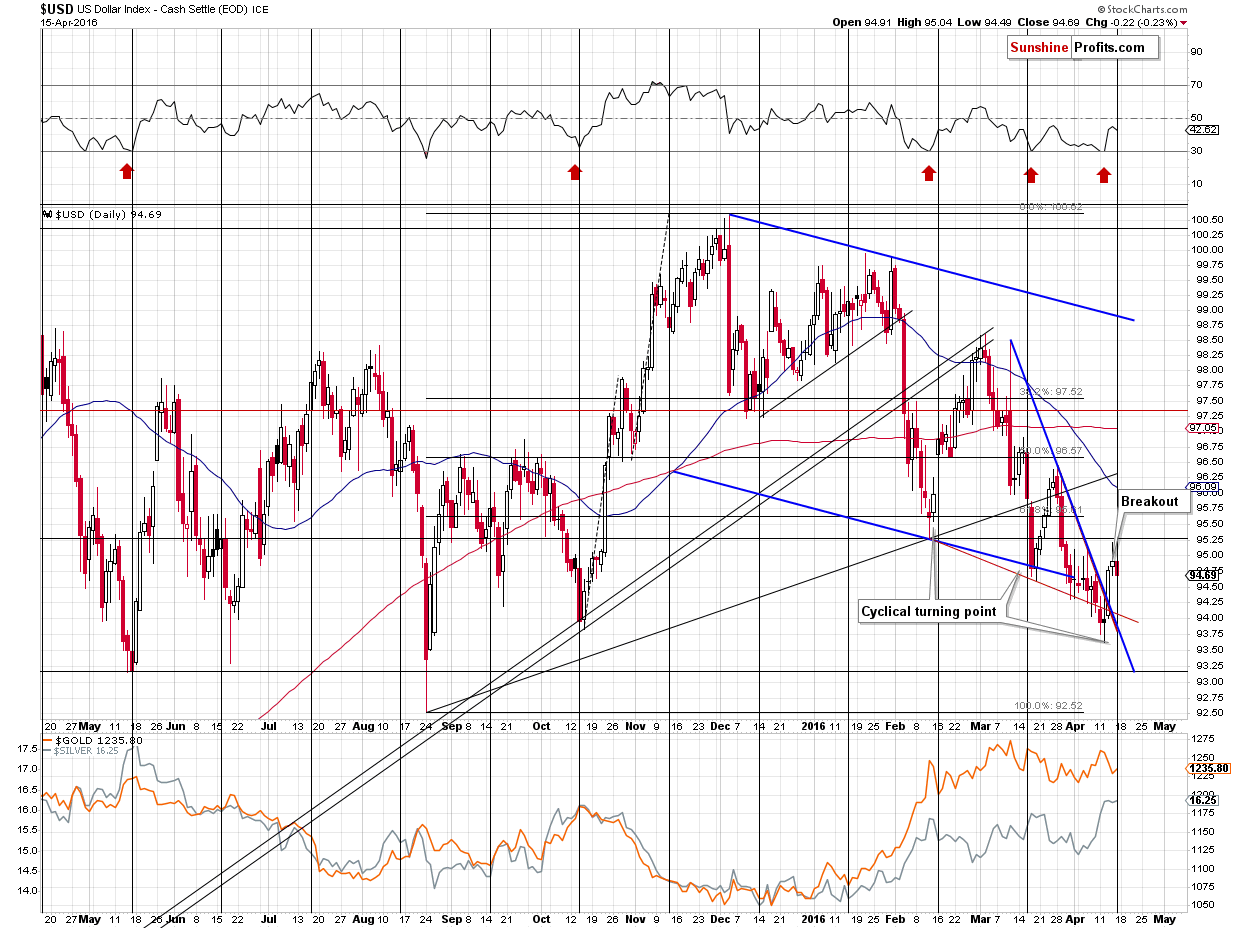
The USD Index broke above the declining resistance line last week and that was an important bullish sign for the USD and a bearish sign for the precious metals market. Prices of assets tend either pause or correct after a breakout or breakdown and the fact that USD did something like that on Friday is nothing unusual or bearish. The outlook for the USD remains bullish and the implications remain bearish for the precious metals market.
Summing up, based on the sizes of the moves and the sizes of corresponding volumes, Friday’s move higher seems to have been just a corrective upswing within a decline and silver’s strong performance last week doesn’t seem to have been a bullish sign. In fact, silver’s strong performance in similar weeks was followed by declines, usually substantial. Consequently, we think that a short position (full) in gold, silver and mining stocks is justified from the risk to reward point of view.
As always, we will keep you – our subscribers – updated.
To summarize:
Trading capital (our opinion): Short positions (full) in gold, silver and mining stocks are justified from the risk/reward perspective with the following stop-loss orders and initial target price levels:
- Gold: initial target price: $973; stop-loss: $1,304, initial target price for the DGLD ETN: $89.05; stop-loss for the DGLD ETN $47.15
- Silver: initial target price: $12.13; stop-loss: $16.62, initial target price for the DSLV ETN: $68.48; stop-loss for DSLV ETN $36.11
- Mining stocks (price levels for the GDX ETF): initial target price: $9.34; stop-loss: $24.07, initial target price for the DUST ETF: $5.72; stop-loss for the DUST ETF $1.74
In case one wants to bet on junior mining stocks' prices (we do not suggest doing so – we think senior mining stocks are more predictable in the case of short-term trades – if one wants to do it anyway, we provide the details), here are the stop-loss details and initial target prices:
- GDXJ ETF: initial target price: $14.13; stop-loss: $34.57
- JDST ETF: initial target price: $8.86; stop-loss: $2.75
Long-term capital (our opinion): No positions
Insurance capital (our opinion): Full position
Plus, you might want to read why our stop-loss orders are usually relatively far from the current price.
Please note that a full position doesn’t mean using all of the capital for a given trade. You will find details on our thoughts on gold portfolio structuring in the Key Insights section on our website.
As a reminder – “initial target price” means exactly that – an “initial” one, it’s not a price level at which we suggest closing positions. If this becomes the case (like it did in the previous trade) we will refer to these levels as levels of exit orders (exactly as we’ve done previously). Stop-loss levels, however, are naturally not “initial”, but something that, in our opinion, might be entered as an order.
Since it is impossible to synchronize target prices and stop-loss levels for all the ETFs and ETNs with the main markets that we provide these levels for (gold, silver and mining stocks – the GDX ETF), the stop-loss levels and target prices for other ETNs and ETF (among other: UGLD, DGLD, USLV, DSLV, NUGT, DUST, JNUG, JDST) are provided as supplementary, and not as “final”. This means that if a stop-loss or a target level is reached for any of the “additional instruments” (DGLD for instance), but not for the “main instrument” (gold in this case), we will view positions in both gold and DGLD as still open and the stop-loss for DGLD would have to be moved lower. On the other hand, if gold moves to a stop-loss level but DGLD doesn’t, then we will view both positions (in gold and DGLD) as closed. In other words, since it’s not possible to be 100% certain that each related instrument moves to a given level when the underlying instrument does, we can’t provide levels that would be binding. The levels that we do provide are our best estimate of the levels that will correspond to the levels in the underlying assets, but it will be the underlying assets that one will need to focus on regarding the sings pointing to closing a given position or keeping it open. We might adjust the levels in the “additional instruments” without adjusting the levels in the “main instruments”, which will simply mean that we have improved our estimation of these levels, not that we changed our outlook on the markets. We are already working on a tool that would update these levels on a daily basis for the most popular ETFs, ETNs and individual mining stocks.
Our preferred ways to invest in and to trade gold along with the reasoning can be found in the how to buy gold section. Additionally, our preferred ETFs and ETNs can be found in our Gold & Silver ETF Ranking.
As always, we'll keep you - our subscribers - updated should our views on the market change. We will continue to send out Gold & Silver Trading Alerts on each trading day and we will send additional Alerts whenever appropriate.
The trading position presented above is the netted version of positions based on subjective signals (opinion) from your Editor, and the Tools and Indicators.
As a reminder, Gold & Silver Trading Alerts are posted before or on each trading day (we usually post them before the opening bell, but we don't promise doing that each day). If there's anything urgent, we will send you an additional small alert before posting the main one.
=====
Latest Free Trading Alerts:
According to the Fed, industrial production decreased 0.6 percent in March. What does it mean for the Fed’s monetary policy and gold market?
How Will March Industrial Production Affect Gold?
=====
Hand-picked precious-metals-related links:
Deutsche Bank PM Settlement Might Only Be The Start - Expert Witness
Peter Schiff to Goldman Sachs—you're wrong on gold!
Apple just collected $40 million in recycled gold
=====
In other news:
Draghi Seen Putting ECB Stimulus Back on Agenda After Summer
Discord Grows Among the Parties Over Greek Debt Talks
Brazil's lower house votes for Dilma Rousseff's impeachment
Emerging Markets Brace for Fed Interest-Rate Rise
Oil producers send crude reeling after output deal fails in Doha
=====
Thank you.
Sincerely,
Przemyslaw Radomski, CFA
Founder, Editor-in-chief, Gold & Silver Fund Manager
Gold & Silver Trading Alerts
Forex Trading Alerts
Oil Investment Updates
Oil Trading Alerts

