

Briefly: in our opinion, full (300% of the regular position size) speculative short positions in junior mining stocks are justified from the risk/reward point of view at the moment of publishing this Alert.
The medium-term back and forth movement in gold continues. If I could make the markets move in a certain direction sooner, and end the prolonged consolidation, I would. However, I can’t, and the only thing that I can do is to report to you what I see on the markets and describe what my course of action will be.
During yesterday’s session we saw more of what we’ve been seeing in the previous days. Gold moved higher, and gold stocks moved higher (but in a weak manner), and even though gold moved to new monthly highs, the HUI Index is not even back to its late-October highs. It’s boring, discouraging, and demotivating. But the only thing that we can do is to react to what the market is willing to provide us with. What do yesterday’s and today’s pre-market price moves tell us?
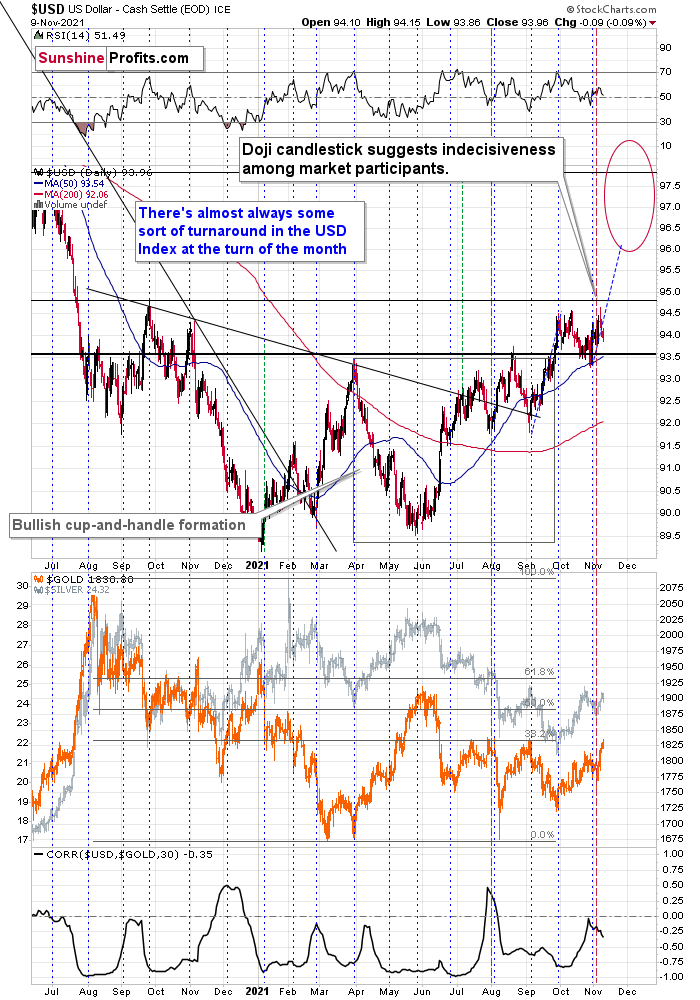
First of all, the market tells us that the breakout to new highs in the USD Index is not being invalidated. I know that I’ve written this tens of times, but this factor remains intact and it continues to have very important implications going forward. These are bullish for the USD Index and bearish for the precious metals sector.
Second, as I had already written earlier today, gold stocks are not showing strength relative to gold.
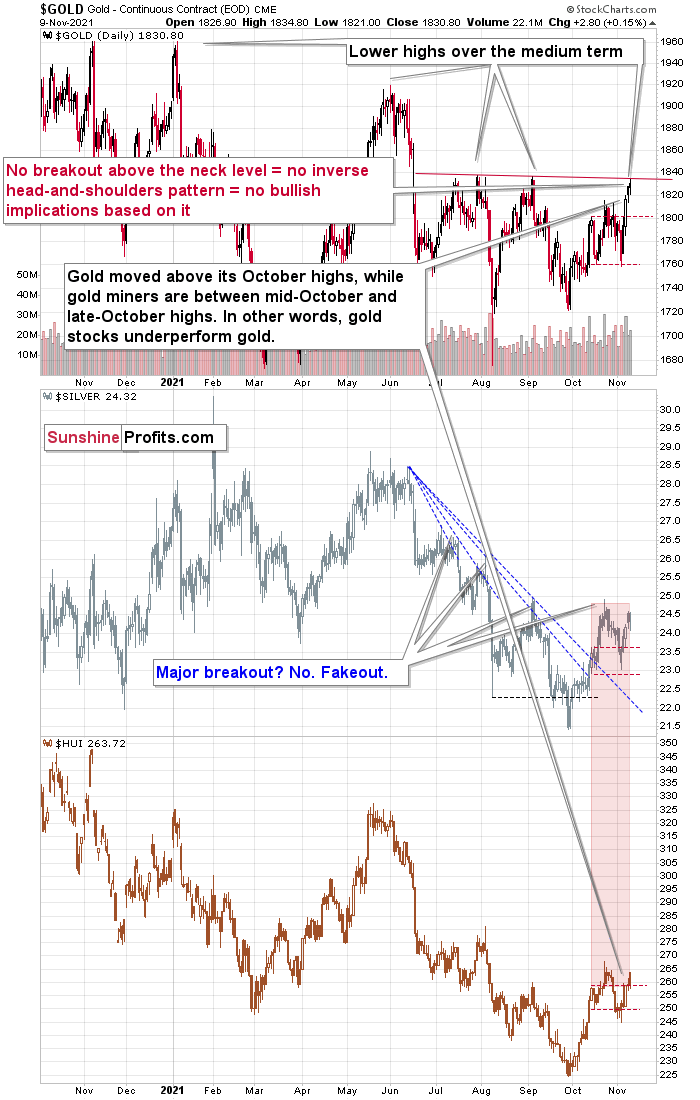
The gold price just made new monthly highs and is now visibly above its October highs, but the silver price and – most importantly - gold stocks are not. In fact, they are just a little above their mid-October highs.
Consequently, the thing that one tends to see in the final parts of a short-term rally remains in place.
So, when will the decline in PMs finally continue? Based on what I wrote on Monday – in particular about gold’s reversal points, it’s likely to start soon – perhaps as early as this week.
As a quick reminder, you can see gold’s triangle-vertex-based reversal on the chart below:
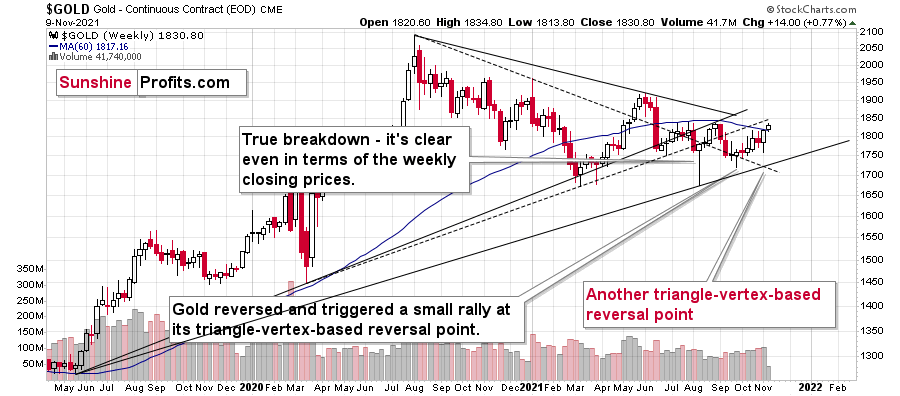
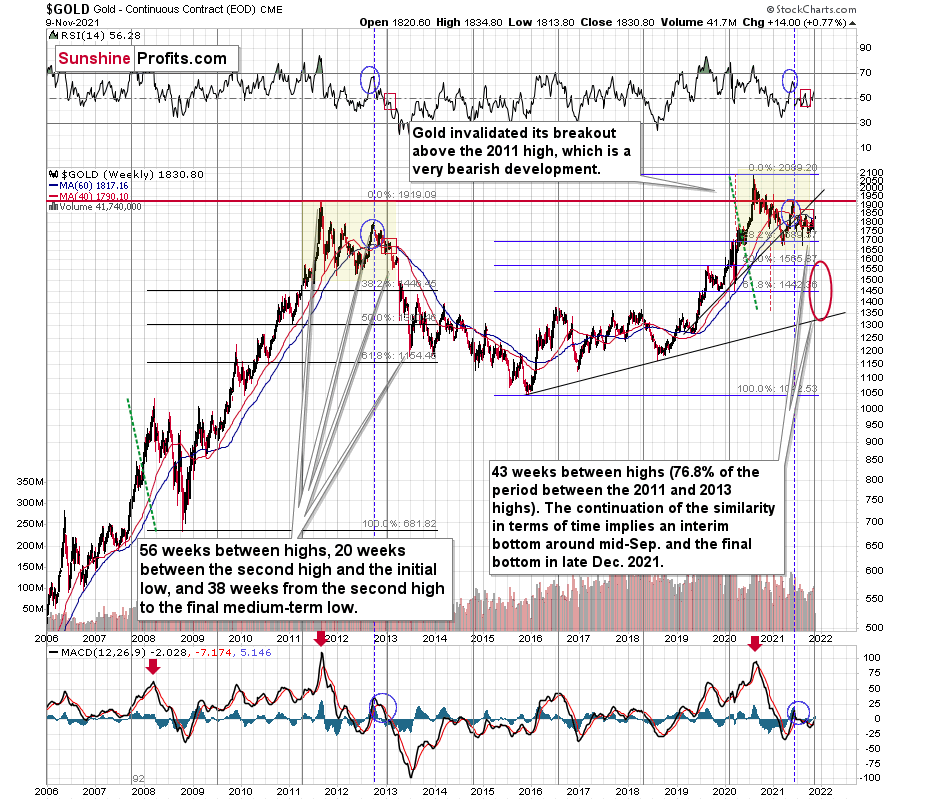
And you can see gold’s long-term cyclical turning point on the chart below:
The fact that gold moved to its recent medium-term highs is also a factor here. Resistance provided by those highs is quite likely to trigger a reversal in gold, and based on today’s pre-market action, it’s what we might already be seeing right now.
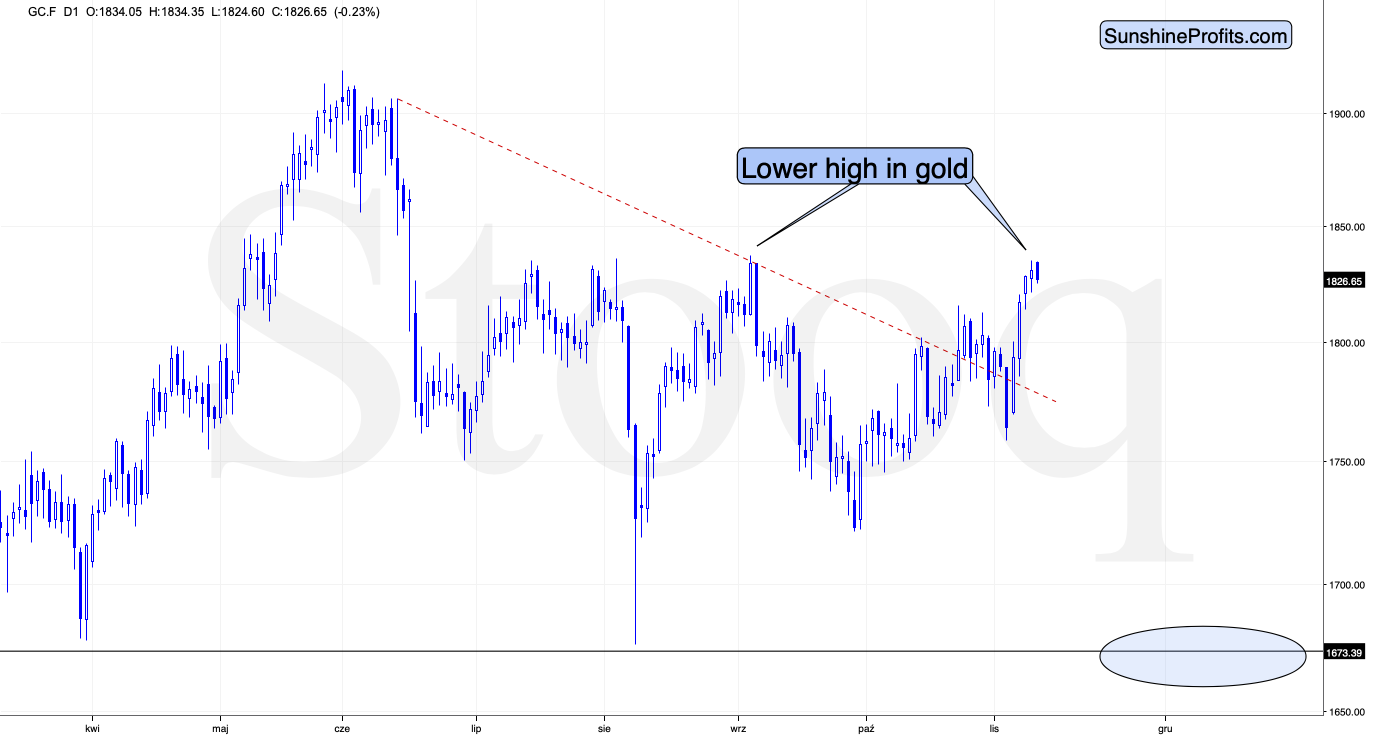
The move lower is small so far, but all bigger moves have small beginnings, and given the reversal points and the resistance that gold just encountered, this could be “it”.
Also, speaking of resistance levels, on today’s second chart I placed a red resistance line based on the previous highs. It might be tempting to view the price action below it as an inverse head and shoulders pattern, which could have bullish implications. However, let’s keep in mind that without a breakout above the neck level (approximately the previous highs), the formation is not yet complete, and as such it has NO bullish implications whatsoever, as it simply doesn’t exist yet.
All in all, the outlook for the precious metals market is not bullish, even though the last several days / weeks might make one feel otherwise. Before viewing the recent move higher as something significant and/or bullish, please consider how tiny this upswing is compared to the decline in gold stocks between May and October. No market moves in a straight line, and periodic corrections are inevitable. It doesn’t make them a start of a new powerful upswing in each case, though. And if the part of the precious metals market that is supposed to rally the most at the start of a major upswing is so weak right now, then why should one expect the current upswing to be anything more than a corrective upswing within a bigger downtrend?
Having said that, let’s take a look at the markets from a more fundamental angle.
Catch Me if You Can
While I’ve been warning for months that the Fed is materially behind the inflation curve, the Consumer Price Index (CPI) is likely far from its peak. For example, while we expect a headline figure in the 5.25% to 5.75% range to hit the wire today, a subsequent rise above 6% is still more likely than a fall below 5%.
To explain, the NFIB released its Small Business Optimism Index on Nov. 9. And while the headline index decreased from 99.1 in September to 98.2 in October, wage and output inflation hit record highs. Isolating the latter, the NFIB’s index of small businesses’ average selling prices hit a new all-time high, with a net 53% of respondents reporting price hikes in October.
Please see below:
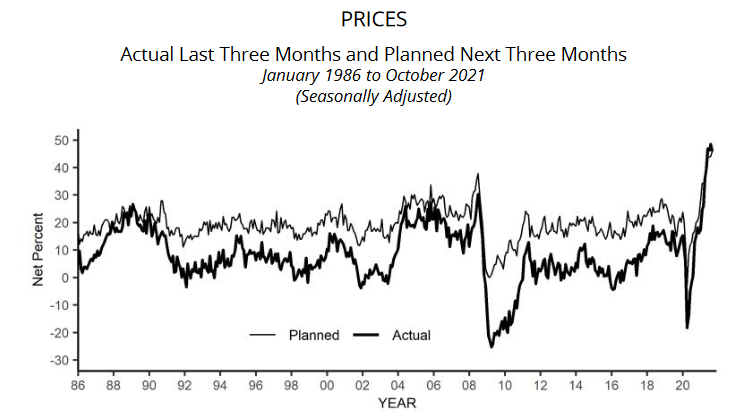 Source: NFIB
On top of that, the NFIB’s index of small businesses’ future pricing plans also hit a new all-time high, with a net 51% of respondents planning more price increases in the coming months. In addition, the data implies a sharp increase in the median CPI as we look toward 2022. For context, the median CPI calculates the inflation rate using the component whose expenditure weight is in the 50th percentile of price changes. In a nutshell: the Cleveland Fed uses the metric to drown out “transitory” noise and portray inflation as lower than it really is.
Please see below:
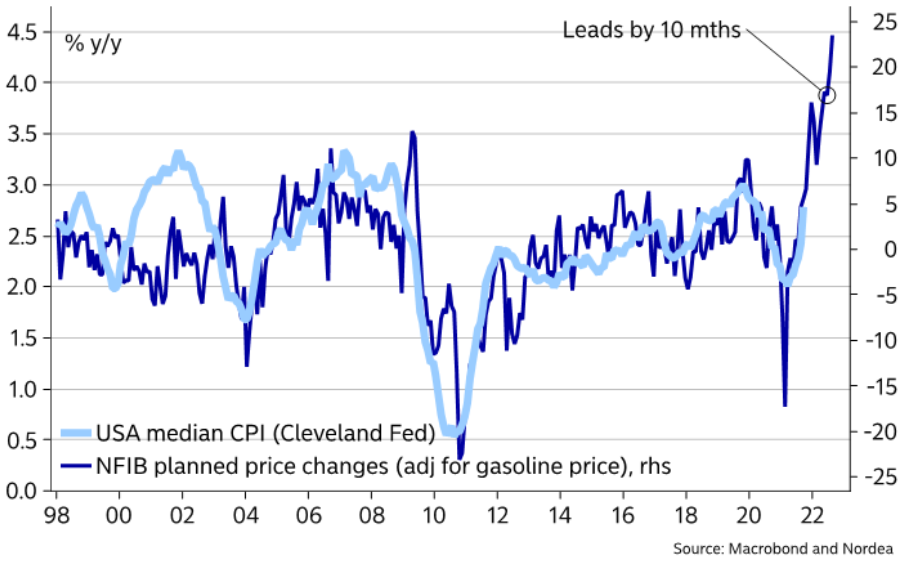
To explain, the dark blue line above tracks the NFIB’s index of small businesses’ future pricing plans, while the light blue line above tracks the median CPI. If you assess the relationship, you can see that the latter often follows in the former’s footsteps. What’s more, if you analyze the right side of the chart, you can see that while NFIB pricing plans have run away from the median CPI, it often leads 10 months in advance. As a result, inflation is showing no signs of slowing down and the Fed should amplify its hawkish rhetoric in the coming months.
As for wage inflation, the NFIB’s current and future compensation indexes both hit all-time highs, as “a net 44% of owners (seasonally adjusted) reported raising compensation, a 48-year record high reading. A net 32% plan to raise compensation in the next three months.”
Please see below:
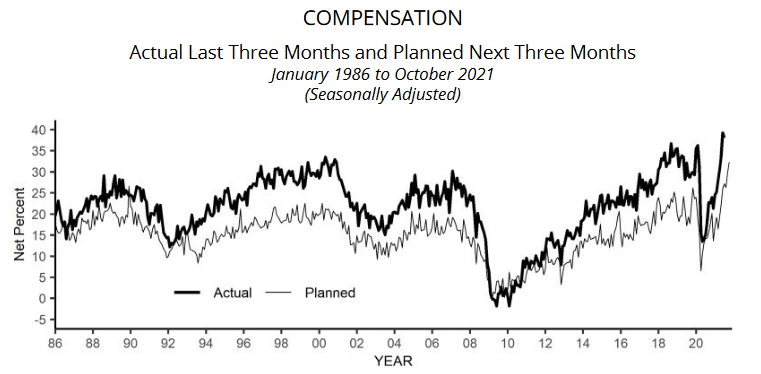 Source: NFIB
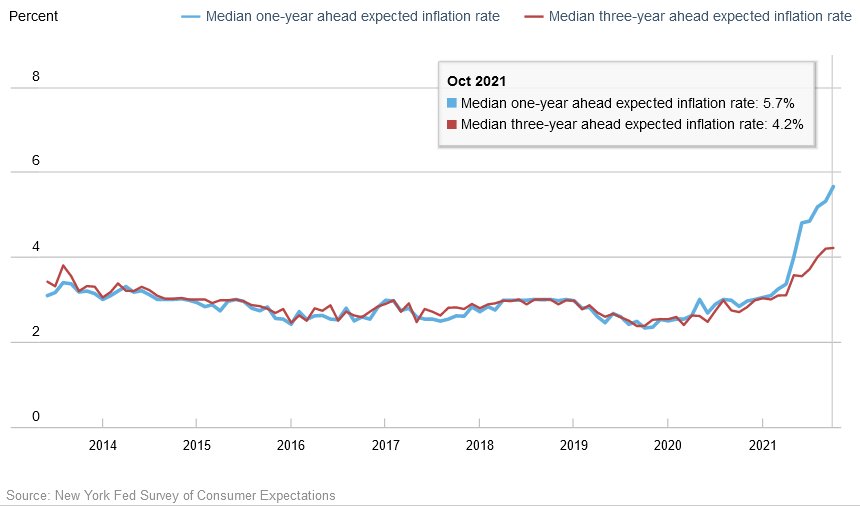
If that wasn’t enough, the New York Fed released its Survey of Consumer Expectations on Nov. 8. The report revealed:
“After increasing for three consecutive months, median inflation expectations at the three-year horizon remained unchanged at 4.2% in October. In contrast, median inflation expectations increased by 0.4 percentage point to 5.7% at the one-year horizon, reaching a new series high since the inception of the survey in June 2013. The increase in the short-term measure was the series’ twelfth consecutive increase and was most pronounced for respondents who have at least a college degree and those between ages 40 and 60.”
Please see below:
In addition:
 Source: New York Fed
Speaking of rent inflation, I’ve been warning for some time that the Shelter CPI should make its presence felt during the autumn months. And after the gauge hit a 2021 high of 3.2% year-over-year (YoY) in September, more upside pressure should materialize over the medium term.
To explain, Apartment List – an online marketplace with “more than 5 million apartments for rent” – released its National Rent Report on Nov. 1. And while the month-over-month (MoM) increase in its national index has slowed, it still increased by 0.80% in October.
Please see below:
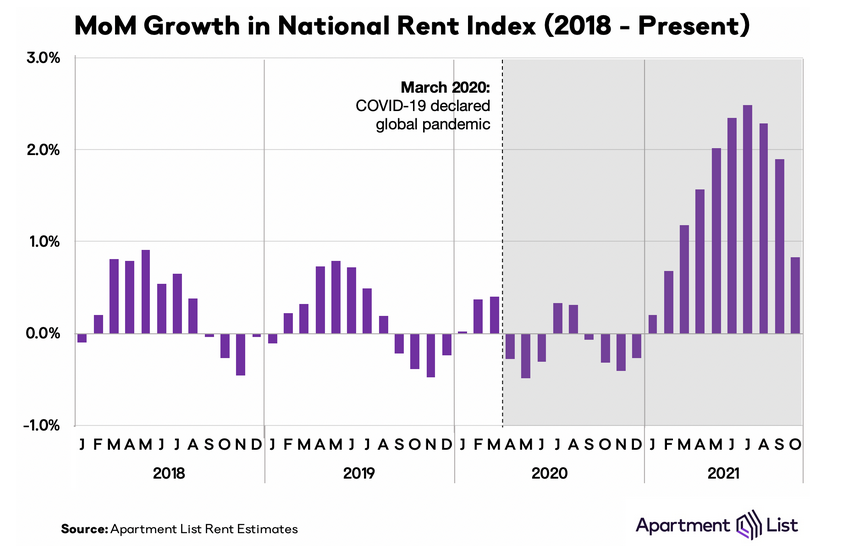
For context, the report revealed:
“Although the pace of rent growth has slowed down significantly from its July peak, growth is still outpacing pre-pandemic trends, with rents continuing to rise during a time of year when seasonality normally causes prices to dip. Since January of this year, the national median rent has increased by a staggering 16.4 percent. To put that in context, rent growth from January to October averaged just 3.2 percent in the pre-pandemic years from 2017-2019.”
Also noteworthy:
“There were six individual months from 2017-2019 in which growth matched or exceeded this month’s 0.8 percent rate. However, in those prior years, rent growth of this magnitude only occurred during the late spring or summer months, in the midst of peak rental season. October normally sees prices declining due to seasonality in the market; in the pre-pandemic years from 2017-2019, rents fell by an average of 0.3% from September to October.”
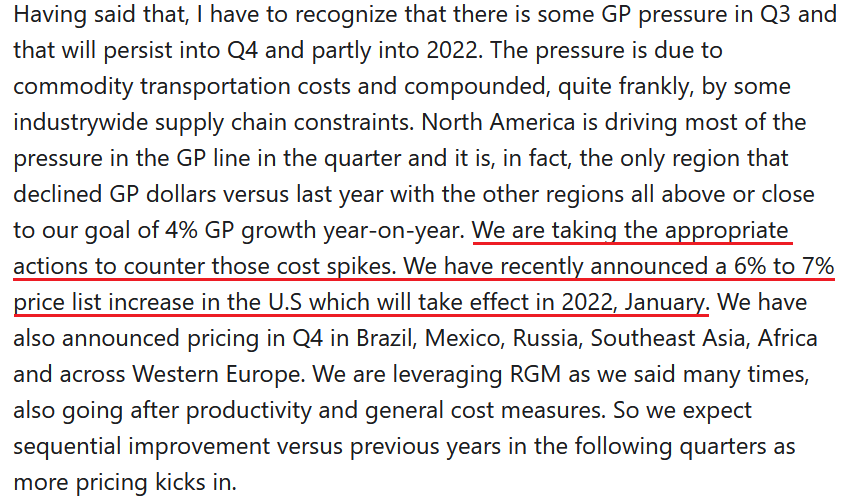
If that wasn’t enough, Mondelez International – an American snack foods company with a more than $80 billion market cap – released its third-quarter earnings on Nov. 2. For context, Mondelez International is the maker of Oreo cookies, Ritz crackers and Sour Patch Kids candy. CEO Dirk Van De Put said the following during the company’s Q3 earnings call:
“Like other companies, we are experiencing cost inflation globally, particularly on transportation cost and packaging which are most pronounced in the U.S. Costs have moved higher in the second half of the year relative to the first half and we expect inflation to persist in 2022….
“Maybe the other thing that I would say that we are in an inflationary environment. We've been increasing prices and we plan to increase the prices more than we've done, at least in the time that I'm here and probably for quite a while as a company.”
And are these price increases anywhere near the Fed’s 2% inflation goal?
 Source: Mondelez International/The Motley Fool
Finally, while “transitory” continues to be redefined to fit the Fed’s narrative, even abnormal inflationary pressures are showing no signs of abating. For context, I wrote on Apr. 16:
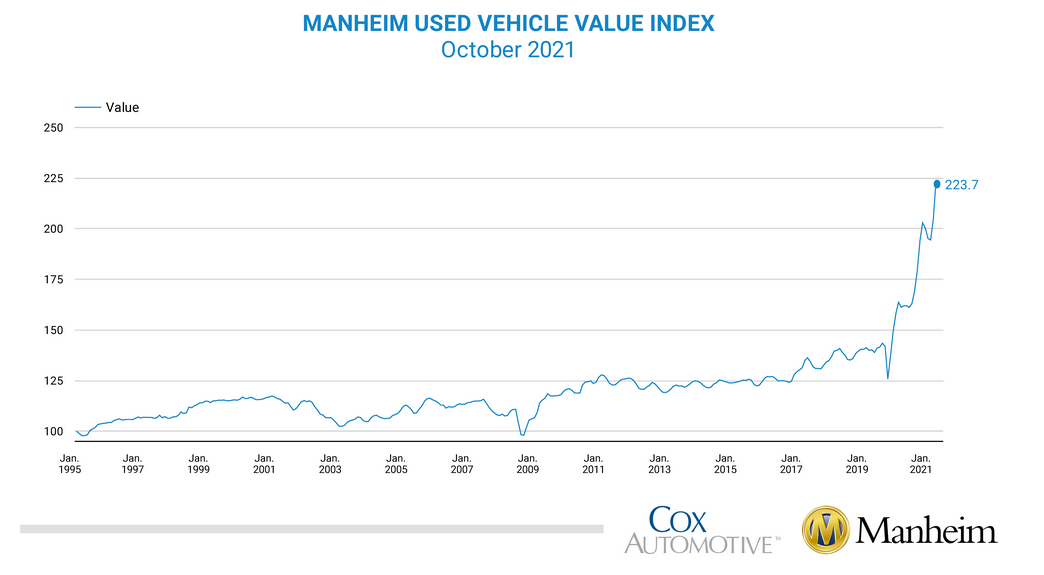
The Manheim Used Vehicle Value Index – compiled from a database of more than five million annual used vehicle transactions – increased by 5.87% month-over-month to a record high 179.2 in March. What’s more, the pace of the surge is unlike anything that we’ve ever witnessed before.
And after another update, Manheim revealed that its Used Vehicle Value Index recorded a “Historic Wholesale Price Increase in October” with the 9.2% MoM increase (seasonally adjusted) pushing the index to an all-time high of 223.7. The report revealed:
“October typically sees above average vehicle depreciation and therefore used price declines. This October was the first October in the history of the Manheim Index data, which dates to 1997, to see a non-seasonally adjusted price increase in October. The non-adjusted price increase in October was 5.4%.”
Please see below:
The bottom line? While speculative fury has returned to Wall Street – with ARK, SPACs, IPO indexes, cryptocurrencies and Tesla all soaring in recent weeks – the PMs have benefited from investors’ unrelenting bid. And while the fervor cooled somewhat on Nov. 9, the activity rivals the speculative feeding frenzy that erupted in the summer of 2020 (coincidently, when gold, silver and mining stocks peaked).
However, with inflation surging and the PMs suffering mightily when the Fed turns hawkish, FOMC officials will likely find that inflation is much more malevolent than they expect. And with the PMs current momentum akin to a marathon runner sprinting off the starting line, the inevitable fatigue should materialize sooner rather than later. As a result, the current rallies are more semblance than substance and the PMs should suffer hard landings once sentiment shifts.
In conclusion, the PMs were mixed on Nov. 9 and the USD Index was largely flat. However, with the former and the latter’s medium-term fundamentals diverging, it’s likely only a matter of time before sharp re-ratings commence. As a result, the bearish thesis remains intact and lower lows should confront the PMs over the medium term.
Overview of the Upcoming Part of the Decline
- It seems to me that the current corrective upswing in gold is over, and the next short-term move lower is about to begin. Since it seems to be another short-term move more than it seems to be a continuation of the bigger decline, I think that junior miners would be likely to (at least initially) decline more than silver.
- It seems that the first stop for gold will be close to its previous 2021 lows, slightly below $1,700. Then it will likely correct a bit, but it’s unclear if I want to exit or reverse the current short position based on that – it depends on the number and the nature of the bullish indications that we get at that time.
- After the above-mentioned correction, we’re likely to see a powerful slide, perhaps close to the 2020 low ($1,450 - $1,500).
- If we see a situation where miners slide in a meaningful and volatile way while silver doesn’t (it just declines moderately), I plan to – once again – switch from short positions in miners to short positions in silver. At this time, it’s too early to say at what price levels this could take place, and if we get this kind of opportunity at all – perhaps with gold close to $1,600.
- I plan to exit all remaining short positions when gold shows substantial strength relative to the USD Index while the latter is still rallying. This might take place with gold close to $1,350 - $1,400. I expect silver to fall the hardest in the final part of the move. This moment (when gold performs very strongly against the rallying USD and miners are strong relative to gold after its substantial decline) is likely to be the best entry point for long-term investments, in my view. This might also happen with gold close to $1,375, but it’s too early to say with certainty at this time. I expect the final bottom to take place near the end of the year, perhaps in mid-December. It is not set in stone that PMs have to bottom at that time. If not then, then early 2022 would become a likely time target. The official start of tapering will serve as an additional indication or confirmation of the bottom.
- As a confirmation for the above, I will use the (upcoming or perhaps we have already seen it?) top in the general stock market as the starting point for the three-month countdown. The reason is that after the 1929 top, gold miners declined for about three months after the general stock market started to slide. We also saw some confirmations of this theory based on the analogy to 2008. All in all, the precious metals sector is likely to bottom about three months after the general stock market tops. The additional confirmation will come from the tapering schedule, as markets are likely to move on the rumor and reverse on the fact as they tend to do in general.
- The above is based on the information available today, and it might change in the following days/weeks.
You will find my general overview of the outlook for gold on the chart below:
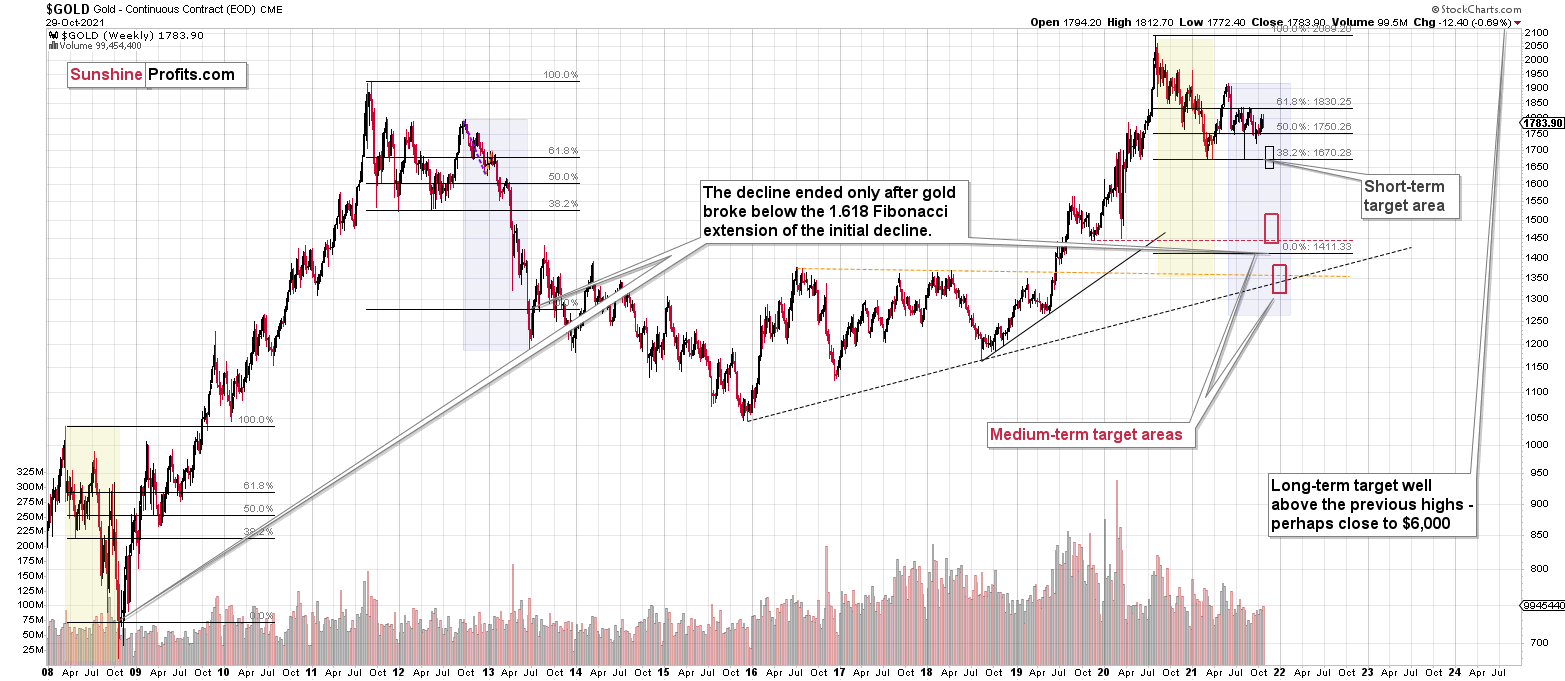
Please note that the above timing details are relatively broad and “for general overview only” – so that you know more or less what I think and how volatile I think the moves are likely to be – on an approximate basis. These time targets are not binding or clear enough for me to think that they should be used for purchasing options, warrants or similar instruments.
Summary
To summarize, the outlook for the precious metals sector remains extremely bearish for the next few months. Since it seems that the PMs are starting another short-term move lower more than it seems that they are continuing their bigger decline, I think that junior miners would be likely to (at least initially) decline more than silver.
From the medium-term point of view, the key two long-term factors remain the analogy to 2013 in gold and the broad head and shoulders pattern in the HUI Index. They both suggest much lower prices ahead.
It seems that our profits from the short positions are going to become truly epic in the following months.
After the sell-off (that takes gold to about $1,350 - $1,500), I expect the precious metals to rally significantly. The final part of the decline might take as little as 1-5 weeks, so it's important to stay alert to any changes.
Most importantly, please stay healthy and safe. We made a lot of money last March and this March, and it seems that we’re about to make much more on the upcoming decline, but you have to be healthy to enjoy the results.
As always, we'll keep you - our subscribers - informed.
By the way, we’re currently providing you with the possibility to extend your subscription by a year, two years, or even three years with a special 20% discount. This discount can be applied right away, without the need to wait for your next renewal – if you choose to secure your premium access and complete the payment upfront. The boring time in the PMs is definitely over, and the time to pay close attention to the market is here. Naturally, it’s your capital, and the choice is up to you, but it seems that it might be a good idea to secure more premium access now while saving 20% at the same time. Our support team will be happy to assist you in the above-described upgrade at preferential terms – if you’d like to proceed, please contact us.
To summarize:
Trading capital (supplementary part of the portfolio; our opinion): Full speculative short positions (300% of the full position) in junior mining stocks are justified from the risk to reward point of view with the following binding exit profit-take price levels:
Mining stocks (price levels for the GDXJ ETF): binding profit-take exit price: $35.73; stop-loss: none (the volatility is too big to justify a stop-loss order in case of this particular trade)
Alternatively, if one seeks leverage, we’re providing the binding profit-take levels for the JDST (2x leveraged) and GDXD (3x leveraged – which is not suggested for most traders/investors due to the significant leverage). The binding profit-take level for the JDST: $16.18; stop-loss for the JDST: none (the volatility is too big to justify a SL order in case of this particular trade); binding profit-take level for the GDXD: $32.08; stop-loss for the GDXD: none (the volatility is too big to justify a SL order in case of this particular trade).
For-your-information targets (our opinion; we continue to think that mining stocks are the preferred way of taking advantage of the upcoming price move, but if for whatever reason one wants / has to use silver or gold for this trade, we are providing the details anyway.):
Silver futures downside profit-take exit price: $19.12
SLV profit-take exit price: $17.72
ZSL profit-take exit price: $41.38
Gold futures downside profit-take exit price: $1,683
HGD.TO – alternative (Canadian) inverse 2x leveraged gold stocks ETF – the upside profit-take exit price: $12.48
HZD.TO – alternative (Canadian) inverse 2x leveraged silver ETF – the upside profit-take exit price: $30.48
Long-term capital (core part of the portfolio; our opinion): No positions (in other words: cash
Insurance capital (core part of the portfolio; our opinion): Full position
Whether you already subscribed or not, we encourage you to find out how to make the most of our alerts and read our replies to the most common alert-and-gold-trading-related-questions.
Please note that we describe the situation for the day that the alert is posted in the trading section. In other words, if we are writing about a speculative position, it means that it is up-to-date on the day it was posted. We are also featuring the initial target prices to decide whether keeping a position on a given day is in tune with your approach (some moves are too small for medium-term traders, and some might appear too big for day-traders).
Additionally, you might want to read why our stop-loss orders are usually relatively far from the current price.
Please note that a full position doesn't mean using all of the capital for a given trade. You will find details on our thoughts on gold portfolio structuring in the Key Insights section on our website.
As a reminder - "initial target price" means exactly that - an "initial" one. It's not a price level at which we suggest closing positions. If this becomes the case (like it did in the previous trade), we will refer to these levels as levels of exit orders (exactly as we've done previously). Stop-loss levels, however, are naturally not "initial", but something that, in our opinion, might be entered as an order.
Since it is impossible to synchronize target prices and stop-loss levels for all the ETFs and ETNs with the main markets that we provide these levels for (gold, silver and mining stocks - the GDX ETF), the stop-loss levels and target prices for other ETNs and ETF (among other: UGL, GLL, AGQ, ZSL, NUGT, DUST, JNUG, JDST) are provided as supplementary, and not as "final". This means that if a stop-loss or a target level is reached for any of the "additional instruments" (GLL for instance), but not for the "main instrument" (gold in this case), we will view positions in both gold and GLL as still open and the stop-loss for GLL would have to be moved lower. On the other hand, if gold moves to a stop-loss level but GLL doesn't, then we will view both positions (in gold and GLL) as closed. In other words, since it's not possible to be 100% certain that each related instrument moves to a given level when the underlying instrument does, we can't provide levels that would be binding. The levels that we do provide are our best estimate of the levels that will correspond to the levels in the underlying assets, but it will be the underlying assets that one will need to focus on regarding the signs pointing to closing a given position or keeping it open. We might adjust the levels in the "additional instruments" without adjusting the levels in the "main instruments", which will simply mean that we have improved our estimation of these levels, not that we changed our outlook on the markets. We are already working on a tool that would update these levels daily for the most popular ETFs, ETNs and individual mining stocks.
Our preferred ways to invest in and to trade gold along with the reasoning can be found in the how to buy gold section. Furthermore, our preferred ETFs and ETNs can be found in our Gold & Silver ETF Ranking.
As a reminder, Gold & Silver Trading Alerts are posted before or on each trading day (we usually post them before the opening bell, but we don't promise doing that each day). If there's anything urgent, we will send you an additional small alert before posting the main one.
Thank you.
Przemyslaw Radomski, CFA
Founder, Editor-in-chief

