

Briefly: in our opinion, full (300% of the regular position size) speculative short positions in junior mining stocks are justified from the risk/reward point of view at the moment of publishing this Alert.
Gold moved visibly lower yesterday, silver closed at the second-lowest level in over 2 years, and miners (both GDX and GDXJ) formed their lowest daily close in over 2 years! Profits from our short positions have increased once again.
Let’s take a closer look at what happened.
The freefall in gold stocks continues. Remember when I wrote that miners were about to slide profoundly, when they were trading over 320 earlier this year? Very few of my colleagues agreed, and some laughed. I guess the laughter is silent by now.
The weakness that we saw in previous weeks – and during yesterday’s session – is truly profound, and what I wrote about it yesterday remains even more up-to-date, as we have now seen a breakdown to fresh lows. Quoting my yesterday’s analysis:
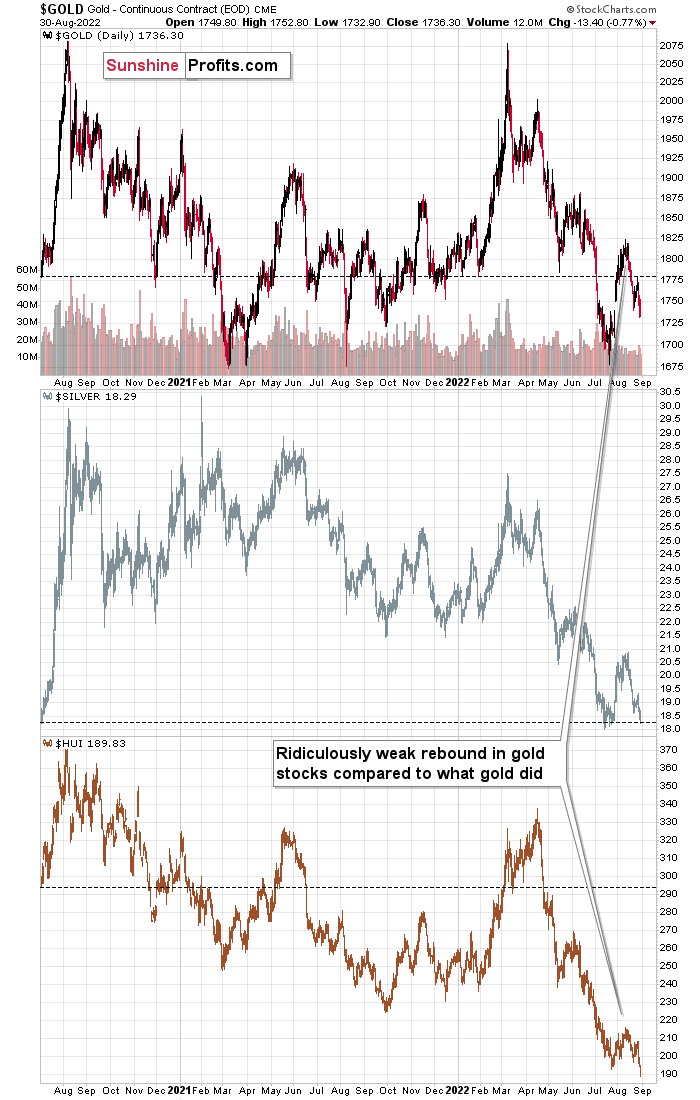
Gold and silver are currently more or less where they were trading about two years ago (before the final part of the mid-2020 rally).
What about gold stocks? The HUI Index would have to rally by almost 50% in order to get back to those analogous price levels!
Gold stocks usually lead gold higher and lower (there are some short-term exceptions, but they are not really applicable right now), and there’s no doubt that miners currently lead gold lower.
Please consider the size of the recent corrective upswing in gold, then in silver, and next, please look at how “much” gold stocks rallied.
Laughable, isn’t it?
Not only that – gold stocks already gave away almost the entire rally, even though gold is only about halfway down.
If you think that this is extremely bearish, then… Of course, you’re right. However, the situation is actually even more extreme than that.
You see, that’s the same thing we saw on the precious metals market in 2013, right before the biggest part of the slide!
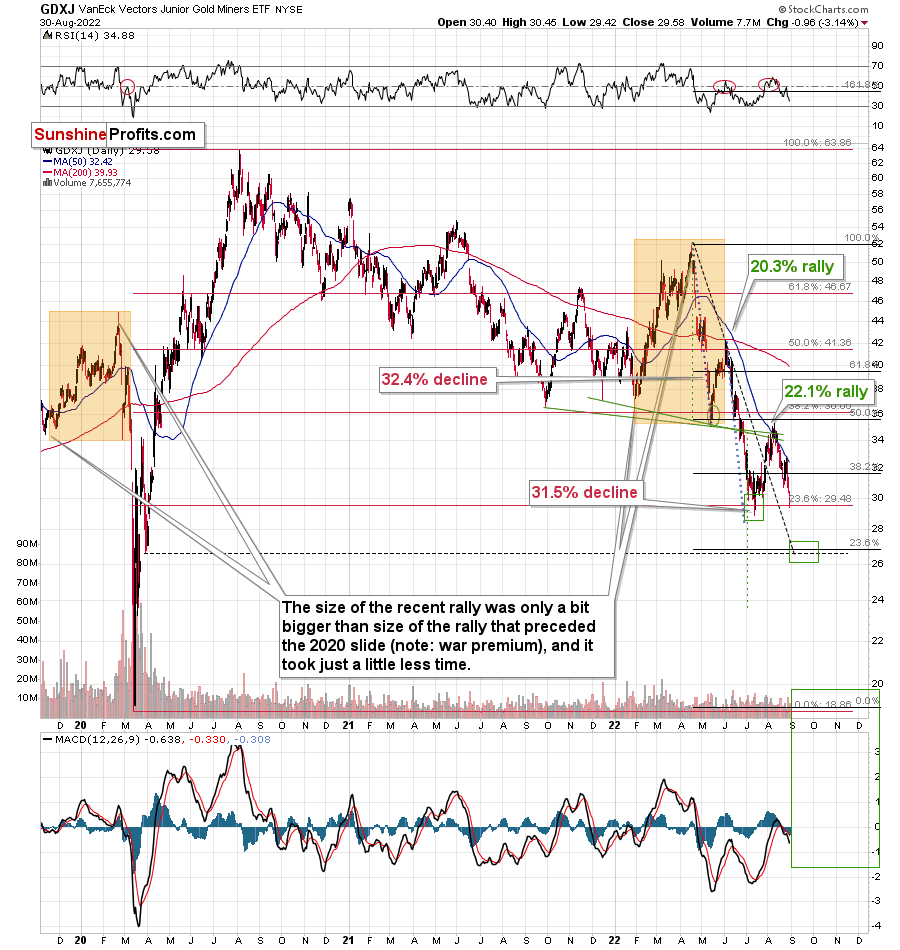
Now, as far as the GDXJ is concerned, it really seems that it’s on its way to its 2020 lows. The question is whether it will get there in the 2020 style or whether the decline will be more measured. If so, then where the corrections might be, and whether it’s a good idea to try to trade them.
Back in 2020, we had a global panic based on something that the modern markets haven’t experienced before (the pandemic, lockdowns). Now we have “relatively regular carnage.” The rates are going up, as well as the USD, and the stock market is going down.
However, it’s not a massive-event driven price move, and thus it can – and is likely to – take place in a rather regular manner.
So, while it’s still likely to be huge, like what we saw in 2008 and 2013, it’s also likely to be more measured and thus technical.
Back in 2008, the price moves were bankruptcy-news driven, while in 2013 the decline took the regular form. Despite the initial reason for gold to move up (Russian invasion in Ukraine), it failed to hold on to its gains, and instead it started to decline in a very visible way. Silver and miners are declining even more and faster.
The pressures from the USD Index and real interest rates are now greater than they were back in 2013, so the current decline has “bigger legs”. It lacks the dramatic circumstances of 2008, though.
What does it all mean? It indicates that the current big move lower is likely to be at least as significant as what we saw in 2013, but at the same time that it might be easier to trade than with the huge price swings that we saw in 2008.
Where does this discussion get us? It gets us to the indication that it’s still possible that we get a reliable rebound from the $27-28 area in the GDXJ, while gold rebounds one last time from the previous lows.
I previously commented that the above move is too uncertain to bet on it, and this remains to be the case However, I would like to point out that it’s still possible that I will write about adjusting the trade at those levels, after all.
This will depend heavily on the way in which the precious metals market falls in the following days. The more sudden and sharper the drop, and the stronger miners are relative to gold (so far this is completely absent), the bigger the odds that we’ll see a corrective upswing.
I’ll keep you informed.
Having said that, let’s take a look at the markets from a more fundamental point of view.
Reality Reigns
With the GDXJ ETF and the S&P 500 suffering another daily slump on Aug. 30, the former closed at a new 2022 low. Moreover, with Fed officials continuing to hammer the financial markets, the medium-term outlooks for gold, silver, and mining stocks remain profoundly bearish.
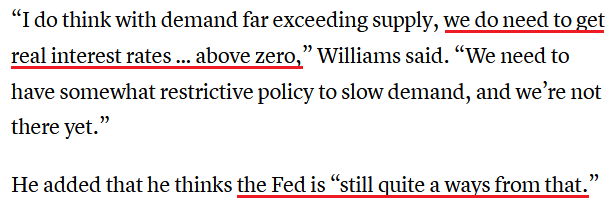
For example, New York Fed President John Williams said on Aug. 30 that “We’re going to need to have restrictive policy for some time” because “the historical record cautions strongly against prematurely loosening policy.”
As a result, while I warned that a repeat of the 1970s/1980s is the worst possible outcome for the U.S. economy, Williams is the third Fed official to highlight this reality. Moreover, with the Fed’s war on inflation creating ‘real’ problems for the PMs, tighter financial conditions should continue to hurt their performances in the months ahead.
Please see below:
 Source: CNBC
For context, Williams was referencing short-term real interest rates, as long-term real yields (10Y) are already positive. In addition, while Richmond Fed President Thomas Barkin said the U.S. is not in a recession at the moment and the "job market is still very tight." he added on Aug. 30:
"We're focused on getting inflation down, which based on my conversations, everybody hates inflation. Everybody wants that to come down. So that's what we're focused on."
Thus, with the fundamental realities coming back to bite the bulls, my comments from Apr. 6 continue to prove prescient:
Please remember that the Fed needs to slow the U.S. economy to calm inflation, and rising asset prices are mutually exclusive to this goal. Therefore, officials should keep hammering the financial markets until investors finally get the message.
Moreover, with the Fed in inflation-fighting mode and reformed doves warning that the U.S. economy “could teeter” as the drama unfolds, the reality is that there is no easy solution to the Fed’s problem. To calm inflation, it has to kill demand. As that occurs, investors should suffer a severe crisis of confidence.
A Resilient U.S. Labor Market
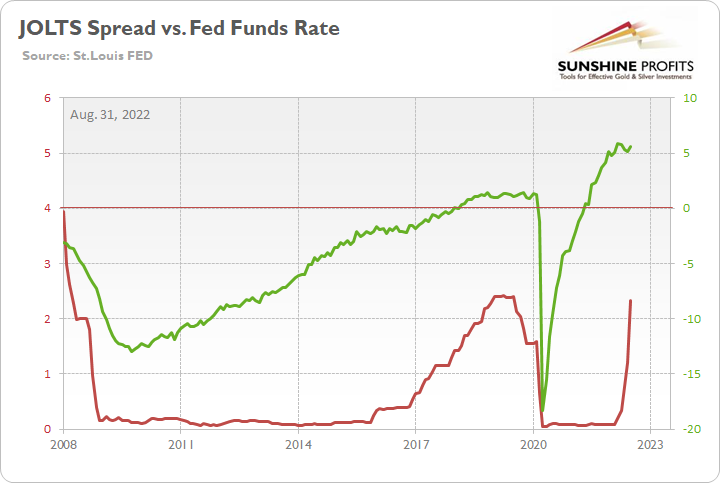
With employment making up one-half of the Fed’s dual mandate, I warned on May 4 that the U.S. labor market’s outperformance spelled trouble for financial assets. For context, the green line below (JOLTS spread) subtracts the number of unemployed U.S. citizens from the number of U.S. job openings. I wrote:
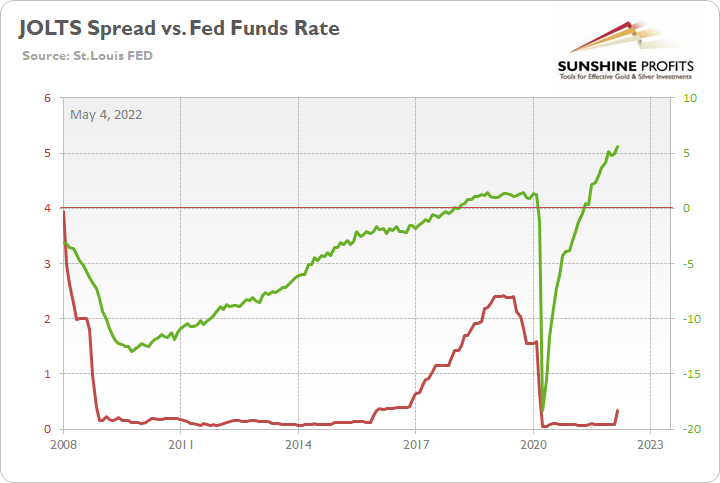
To explain, the green line above tracks the job openings spread, while the red line above tracks the U.S. federal funds rate. If you analyze the relationship, you can see that the spread’s move toward neutral was a hawkish indicator.
Likewise, with the spread positive and at an all-time high, the data alone justifies several rate hikes. However, as mentioned, we also have a YoY headline CPI that’s at its highest level since the 1980s. Thus, if investors assume the Fed lacks the ammunition to follow through with its hawkish promises, they should suffer the same fate as the “transitory” camp did in 2021-2022.
To that point, JOLTS job openings came in at 11.239 million versus 10.475 million expected on Aug. 30, and there are nearly 5.6 million more job openings than Americans unemployed.
Please see below:
 Source: Investing.com
More importantly, with a solid U.S. labor market strengthening the Fed’s resolve, the thesis proved prescient as the U.S. federal funds rate (FFR) has moved materially higher in recent months.
Please see below:
Furthermore, with output inflation still profoundly unanchored and the U.S. unemployment rate still way too low to reduce wage inflation, the data above should help keep the Fed’s foot on the hawkish accelerator.
As further evidence, the Conference Board’s labor differential paints a similar portrait. For context, the metric is calculated by subtracting the jobs are “hard to get” responses from the jobs are “plentiful” responses.
Please see below:
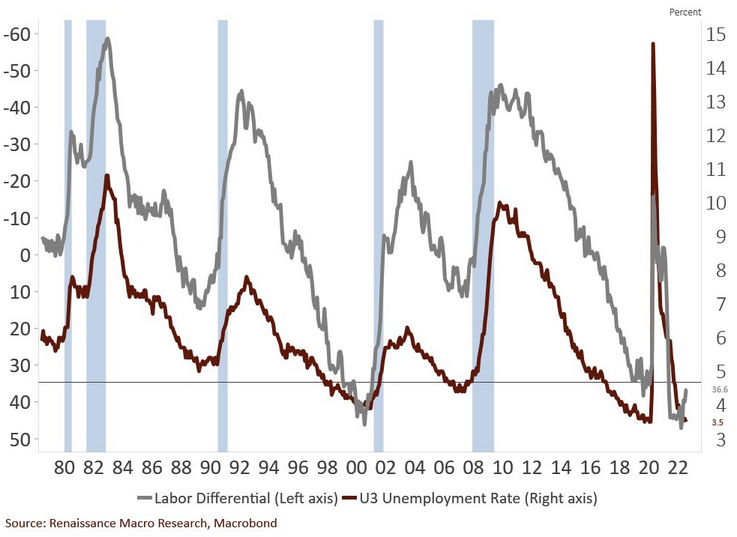
To explain, the red line above tracks the U.S. unemployment rate, while the gray line above tracks the inverted (down means up) labor differential. If you analyze the relationship, you can see that when “plentiful” responses outweigh “hard to get” responses, the U.S. unemployment rate often reaches cycle lows. Therefore, with the gray line only slightly below its all-time high, the Fed needs to continue its hawkish crusade to cool the U.S. labor market, and this realization is profoundly bearish for the PMs.
Likewise, it’s important to note that cycle highs in the labor differential and cycle lows in the U.S. unemployment rate are often present before recessions (the vertical blue bars above). As such, I warned on Aug. 12 that bear markets don’t end with the U.S. unemployment rate at a ~50-year low; they begin with the metric at a ~50-year low, as increasing unemployment to normalize inflation is a painful economic endeavor. I wrote:
The U.S. unemployment rate hit a new 2022 low of 3.5% in July. However, the metric always bottoms before a recession.
Please see below:
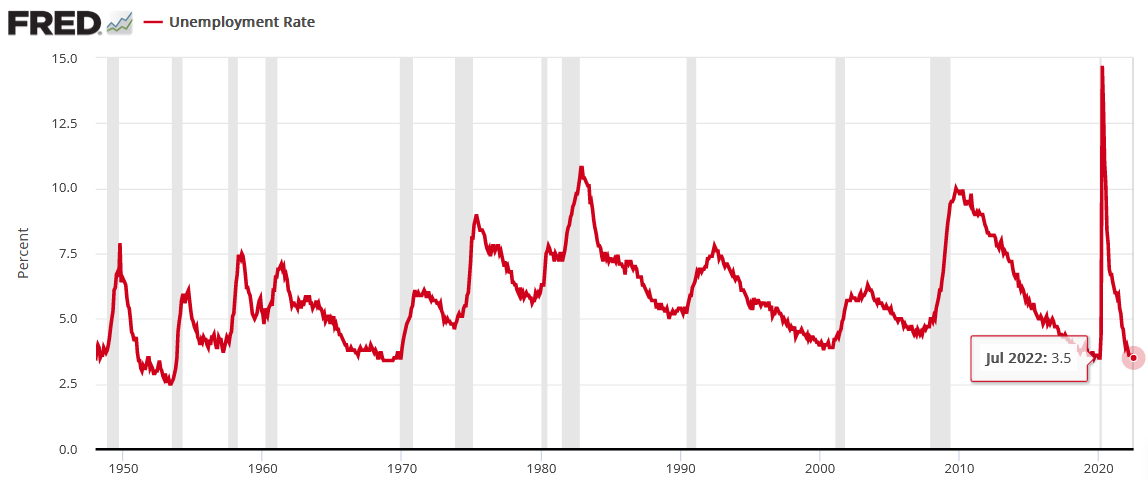
To explain, notice how the U.S. unemployment rate always troughs and then steadily rises before a recession hits? Thus, with the metric heading south in July, the bearish turn still awaits us. Of course, the uninformed crowd assumes that this time is different.
The S&P 500’s Plight
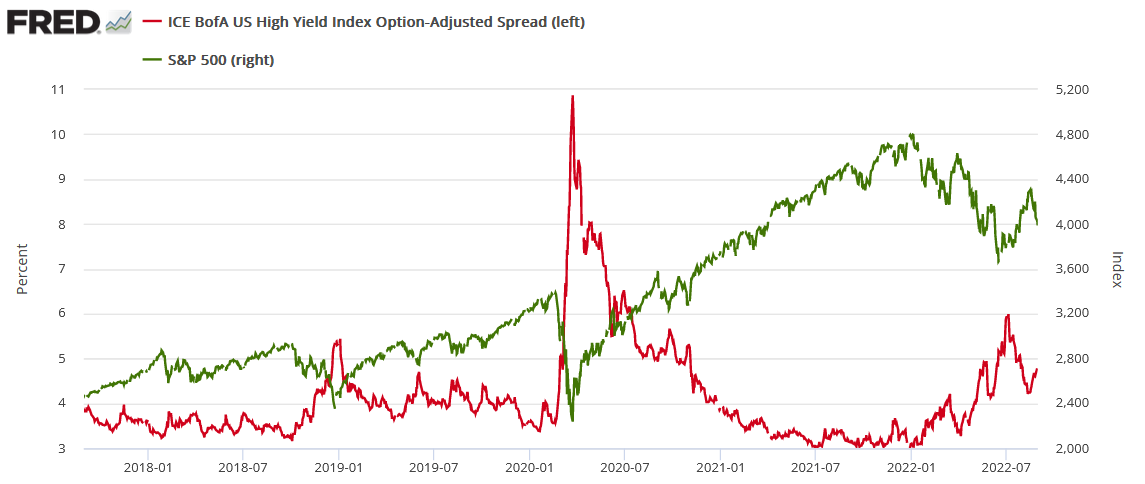
The GDXJ ETF is more correlated with the S&P 500 than its precious metals peers, so monitoring the latter’s behavior is particularly important. Moreover, with high yield credit spreads often acting as the S&P 500’s canary in the coal mine, I warned on Aug. 8 that higher real yields, a stronger U.S dollar, and wider high yield credit spreads were necessary to tighten financial conditions and reduce inflation. I wrote:
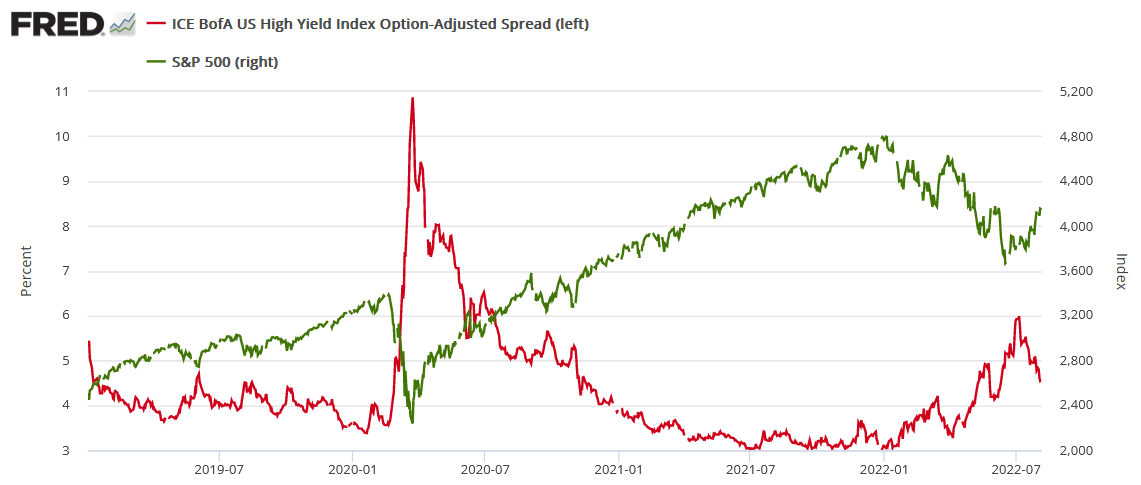
To explain, the red line above tracks the high yield option-adjusted spread (OAS), while the green line above tracks the S&P 500. For context, the OAS is the interest rate above U.S. Treasury yields that investors require to own the riskiest U.S. debt.
If you analyze the right side of the chart, you can see that the metric has declined sharply over the last month. As a result, it’s cheaper for risky companies to obtain financing, and the development supports economic growth.
Furthermore, with the S&P 500 often moving in the opposite direction, you can see how a declining OAS helped embolden the equity bulls (as evidenced by the green line rising on the right side of the chart). However, if the Fed wants to curb inflation, it needs a higher OAS and a lower S&P 500, and a realization is bearish for the PMs.
To that point, with reality back in style, the OAS has moved higher, while the S&P 500 has moved lower.
Please see below:
Thus, with the thesis playing out as expected, more fireworks should erupt in the months ahead. For example, the U.S. 10-Year Treasury yield and the equity risk premium (ERP) play important roles in shaping the S&P 500’s forward price-to-earnings (P/E) ratio. In a nutshell: when risk-free assets like Treasuries (from a default perspective) offer higher returns (interest rates), the S&P 500 is less attractive and should trade at a lower forward P/E multiple.
Please see below:
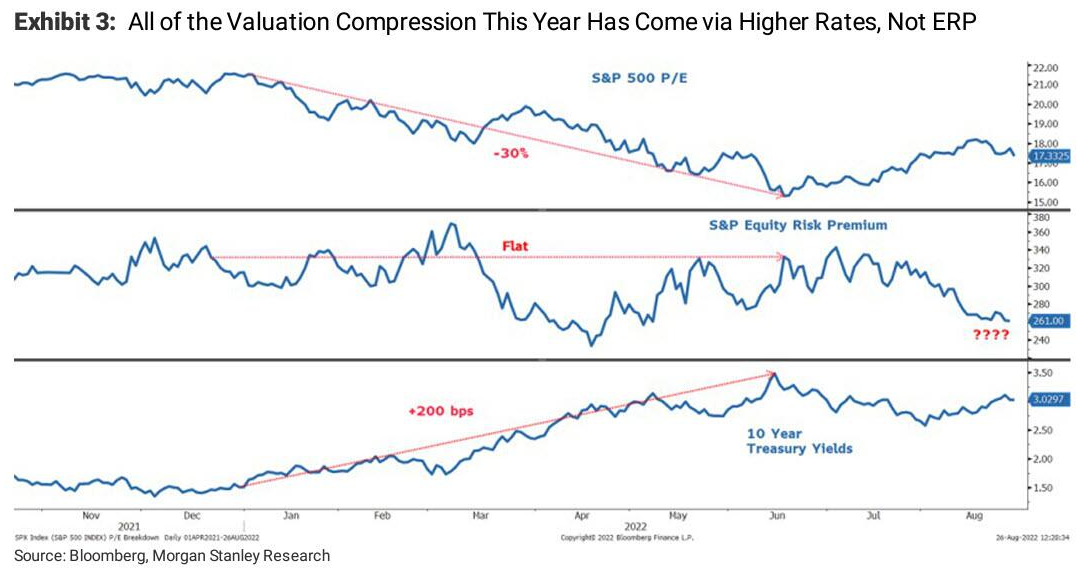
To explain, the top and bottom panes above show how the S&P 500’s forward P/E peaked and moved lower in late 2021 as the U.S. 10-Year Treasury yield bottomed and moved higher. Moreover, the prior decline in interest rates helped fuel the S&P 500’s recent bear market rally.
However, the middle pane also deserves attention. With the ERP not reflecting the risks during the U.S. 10-Year Treasury yield’s ascent and actually declining in 2022, the ERP is much too low, given the ominous fundamental outlook. As a result, complacent investors have yet to show any real fear, and an eventual shift should help ignite the S&P 500’s next leg lower.
In addition, Mike Wilson, Chief U.S. Equity Strategist at Morgan Stanley, told clients that the only time the ERP has been lower in the last 14 years was at the end of the bear market rally in March. Therefore, the figure should be closer to 400 basis points, not 260 basis points, and a convergence implies an S&P 500 forward P/E of 14x – which is much lower than the current reading of ~17x.
The Bottom Line
With gold, silver, and mining stocks suffering more sharp sell-offs on Aug. 30, the technicals and the fundamentals continue to unfold as expected. So while the GDXJ ETF has been one of the worst performing assets in 2022, the junior miners’ index is also down by more than 40% from its closing high set during the Russia-Ukraine conflict. Thus, while the permabulls were eager to call for new record highs during the invasion, staying level-headed and avoiding the FOMO has proved profitable.
In conclusion, the PMs declined on Aug. 30, as the financial markets remained on edge. Moreover, with the USD Index and the U.S. 10-Year real yield poised to move even higher over the medium term, gold, silver and mining stocks should head in the opposite directions. As such, we believe that shorting the GDXJ ETF still offers a solid risk-reward proposition.
Overview of the Upcoming Part of the Decline
- It seems to me that the corrective upswing is over, and that the next big move lower is already underway.
- If we see a situation where miners slide in a meaningful and volatile way while silver doesn’t (it just declines moderately), I plan to – once again – switch from short positions in miners to short positions in silver. At this time, it’s too early to say at what price levels this could take place and if we get this kind of opportunity at all – perhaps with gold prices close to $1,600.
- I plan to exit all remaining short positions once gold shows substantial strength relative to the USD Index while the latter is still rallying. This may be the case with gold prices close to $1,400. I expect silver to fall the hardest in the final part of the move. This moment (when gold performs very strongly against the rallying USD and miners are strong relative to gold after its substantial decline) is likely to be the best entry point for long-term investments, in my view. This can also happen with gold close to $1,400, but at the moment it’s too early to say with certainty.
- The above is based on the information available today, and it might change in the following days/weeks.
You will find my general overview of the outlook for gold on the chart below:
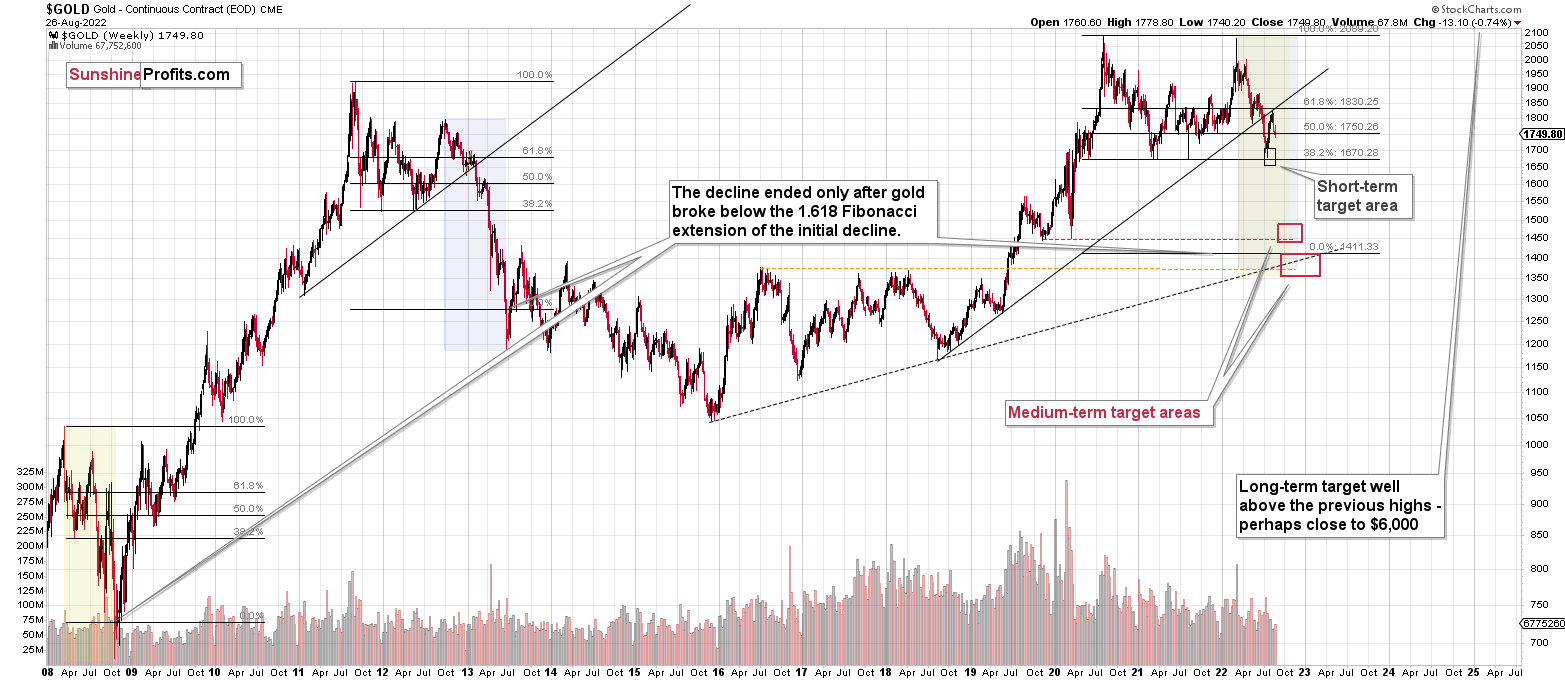
Please note that the above timing details are relatively broad and “for general overview only” – so that you know more or less what I think and how volatile I think the moves are likely to be – on an approximate basis. These time targets are not binding nor clear enough for me to think that they should be used for purchasing options, warrants, or similar instruments.
Summary
Summing up, it seems that the corrective upswing is over, which means that the powerful medium-term downtrend can now resume.
You have been profiting from how this situation develops practically throughout the entire year, and the above indicates (I’m not making any guarantees, of course) that the biggest gains are likely just ahead.
After the final sell-off (that takes gold to about $1,350-$1,500), I expect the precious metals to rally significantly. The final part of the decline might take as little as 1-5 weeks, so it's important to stay alert to any changes.
As always, we'll keep you – our subscribers – informed.
To summarize:
Trading capital (supplementary part of the portfolio; our opinion): Full speculative short positions (300% of the full position) in junior mining stocks are justified from the risk to reward point of view with the following binding exit profit-take price levels:
Mining stocks (price levels for the GDXJ ETF): binding profit-take exit price: $20.32; stop-loss: none (the volatility is too big to justify a stop-loss order in case of this particular trade)
Alternatively, if one seeks leverage, we’re providing the binding profit-take levels for the JDST (2x leveraged). The binding profit-take level for the JDST: $29.87; stop-loss for the JDST: none (the volatility is too big to justify a SL order in case of this particular trade).
For-your-information targets (our opinion; we continue to think that mining stocks are the preferred way of taking advantage of the upcoming price move, but if for whatever reason one wants / has to use silver or gold for this trade, we are providing the details anyway.):
Silver futures downside profit-take exit price: $12.32
SLV profit-take exit price: $11.32
ZSL profit-take exit price: $79.87
Gold futures downside profit-take exit price: $1,504
HGD.TO – alternative (Canadian) 2x inverse leveraged gold stocks ETF – the upside profit-take exit price: $19.87
HZD.TO – alternative (Canadian) 2x inverse leveraged silver ETF – the upside profit-take exit price: $49.87
Long-term capital (core part of the portfolio; our opinion): No positions (in other words: cash)
Insurance capital (core part of the portfolio; our opinion): Full position
Whether you’ve already subscribed or not, we encourage you to find out how to make the most of our alerts and read our replies to the most common alert-and-gold-trading-related-questions.
Please note that we describe the situation for the day that the alert is posted in the trading section. In other words, if we are writing about a speculative position, it means that it is up-to-date on the day it was posted. We are also featuring the initial target prices to decide whether keeping a position on a given day is in tune with your approach (some moves are too small for medium-term traders, and some might appear too big for day-traders).
Additionally, you might want to read why our stop-loss orders are usually relatively far from the current price.
Please note that a full position doesn't mean using all of the capital for a given trade. You will find details on our thoughts on gold portfolio structuring in the Key Insights section on our website.
As a reminder - "initial target price" means exactly that - an "initial" one. It's not a price level at which we suggest closing positions. If this becomes the case (as it did in the previous trade), we will refer to these levels as levels of exit orders (exactly as we've done previously). Stop-loss levels, however, are naturally not "initial", but something that, in our opinion, might be entered as an order.
Since it is impossible to synchronize target prices and stop-loss levels for all the ETFs and ETNs with the main markets that we provide these levels for (gold, silver and mining stocks - the GDX ETF), the stop-loss levels and target prices for other ETNs and ETF (among other: UGL, GLL, AGQ, ZSL, NUGT, DUST, JNUG, JDST) are provided as supplementary, and not as "final". This means that if a stop-loss or a target level is reached for any of the "additional instruments" (GLL for instance), but not for the "main instrument" (gold in this case), we will view positions in both gold and GLL as still open and the stop-loss for GLL would have to be moved lower. On the other hand, if gold moves to a stop-loss level but GLL doesn't, then we will view both positions (in gold and GLL) as closed. In other words, since it's not possible to be 100% certain that each related instrument moves to a given level when the underlying instrument does, we can't provide levels that would be binding. The levels that we do provide are our best estimate of the levels that will correspond to the levels in the underlying assets, but it will be the underlying assets that one will need to focus on regarding the signs pointing to closing a given position or keeping it open. We might adjust the levels in the "additional instruments" without adjusting the levels in the "main instruments", which will simply mean that we have improved our estimation of these levels, not that we changed our outlook on the markets. We are already working on a tool that would update these levels daily for the most popular ETFs, ETNs and individual mining stocks.
Our preferred ways to invest in and to trade gold along with the reasoning can be found in the how to buy gold section. Furthermore, our preferred ETFs and ETNs can be found in our Gold & Silver ETF Ranking.
As a reminder, Gold & Silver Trading Alerts are posted before or on each trading day (we usually post them before the opening bell, but we don't promise doing that each day). If there's anything urgent, we will send you an additional small alert before posting the main one.
Thank you.
Przemyslaw Radomski, CFA
Founder, Editor-in-chief

