

Briefly: in our opinion, full (300% of the regular position size) speculative short positions in junior mining stocks are justified from the risk/reward point of view at the moment of publishing this Alert. Moreover, while I see very little chance of those levels behind hit, I’m adding stop-loss orders for our current short positions. Since I’m placing them below the entry levels, they are effectively profit-protect orders. In other words, we are locking-in part of the profits, while letting them grow even more.
I would like to start today’s analysis with a quote from yesterday’s issue, where I replied to two questions that I received:
Q: It looks like we have an outside reversal day. This could spell trouble for your forecast. Any thoughts?
A: It could, or it could not. Is every counter-trend move the beginning of a big rally? No. There have to be some smaller breathers, and there will be. During the volatile 2008 slide, there were quite a few daily corrections, but none of them prevented gold stocks’ profound decline.
So, it’s a matter of asking a different question – does the way mining stocks rallied recently indicate anything more than a regular, normal breather? I don’t see any signs of that, so I don’t see a reason to think that the outlook has changed – in my view, it remains extremely bearish for the next weeks and months (please note that I’m not making any day-to-day predictions here).
Q: Question in Friday’s JDST market. Silver is down around 41, but the JDST is also down 85. I thought this was an inverse trade in which if silver is down, the JDST is up. Please explain the divergence.
A: The JDST is an inverse (2x leveraged) proxy for gold and silver junior (mostly) mining stocks, not for silver. There is a significant correlation between silver prices and junior mining stock prices, but ultimately it’s not the same market. While the medium-term moves are very likely to be aligned, there can be – and will be – some differences on a day-to-day basis.
On Friday, silver ended lower, while mining stocks ended higher. That’s likely a result of the fact that junior miners were so weak in the prior days that they already had to correct and silver was still in the decline mode. In my view, it doesn’t change anything with regard to the outlook for the next few weeks, which remains extremely bearish.
===
While I was not making day-to-day forecasts, we didn’t have to wait long for the market to agree with me.
Gold, silver, and mining stocks (major proxies for them) have all moved to new yearly lows during yesterday’s trading, and they are not back up (they’re rather flat) in today’s pre-market trading.
This is a significant bearish development, and it will finally convince many traders and investors that something is wrong with the bullish case for gold and the rest of the sector..
Why on earth would gold move to new yearly lows despite the ongoing war in Europe, the pandemic, and soaring inflation?
Because all of the above was already discounted in price, gold was still unable to move decisively above the $2,000 level. In fact, it failed to stay above its 2011 high, and that’s just gold. Silver and mining stocks were not even close to moving to their analogous price levels.
Gold’s failure to launch a proper rally was a massive indication that it’s not yet ready to move higher – it needs to decline massively first, which is what I’ve been writing for many months, but as new black swans kept popping up, gold was unable to complete its regular cyclical decline beforehand. So, it’s going now.
As real interest rates and the USD Index continue to climb, precious metal prices are likely to continue to decline – at least for several weeks. At some point, I expect gold, silver, and mining stocks to stop reacting to this bearish reality and show strength, thus indicating that the final long-term bottom is in. However, we are not there yet.
Based on analogies to how precious metals and mining stocks declined in the past, we have much lower to go, and we have much more money to make on our short positions. Speaking of which, if you are positioned in tune with what I’m describing as my general opinion in my Gold & Silver Trading Alerts, i.e., you are positioned to profit from a decline in junior mining stocks, you just made a lot of money yesterday, and in the last couple of weeks in general. This adds to the profits that you reaped on the preceding long position, which adds on top of the profits from the preceding short position. Congratulations!
After this lengthy introduction, let’s take a look at gold.
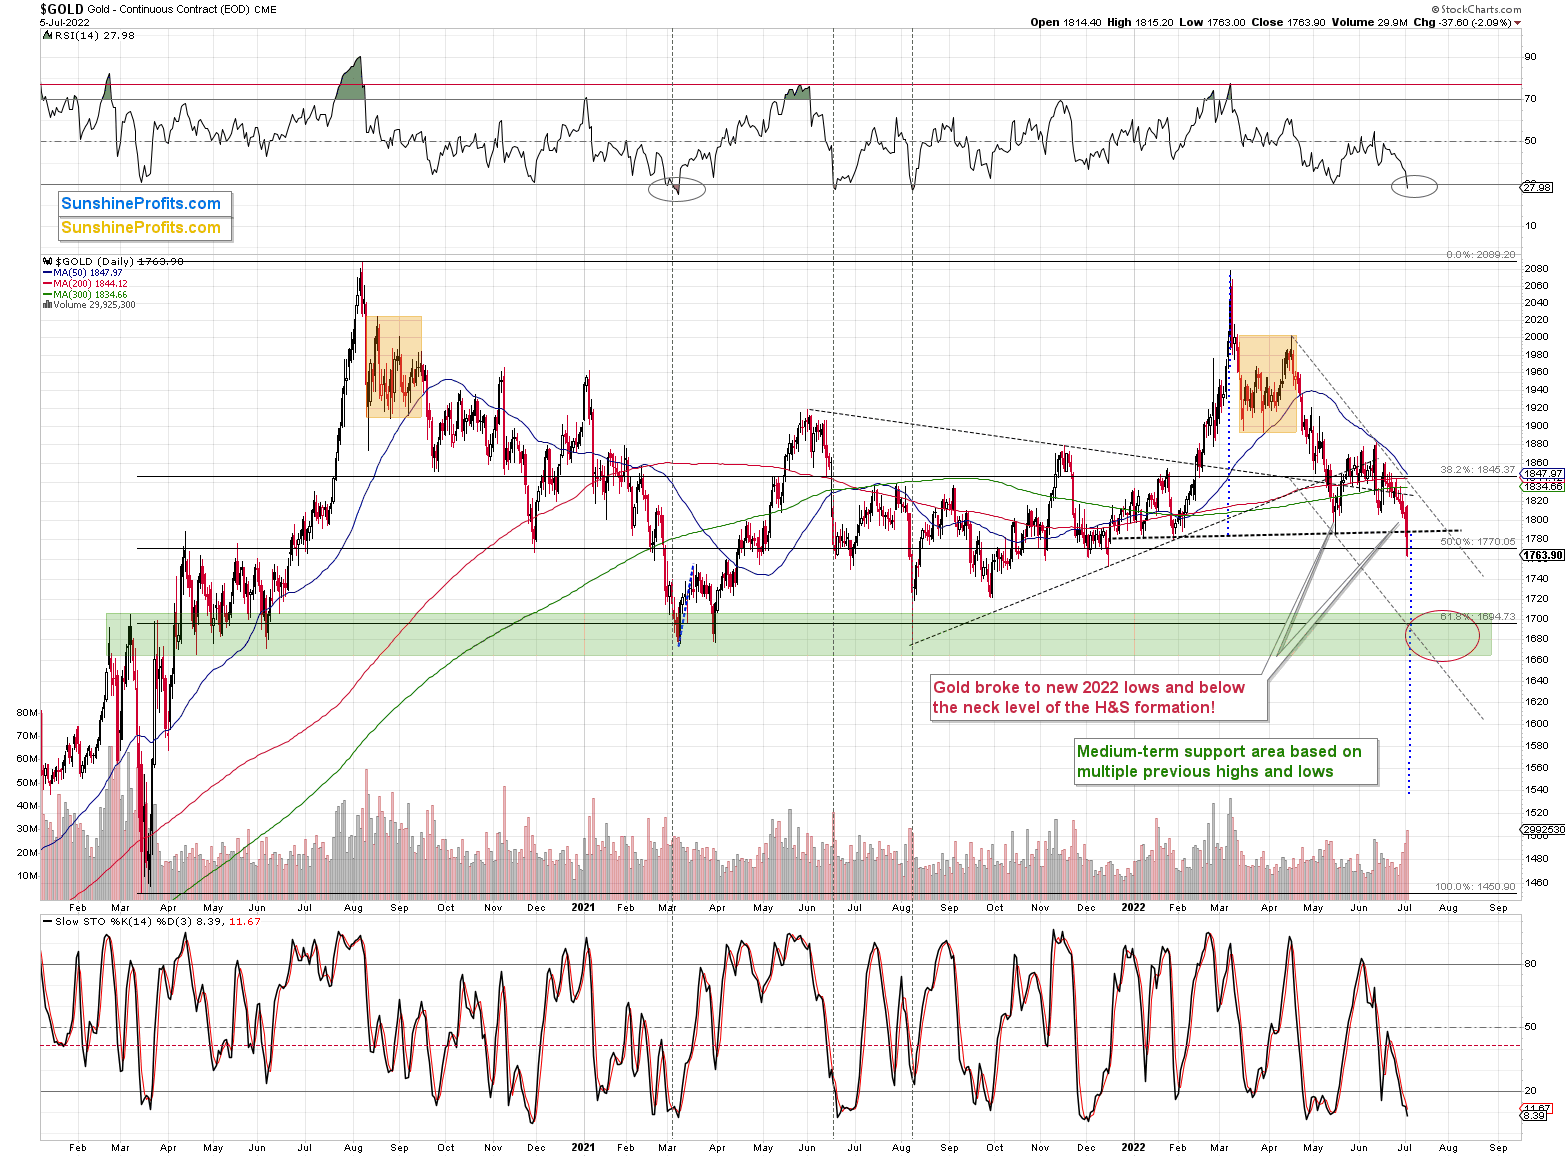
Gold just moved below the neck level of the previous head and shoulders pattern and also to new 2022 lows. The breakdown took place at a hisgh volume, so it appears believable.
However, at the same time, the RSI moved below 30, which is a classic buy signal. I marked the previous similar signals with vertical dashed lines. In all three previous cases, gold was either bottoming or about to bottom.
In particular, the early-2021 situation appears similar, because the preceding price action is also similar. The failed attempt to rally above $2,000, the consolidation (marked with orange rectangles), and the subsequent decline that also included a consolidation are all present in both cases.
Back in 2021, gold continued to decline until it moved below $1,700, and while it doesn’t guarantee the same thing right now, the fact that both declines started from highs at very similar price levels makes it quite likely.
So, what’s likely to happen next? Well, I see two likely short-term outcomes:
- Gold corrects a bit, thus verifying the breakdown below the neck level of the H&S formation and the previous 2022 low,. and it then continues to decline after the correction.
- Gold slides to or slightly below $1,700 right away - or almost right away, but quite possibly this week.
In the case of scenario 1, junior miners would be likely to correct slightly as well, and then slide.
In the case of scenario 2, junior miners would be likely to slide right away, possibly showing some kind of strength right before gold moves to its $1,700 target.
In both cases, I plan to keep the short positions intact until GDXJ or gold reaches its targets lower – I don’t plan to trade the rebound from scenario 1. Not all moves are worth trading, just like you’ll probably agree that Friday’s daily rally wasn’t worth trading. Those who attempted to trade it have probably missed or even were hurt by yesterday’s decline instead of profiting on it.
Now, if gold is to move to / a bit below $1,700, it would need to more or less additionally decline by about twice as much as it declined yesterday (it declined by $37.60).
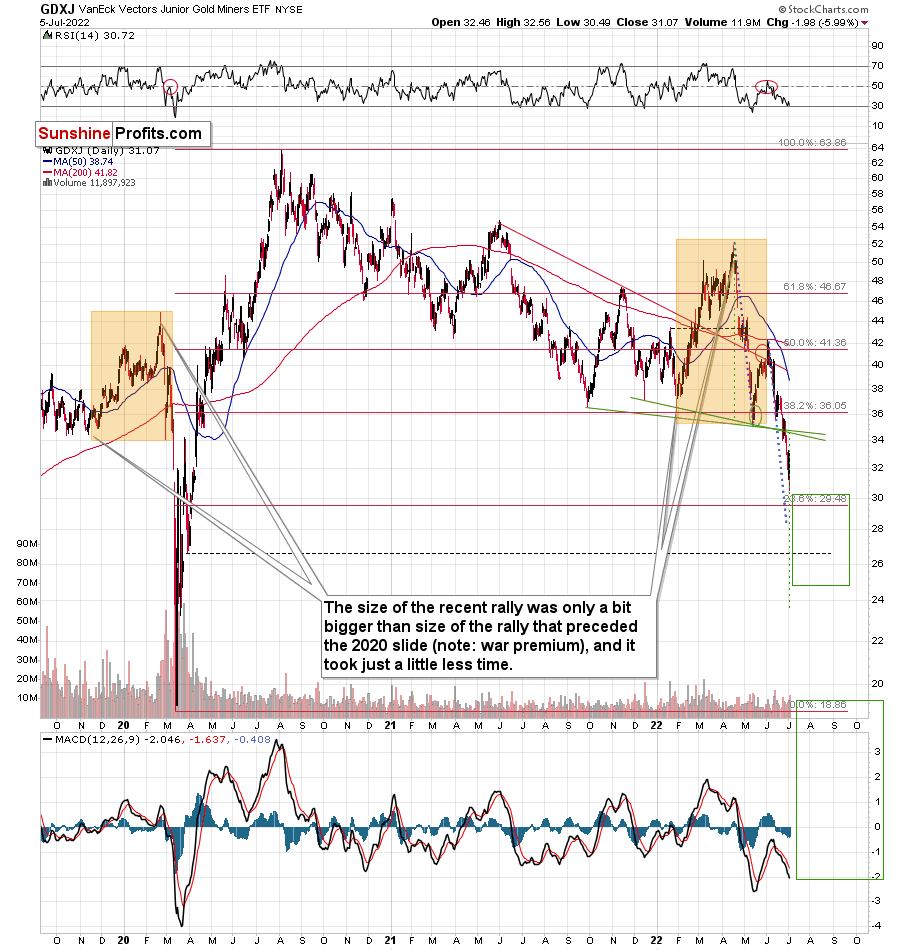
Applying the same to the GDXJ ETF means that it would need to decline by about 12% (it declined by 5.99% yesterday).
(1 – 0.12) x $31.07 = $27.34
That’s in perfect tune with my profit-take target for the current trade.
Also, please note that junior miners declined yesterday without the general stock market’s help. If the latter declines – and it’s likely to decline in the following weeks, so it might as well decline this week – the GDXJ might decline more rapidly relative to gold than it did yesterday.
All in all, it seems that the precious metals market is about to decline significantly, either right away, or after a correction, and that profits on our short positions in junior miners will increase even further.
Having said that, let’s take a look at the markets from a more fundamental point of view.
Mean Reversion
With the Russia-Ukraine conflict embedding the PMs with large war premiums, fear overtook rationality. Along the way, the S&P Goldman Sachs Commodity Index (S&P GSCI) was deemed invincible, as commodities became the most crowded trade on Wall Street.
For context, the S&P GSCI contains 24 commodities from all sectors: six energy products, five industrial metals, eight agricultural products, three livestock products and two precious metals. However, energy accounts for roughly 54% of the index’s movement.
However, I warned on Mar. 8 that illogical optimism often leads to ominous forward returns. I wrote:
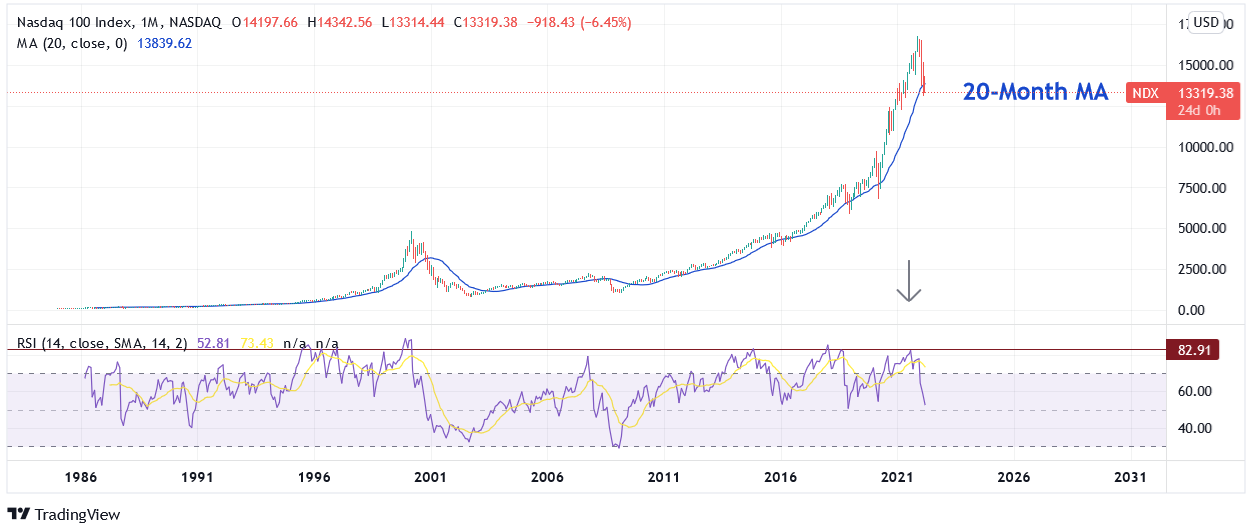
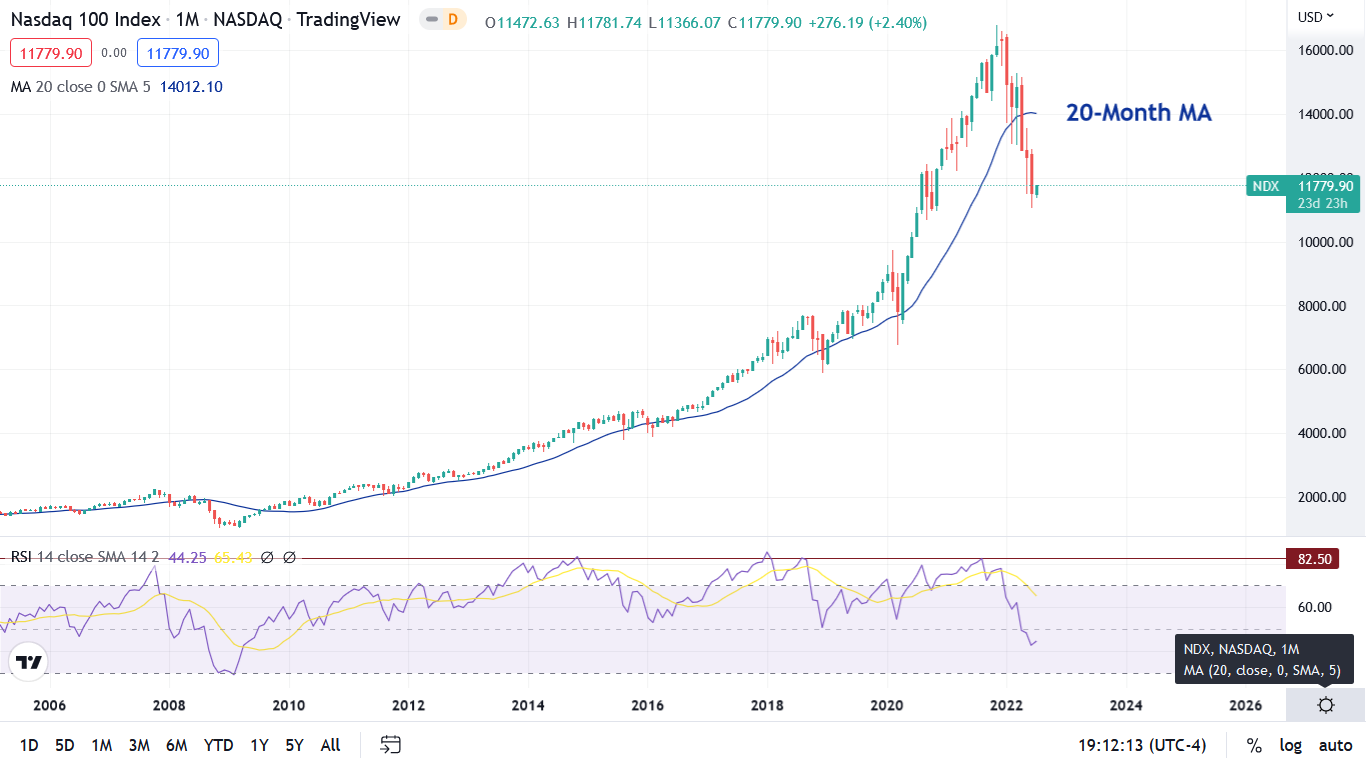
Investors took solace in the belief that no one would sell FAANG. However, after Netflix and Meta Platforms plunged by more than 40% recently, suddenly, the NASDAQ 100 wasn’t so popular anymore. As a result, sentiment shifted, and fundamental realities re-emerged.
Please see below:
(…) With commodities running wild amid the Russia-Ukraine conflict, the S&P GSCI has become the new FAANG. And with gold, silver and mining stocks riding the momentum higher, profound pain should confront the PMs when the all-time outperformance reverses.
Please see below:
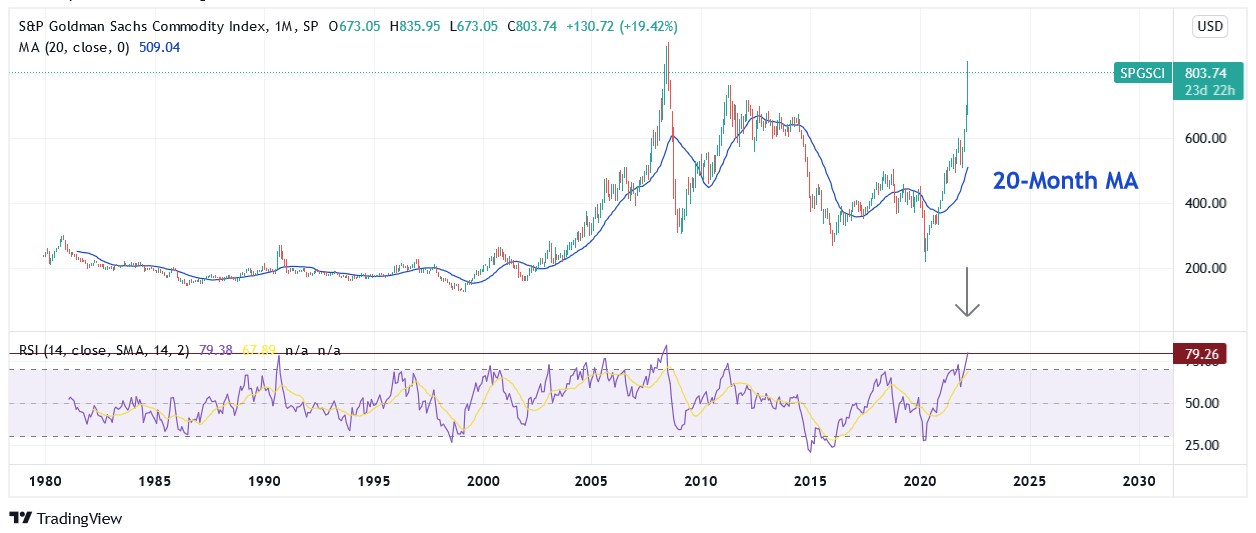
To explain, the chart above tracks the monthly performance of the S&P GSCI, while the blue line above tracks the index’s 20-month moving average, and the purple line on the bottom half of the chart tracks the index’s monthly RSI.
Now, if the month ended on Mar. 7, the S&P GSCI would record the third-highest monthly RSI of all time. For context, the only periods with higher monthly readings were May and June 2008.
Furthermore, if you analyze the right side of the chart, you can see that the S&P GSCI is now 58% above its 20-month MA, and this is the largest outperformance on record.
To that point, if you focus your attention on the long-term bull market from 2002 until roughly 2006, the S&P GSCI remained closely connected to its 20-month MA. Moreover, even during the vertical ascent from 2006 to 2008, peak intra-month outperformance of the 20-month MA was 56%. And today, if we use the current intra-month high, the outperformance is 64%. As a result, the S&P GSCI has never been more disconnected, and the PMs have been material beneficiaries.
Thus, with the law of gravity forcing investors to learn this lesson the hard way, the commodity complex imploded on Jul. 5 and the PMs were material casualties.
Please see below:
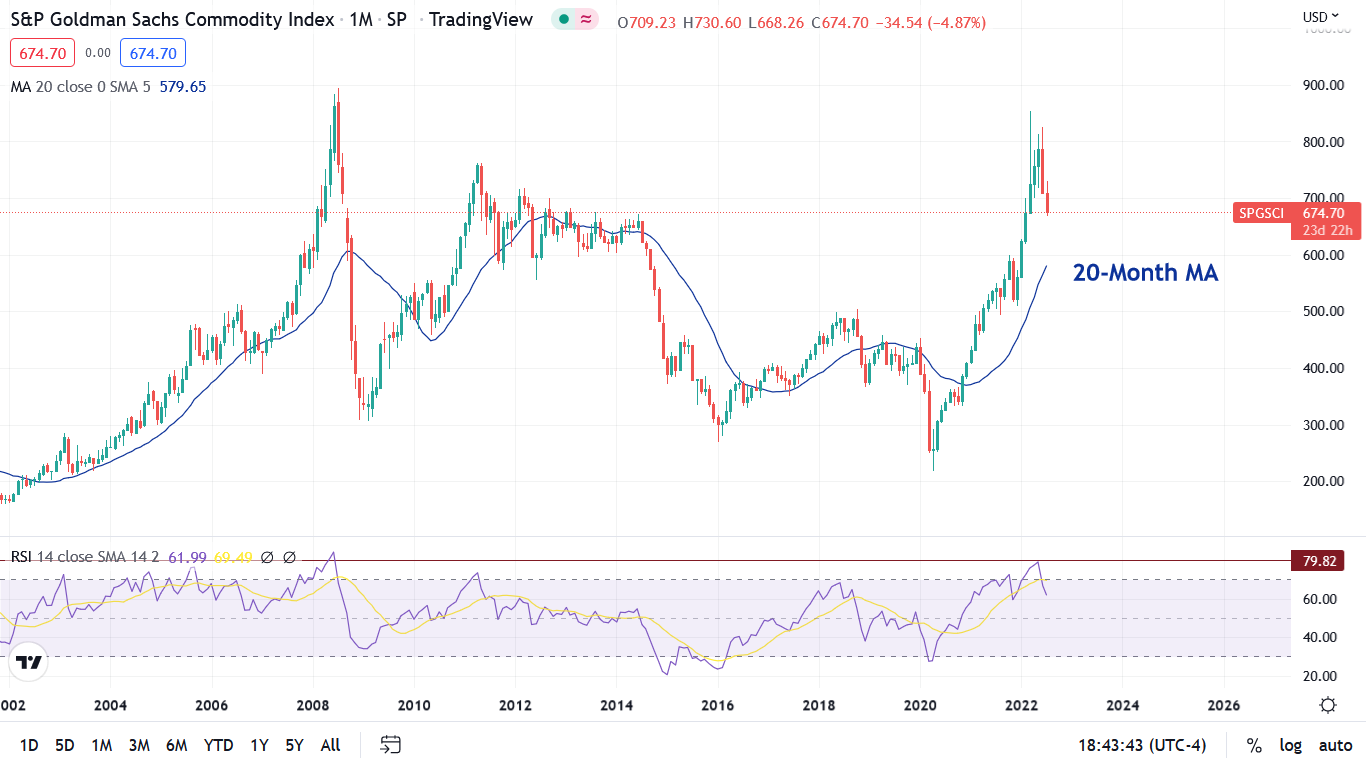
To explain, the S&P GSCI has declined by 16% since the Mar. 7 close. However, the material imbalance is still far from resolved. For example, reconnecting with the 20-month MA implies another 14% downside for the index. Furthermore, with the GDXJ ETF down by 35% from the Mar. 7 close, the junior miners are much more volatile than the S&P GSCI. As a result, if (when) the latter reconnects with its 20-month MA, the former should underperform.
Likewise, since the S&P GSCI’s recent ascent rivals the run-up to 2008, a U.S. recession should push the index well below its 20-month MA. If you analyze the left side of the chart, you can see that the S&P GSCI plunged below its 20-month MA during the global financial crisis (GFC).
Thus, while oversold conditions on the daily chart may elicit a short-term bounce, the important point is that the S&P GSCI and the NASDAQ 100 are two peas in a pod. When irrational exuberance materially decouples prices from their fundamental values, the technicals highlight the magnitude of the imbalance. Therefore, with the NASDAQ 100 well below its 20-month MA, can you guess where the S&P GSCI is headed over the medium term?
Bottom Fishing
While the S&P 500 rallied sharply off the bottom and closed in the green on Jul. 5, the optimism is unlikely to persist over the medium term.
Please see below:
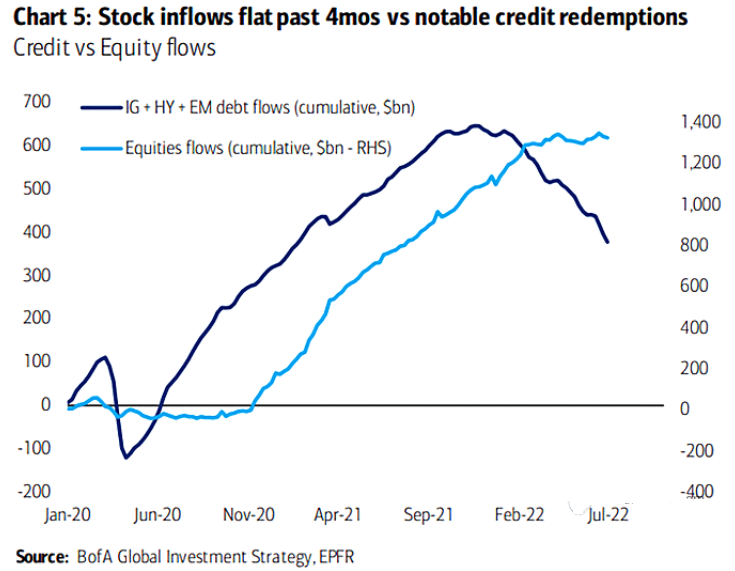
To explain, the light blue line above tracks the net flows into stocks, while the dark blue line above tracks the cumulative net flows into investment grade (IG), high yield (HY) and emerging market (EM) debt. For context, all three are risky forms of credit, as EM countries are highly cyclical and suffer from a strong U.S. dollar. Likewise, HY bonds are nearly synonymous with stocks because their priority in the capital structure is only one notch above. In a nutshell: if a company goes bankrupt, stockholders and HY bondholders often get wiped out.
To that point, notice how the dark blue line has declined substantially from its recent high? The data highlights how redemptions have drastically outweighed inflows. As a result, investors have been liquidating their positions in risky credit.
In contrast, the light blue line has remained uplifted. Therefore, investors continue to pour money into stocks even as the economic outlook deteriorates. However, their misguided faith should elicit a crisis of confidence over the medium term.
Furthermore, the bulls are not being compensated for equities’ inherent risk.
Please see below:
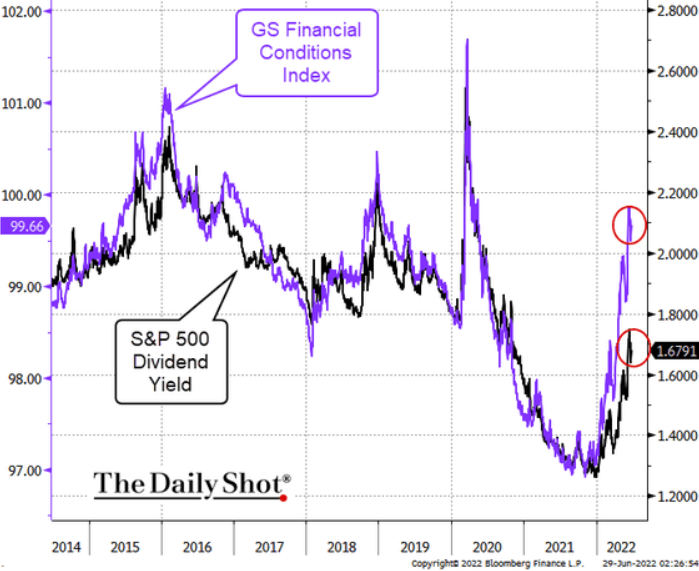
To explain, the purple line above tracks the Goldman Sachs Financial Conditions Index (FCI), while the black line above tracks the S&P 500’s dividend yield. When the purple line rises, financial conditions are tightening due to a hawkish Fed, a strong U.S. dollar, higher interest rates, and wider credit spreads.
Moreover, if you analyze the relationship, you can see that the pair often follow in each other’s footsteps. However, if you focus your attention on the right side of the chart, you can see that a material divergence is present. Thus, either financial conditions must loosen, or the S&P 500’s dividend yield needs to increase.
But with tighter financial conditions necessary to curb inflation, a lower FCI is unlikely. Therefore, either corporations must raise their dividends, or the S&P 500’s price needs to fall. As such, with the former unlikely given the current economic outlook, the latter should lead the charge in closing the gap.
Similarly, I’ve noted on numerous occasions that fear has gone extinct in the stock market. Despite massive intraday swings, the Cboe Volatility Index (VIX) hasn’t cracked 40 amid the S&P 500’s ~25% peak-to-trough drawdown. Moreover, data from Goldman Sachs highlights investors’ complacency.
Please see below:
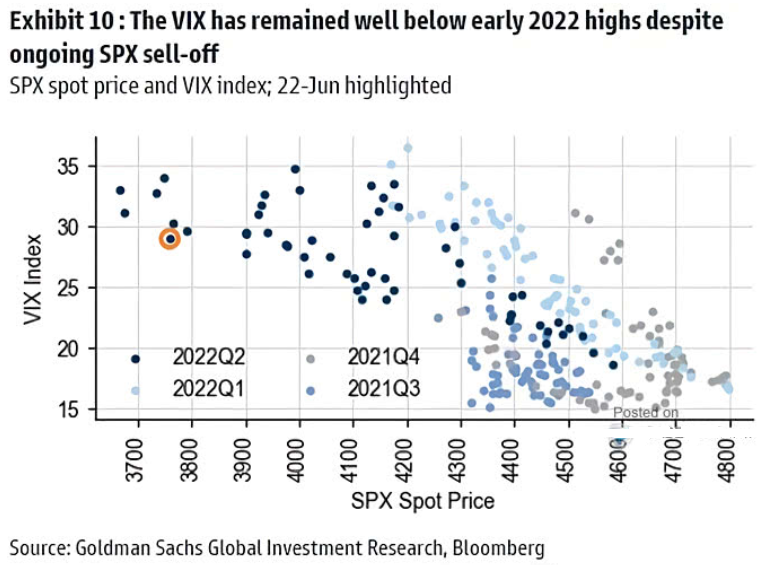
To explain, the scatterplot above highlights various VIX and S&P 500 price levels. If you analyze the light blue dots in the middle of the chart (at the top), you can see that the VIX surpassed 35 when the S&P 500 declined to ~4,200. Moreover, the gray dots on the right show that the VIX surpassed 30 when the S&P 500 declined to ~4,500.
Yet, with none of the dark blue dots on the left surpassing 35, even the drop below 3,700 didn't rattle the 'buy the dip' crowd. Also, the VIX closed below 28 on Jul. 5. However, while the consensus still expects the Fed to save the day, the reality is that high inflation changes the game.
Finally, the S&P 500's performance is important because the GDXJ ETF is more correlated with the general stock market than the other parts of the precious metals market. Furthermore, with Morgan Stanley Chief U.S. Equity Strategist Mike Wilson telling clients that "this slowdown is even worse than we expected," he added that "we could reach 3,000 late this year – a temporary overshoot of our bear case point in time June '23 price target of 3,350."
Please see below:
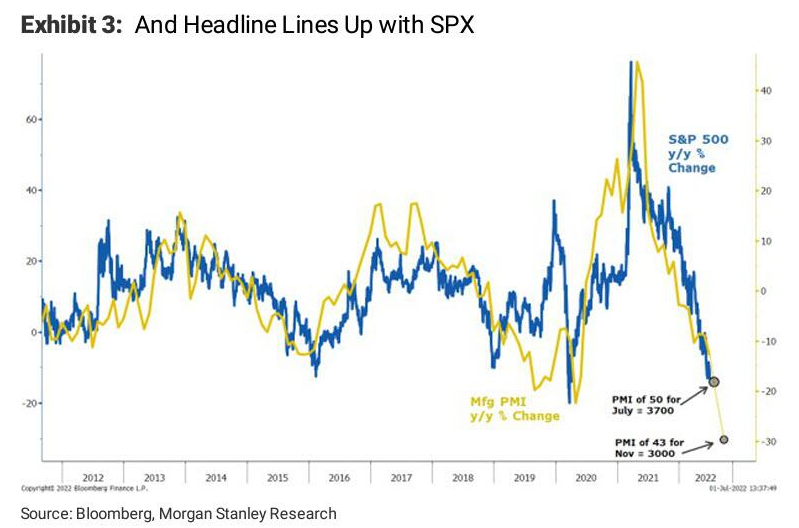
To explain, the blue line above tracks the year-over-year (YoY) percentage change in the S&P 500, while the yellow line above tracks the YoY percentage change in the Institute for Supply Management’s (ISM) Manufacturing PMI. For context, the ISM’s PMI came in at 53 on Jul. 1.
However, with further interest rate hikes poised to slow the U.S. economy, the PMI should suffer from the hawkish policies required to cool inflation. Therefore, while 50 implies an S&P 500 of 3,700, a recessionary contraction to 43 implies an S&P 500 of 3,000. Thus, with nearly 70 years of history showing that unanchored inflation ends with recessions, Wilson’s 3,000 target should prove prescient later in 2022.
The Bottom Line
With the old adage of ‘what goes up must come down’ pivoting from the NASDAQ 100 to the S&P GSCI, commodity investors have suffered mightily over the last month. However, with the index still materially disconnected from its 20-month MA, a return to reality should cause the PMs plenty of pain. Likewise, with corporate credit trading at levels unseen since the COVID-19 crash, follow-through by the S&P 500 should also contribute to the PMs’ plight. As a result, their medium-term outlooks are profoundly bearish.
In conclusion, the PMs declined on Jul. 5, as the commodities liquidation intensified. Moreover, with the USD Index hitting a new 2022 high, the PMs’ performances have unfolded as expected. Furthermore, with a stronger U.S. dollar and higher real yields key components to solving the Fed’s inflation conundrum, their bright future is extremely problematic for the PMs.
Overview of the Upcoming Part of the Decline
- It seems to me that the precious metals market is already in its medium-term decline that is about to take it much lower (to the 2021 lows in case of gold - $1,650 - $1,700)
- If we see a situation where miners slide in a meaningful and volatile way while silver doesn’t (it just declines moderately), I plan to – once again – switch from short positions in miners to short positions in silver. At this time, it’s too early to say at what price levels this could take place and if we get this kind of opportunity at all – perhaps with gold prices close to $1,600.
- If we see a situation where miners slide in a meaningful and volatile way while silver doesn’t (it just declines moderately), I plan to – once again – switch from short positions in miners to short positions in silver. At this time, it’s too early to say at what price levels this could take place and if we get this kind of opportunity at all – perhaps with gold prices close to $1,600.
- I plan to exit all remaining short positions once gold shows substantial strength relative to the USD Index while the latter is still rallying. This may be the case with gold close to $1,400. I expect silver to fall the hardest in the final part of the move. This moment (when gold performs very strongly against the rallying USD and miners are strong relative to gold after its substantial decline) is likely to be the best entry point for long-term investments, in my view. This can also happen with gold close to $1,400, but at the moment it’s too early to say with certainty.
- The above is based on the information available today, and it might change in the following days/weeks.
You will find my general overview of the outlook for gold on the chart below:
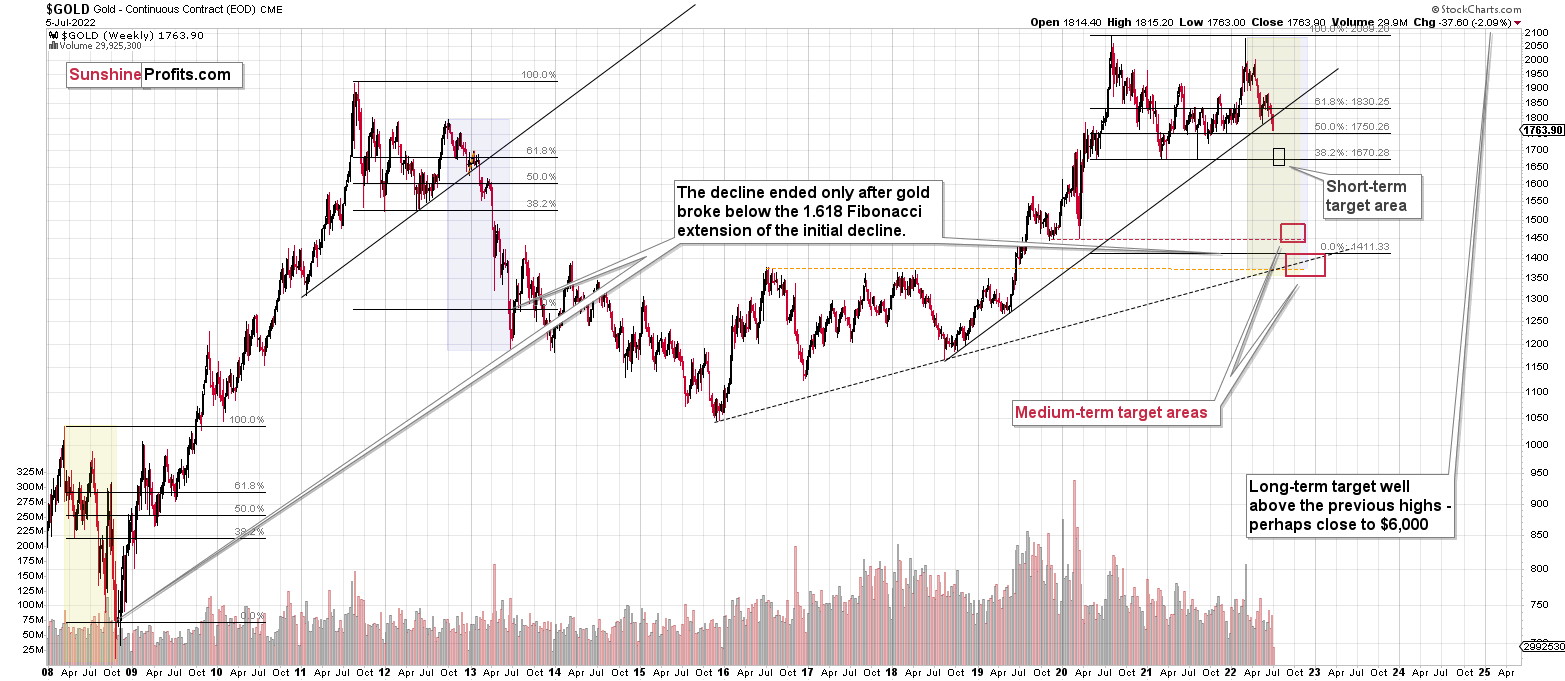
Please note that the above timing details are relatively broad and “for general overview only” – so that you know more or less what I think and how volatile I think the moves are likely to be – on an approximate basis. These time targets are not binding or clear enough for me to think that they should be used for purchasing options, warrants, or similar instruments.
Letters to the Editor
Q1: Questions regarding miners, as per the GDXJ:
Target levels: not clear to me; for the GDXJ you have a binding profit-take exit price: $27.32
But in https://www.sunshineprofits.com/gold-silver/gold-trading/dont-be-fooled-by-the-momentary-spurt-of-junior-miners/ you say: it's all part of a big, bearish pattern with a downside target slightly below $24. Please clarify.
A1: One of the techniques that can be used to estimate the downside target – the head and shoulders pattern – points to a target slightly below $24. There are other techniques that point to target levels that are higher. For example one of the Fibonacci retracement levels points to ~$29.5 as the downside target as that’s where it provides support.
Which of them is the most important? I’d say that the support provided by the March 31, 2020 low is the most important one. Why? Because it corresponds to the August 2007 low, which stopped the initial powerful slide that we saw about a year later, in July/August 2008 (and so far the current decline is similar to what we saw in 2008).
Most importantly, however, it’s not the GDXJ itself that might indicate the optimal moment to take profits from the current short positions. It’s likely to be the gold market, because the technical situation there is clearer. It has very strong support at / close to its 2021 lows, and based on the analogy to 2012-2013 it’s likely to bottom close to those lows.
Interestingly, based on how GDXJ recently reacted to gold’s decline, it seems that both targets – GDXJ at about $27 and gold at about $1,700 might be reached at approximately the same time.
Finally, please note that I might choose to close the current positions even if the above targets are not reached, but if I see some other kind of bullish indication, for example gold refusing to react to USD’s rallies (or gold would decline just a little despite a move higher in the USDX) and miners that are strong despite gold’s declines.
Q2Medium-term frames are not clear to me. Gold futures downside profit-take exit price: $1,706 but in the gold chart in https://www.sunshineprofits.com/gold-silver/gold-trading/dont-be-fooled-by-the-momentary-spurt-of-junior-miners/ You will find my general overview of the outlook for gold on the chart below; you show this 1350-1500 area that is also variously mentioned on other occasions. Please clarify.
Is it that one is a medium-target and the other is for a somewhat longer timeframe? If so, how much longer? In your binding exit profit-take price levels, you don't elaborate on the existence of different time frames.
A2: Yes, I don’t elaborate on other time-frames or other future trades in the “trading” part of the Summary section, as I think that this section is already quite long and complex due to several instruments being mentioned, and complicating it further might make it more difficult for many subscribers to use it, rather than make it more useful.
The “trading” section is supposed to clarify details regarding the current trade, and that’s what it does. It’s not supposed to explain the entire outlook – that’s what the main part of the analysis is about, and while it doesn’t always include the complete overview of everything, there are also two other sections that help to keep the overall outlook clear. One is – obviously – the Summary section, and the other is the one called “Overview of the Upcoming Part of the Decline.”
In the latter section, you can read that I think that there will be an initial decline (probably to ~$1,700 or slightly lower in gold), then probably some kind of breather, and then the rest of the decline would be likely to continue. You can also see it in the graphical format on the chart that’s below this section. I generally update this chart every week in the flagship analysis (usually posted on Fridays), but I also updated it today.
The rectangles that you can see on the chart are the targets in terms of both price and time, so that’s where you can see the current estimations regarding them, and that’s where you’ll see updates.
Q3: What would possibly be the final target for GDXJ ? In the GDXJ-chart in https://www.sunshineprofits.com/gold-silver/gold-trading/dont-be-fooled-by-the-momentary-spurt-of-junior-miners/ , there is another dotted green box below the medium price target, that seems to represent a final target: can you be specific about a final target for GDXJ... and a respective time frame?
A3: The time frame is visible on the chart in the “Overview of the Upcoming Part of the Decline” section – it’s between August (next month) and January 2023. Yes, I know this area is broad, but too much depends on many factors for me to put a more specific time-frame. I’d say that as the decline is becoming more similar to 2008 than to other declines, the odds increase that the final bottom will take place sooner rather than later – I wouldn’t be surprised to see it in August or September.
As far as the final price target for the GDXJ is concerned, I wouldn’t be surprised to see the GDXJ slightly below its 2016 bottom – at or a bit below $15 before this is all over.
Yes, I realize this might sound extreme, but if the 2008 slide is indeed being repeated, then expecting extremes is simply justified.
Q4: In the GDXJ chart in Tuesday’s article from JULY 5, 2022, you show the 2020 analogue, but the decline in 2020 went to GDXJ 20, for the analogue of today, however, you give target GDXJ of some 24. Sure, history doesn't repeat but rhymes, but maybe it could be addressed why the difference in view.
A4: An analogy doesn’t necessarily mean that something will be repeated, and even if it is to be repeated, it doesn’t have to be repeated with regard to exact price levels that are reached. It could be the case that the price moves are identical or similar in percentage terms. Or it could be the shape of the move that is very similar. The last two are how I usually think about analogies.
Please note that the 2020 analogy is not the only one that’s currently in play. The 2008 and 2013 analogies are here too. The more similarities between them we find, the easier it will be to estimate what’s likely to happen this time. The above would provide us with a general roadmap, and then we could apply the current support / resistance levels and see what targets correspond to all the above the most. In fact, that’s what I’m doing in my analyses on a daily basis.
Summary
Summing up, it seems to me that the short-term rally in the precious metals market is over, and the decline will now continue. And the tiny correction’s days are likely numbered, too.
I previously wrote that the profits from the previous long position (congratulations once again) were likely to further enhance the profits on this huge decline, and that’s exactly what happened. The profit potential with regard to the upcoming gargantuan decline remains huge.
As investors are starting to wake up to reality, the precious metals sector (particularly junior mining stocks) is declining sharply. Here are the key aspects of the reality that market participants have ignored:
- rising real interest rates,
- rising USD Index values.
Both of the aforementioned are the two most important fundamental drivers of the gold price. Since neither the USD Index nor real interest rates are likely to stop rising anytime soon (especially now that inflation has become highly political), the gold price is likely to fall sooner or later. Given the analogy to 2012 in gold, silver, and mining stocks, “sooner” is the more likely outcome.
After the final sell-off (that takes gold to about $1,350-$1,500), I expect the precious metals to rally significantly. The final part of the decline might take as little as 1-5 weeks, so it's important to stay alert to any changes.
As always, we'll keep you – our subscribers – informed.
To summarize:
Trading capital (supplementary part of the portfolio; our opinion): Full speculative short positions (300% of the full position) in junior mining stocks are justified from the risk to reward point of view with the following binding exit profit-take price levels:
Mining stocks (price levels for the GDXJ ETF): binding profit-take exit price: $27.32; stop-loss: $38.33
Alternatively, if one seeks leverage, we’re providing the binding profit-take levels for the JDST (2x leveraged). The binding profit-take level for the JDST: $18.35; stop-loss for the JDST: $10.28
For-your-information targets (our opinion; we continue to think that mining stocks are the preferred way of taking advantage of the upcoming price move, but if for whatever reason one wants / has to use silver or gold for this trade, we are providing the details anyway.):
Silver futures downside profit-take exit price: $17.22; stop-loss: $23.22
SLV profit-take exit price: $16.22; stop-loss: $21.22
ZSL profit-take exit price: $41.47; stop-loss: $25.44
Gold futures downside profit-take exit price: $1,706; stop-loss: $1,911
HGD.TO – alternative (Canadian) 2x inverse leveraged gold stocks ETF – the upside profit-take exit price: $11.87; stop-loss: $7.17
HZD.TO – alternative (Canadian) 2x inverse leveraged silver ETF – the upside profit-take exit price: $31.87; stop-loss: $19.88
Long-term capital (core part of the portfolio; our opinion): No positions (in other words: cash)
Insurance capital (core part of the portfolio; our opinion): Full position
Whether you’ve already subscribed or not, we encourage you to find out how to make the most of our alerts and read our replies to the most common alert-and-gold-trading-related-questions.
Please note that we describe the situation for the day that the alert is posted in the trading section. In other words, if we are writing about a speculative position, it means that it is up-to-date on the day it was posted. We are also featuring the initial target prices to decide whether keeping a position on a given day is in tune with your approach (some moves are too small for medium-term traders, and some might appear too big for day-traders).
Additionally, you might want to read why our stop-loss orders are usually relatively far from the current price.
Please note that a full position doesn't mean using all of the capital for a given trade. You will find details on our thoughts on gold portfolio structuring in the Key Insights section on our website.
As a reminder - "initial target price" means exactly that - an "initial" one. It's not a price level at which we suggest closing positions. If this becomes the case (as it did in the previous trade), we will refer to these levels as levels of exit orders (exactly as we've done previously). Stop-loss levels, however, are naturally not "initial", but something that, in our opinion, might be entered as an order.
Since it is impossible to synchronize target prices and stop-loss levels for all the ETFs and ETNs with the main markets that we provide these levels for (gold, silver and mining stocks - the GDX ETF), the stop-loss levels and target prices for other ETNs and ETF (among other: UGL, GLL, AGQ, ZSL, NUGT, DUST, JNUG, JDST) are provided as supplementary, and not as "final". This means that if a stop-loss or a target level is reached for any of the "additional instruments" (GLL for instance), but not for the "main instrument" (gold in this case), we will view positions in both gold and GLL as still open and the stop-loss for GLL would have to be moved lower. On the other hand, if gold moves to a stop-loss level but GLL doesn't, then we will view both positions (in gold and GLL) as closed. In other words, since it's not possible to be 100% certain that each related instrument moves to a given level when the underlying instrument does, we can't provide levels that would be binding. The levels that we do provide are our best estimate of the levels that will correspond to the levels in the underlying assets, but it will be the underlying assets that one will need to focus on regarding the signs pointing to closing a given position or keeping it open. We might adjust the levels in the "additional instruments" without adjusting the levels in the "main instruments", which will simply mean that we have improved our estimation of these levels, not that we changed our outlook on the markets. We are already working on a tool that would update these levels daily for the most popular ETFs, ETNs and individual mining stocks.
Our preferred ways to invest in and to trade gold along with the reasoning can be found in the how to buy gold section. Furthermore, our preferred ETFs and ETNs can be found in our Gold & Silver ETF Ranking.
As a reminder, Gold & Silver Trading Alerts are posted before or on each trading day (we usually post them before the opening bell, but we don't promise doing that each day). If there's anything urgent, we will send you an additional small alert before posting the main one.
Thank you.
Przemyslaw Radomski, CFA
Founder, Editor-in-chief

