

Briefly: in our opinion, full (300% of the regular position size) speculative short positions in junior mining stocks are justified from the risk/reward point of view at the moment of publishing this Alert.
Gold is performing just as in 2013, and it has extremely important implications for the following weeks.
Since I keep reading about how supposedly bullish the current corrective upswing is, I decided to dedicate today’s analysis to showing you just how perfectly normal it is for this correction to be taking place – in tune with what happened in 2013, not against it.
In other words, what we see now is not a bullish game-changer, but rather a very normal repeat of what we already saw almost a decade ago.
History rhymes as people tend to react similarly to similar price developments. The underlying reasons for price moves change, but the forces that really drive the buy and sell decisions remain the same. These forces are fear and greed. Thanks to this, even though the economic, financial, and geopolitical situations are different now than in 2013, the price moves continue to be very, very similar.
The exception is that back in 2013, there was no major military invasion in Europe, and we have one right now. This means that gold – being a safe-haven asset – was practically forced to rally. As gold rallied higher than it did in late 2012, it then declined in a more volatile manner. Since the decline was sharper this year than it was in 2012 and 2013, the correction that we see now is also more volatile. That’s perfectly normal. If you drop a ball from a higher level, it will also bounce higher before falling again, right? However, it will fall, nonetheless.
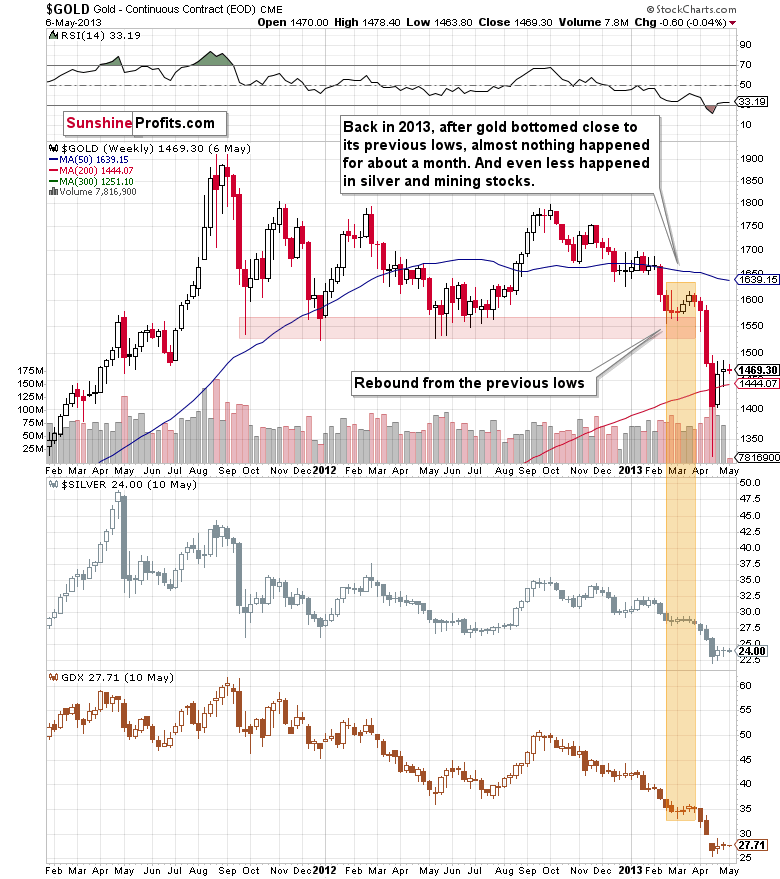
Let’s see what happened in 2013.
Now, let’s see what happened recently.
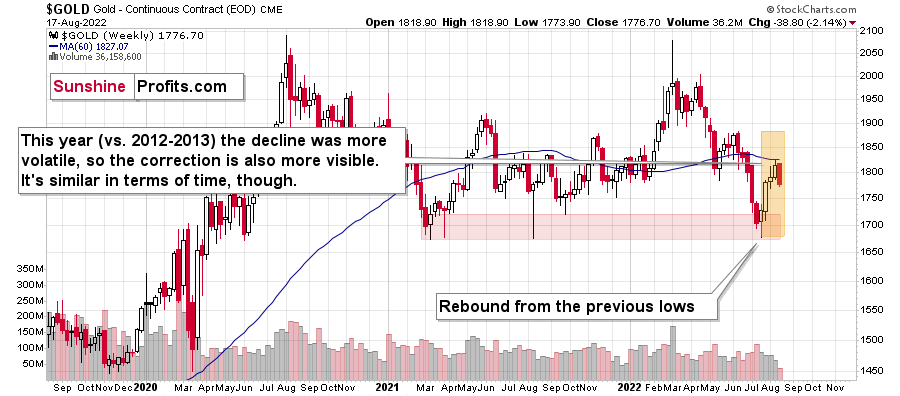
No, it’s not the same chart :). The first one shows gold’s performance between 2011 and mid-2013, and the second shows gold’s performance between late-2019 and today.
The price pattern in gold is so similar, because… history rhymes! Gold got too high too fast in 2011 and the same thing happened in 2020. In fact, if it weren’t for the huge amounts of money that were created due to the pandemic-related stimulus programs, gold would have likely declined instead of rallying. The proof here lies in the fact that, well, it invalidated the breakout above the 2011 high despite the above and despite the Russian invasion.
Think about it: if someone told you a few years ago that there would be a pandemic, global lockdowns, huge amounts of money being printed, double-digit inflation in many parts of the world, and a Russian invasion of Ukraine, would you believe that gold would fail to rally and stay above its 2011 highs?
Very few people would have likely believed that – and yet, that’s exactly what happened, and what’s still happening.
Yes, gold “wants” to decline before soaring (and yes, I do think that it will soar, but it’s simply unlikely before sliding first, similarly to what we saw in 2008), and since that’s the case, it has to decline in some sort of price pattern. What’s the most likely way for gold to decline? Since history tends to rhyme, the previous big declines provide guidance. In particular, the 2013 decline has been repeated to a very considerable (quite extreme, actually) extent.
What does this specific self-similarity tell us right now?
It’s telling us… Hmm, no.
It’s screaming right into our ears: watch out!
If the pattern simply keeps repeating itself (which has been taking place for months!), then the huge slide is just ahead. The current correction and back-and-forth trading is likely just the calm before the storm.
Of course, the above is just my opinion, and I can’t promise any kind of performance of any market, including gold, but please note that the previous months’ weakness in gold and silver mining stocks vs. gold are also just like what we saw in 2013 before the huge slide…
I don’t even want to get into the “tiny” fact that while gold moved briefly above its 2011 highs in 2020, neither silver nor gold mining stocks were even close to something similar. Instead, they corrected about a half of their huge decline, and then they started another move lower – a move that continues to this day.
The markets are screaming an important message. However, it’s your choice if you decide to listen to them.
On a short-term note, we saw a big daily move lower in the GDXJ ETF, which means that the profits on our short positions have increased. After all, it was a fresh monthly low.
I previously commented on the above chart in the following way:
Junior miners are after a breakdown below their rising black support line, and the move above the early-August high was clearly invalidated. This means that we saw two small sell signals.
Once the GDXJ declines below the rising, green support line, it will be a good indication that the next big move lower is already underway. Right now, it’s quite possible, but not very likely. In other words, if we see more back-and-forth movement this week, it would still be normal in light of the analogy to 2013 and it would not be something bullish.
Indeed, the junior miners’ ETF moved slightly lower, but overall it stayed between the two support lines. Once we see a breakdown below the green line, we’ll likely “know” (there are no certainties in any market) that the next big move lower has just started.
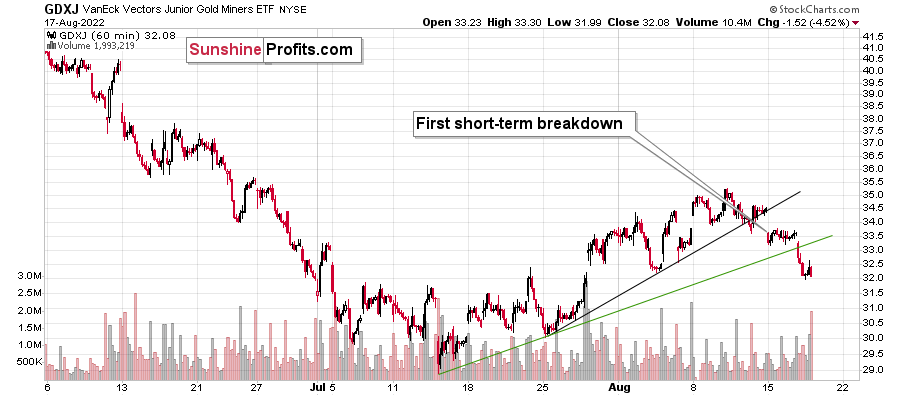
Well, we saw the breakdown below the rising green line, then a small move back up, and then another decline, right before hearing the sound of yesterday’s closing bell.
This is also a breakdown below the previous August lows. While these breakdowns are not yet verified, the short-term outlook has just further deteriorated. It’s now even more likely that the next big move lower is already underway.
Oh, and please don’t let the size of the above move fool you – it’s just a 1-hour candlestick chart, and it makes the tiny move appear quite big. Here’s a more proper perspective:
As you can see, the move lower is tiny so far, and the GDXJ has much further to go.
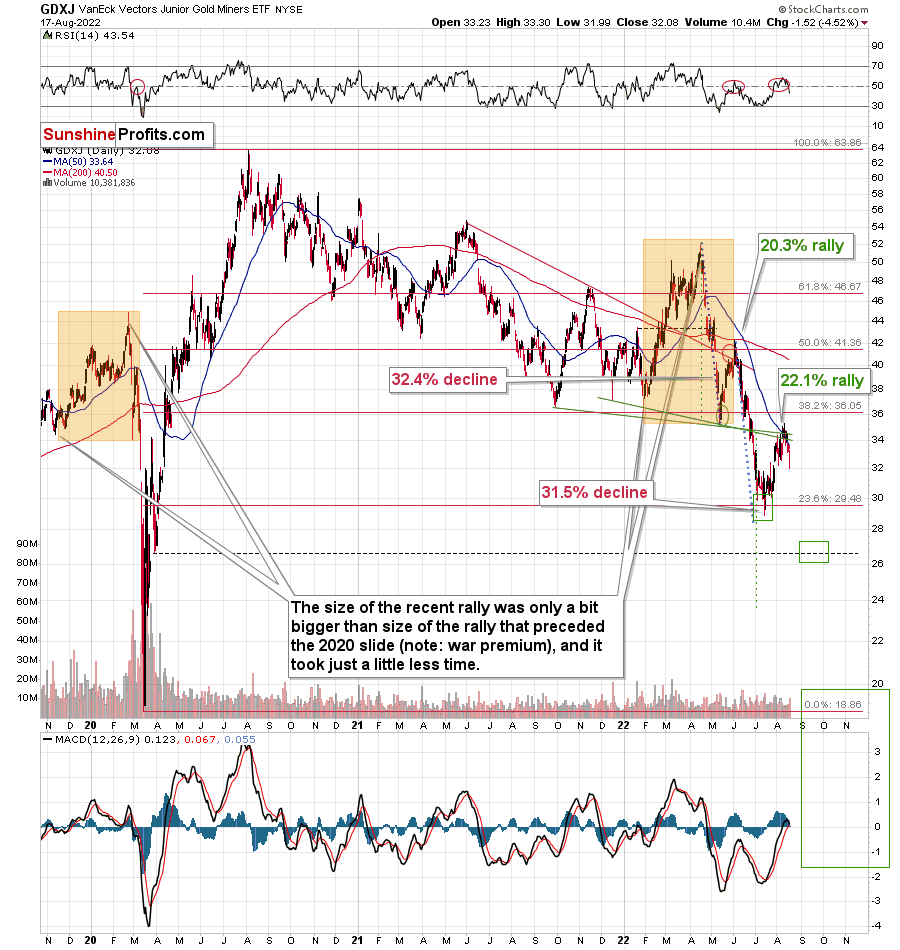
It could be the case (no guarantees here) that when gold moves to its recent (2022) lows, then the GDXJ will already be in its target area slightly above $26. I will probably not adjust the trade based on that, as the rebound from there could be really tiny and particularly tricky (there was an analogous move in 2013 as well), but I don’t want to say that with certainty right now.
The really strong support – and a likely target – is now at the 2020 low, slightly below $20. No, it’s not unrealistic – it simply assumes that the decline that we already saw this year will be repeated.
Let’s keep in mind that, based on the analogy to 2013, the biggest part of the decline is likely just ahead, so the decline is likely to be even more volatile than what we saw so far this year.
Yes, I can’t make any promises, but in my opinion, this likely implies enormous profits on the horizon.
Having said that, let’s take a look at the markets from a more fundamental angle.
Troubling Behavior
While the S&P 500 and the NASDAQ Composite closed in the red on Aug. 17, the GDXJ ETF’s decline was substantially larger. Moreover, with gold and silver also feeling the heat, the PMs’ underperformances during the recent risk rally are profoundly bearish.
Likewise, while I noted how Fed Chairman Jerome Powell’s dovish press conference on Jul. 27 helped fuel the risk-on sentiment, the PMs’ struggles highlight the bearish technical backdrop confronting the metals.
Please see below:
 Source: Goldman Sachs
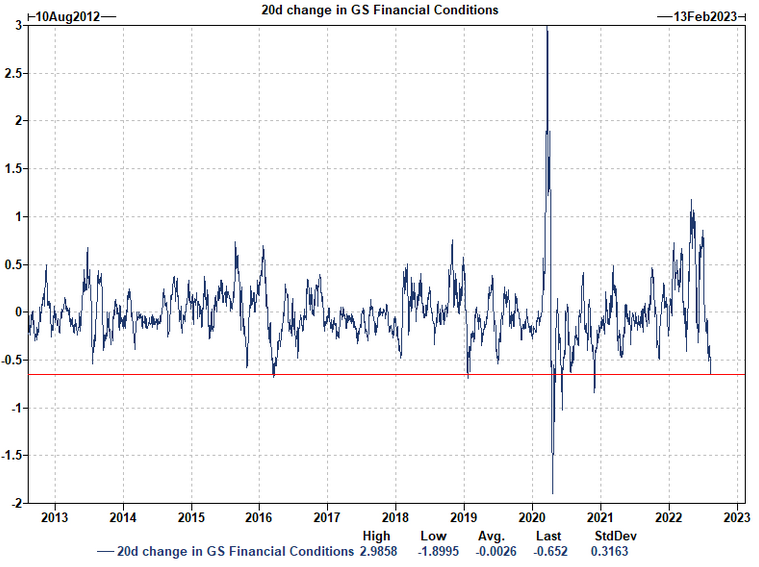
To explain, the blue line above tracks the 20-day change in the Goldman Sachs Financial Conditions Index (FCI). When the blue line rises, financial conditions tighten, and when the blue line falls, financial conditions loosen.
If you analyze the right side of the chart, you can see that post-Powell, the FCI suffered one of its sharpest 20-day declines in ~10 years. Therefore, Powell essentially green-lighted the risk rally, even though easing financial conditions only spurs more inflation.
Furthermore, the developments were profoundly bullish from a fundamental perspective. Yet, with the GDXJ ETF ending the Aug. 17 session only seven cents above the Jul. 27 close, the junior miners haven’t reaped much of the rewards. As a result, the relative weakness highlights the troubling technicals that I’ve been warning about.
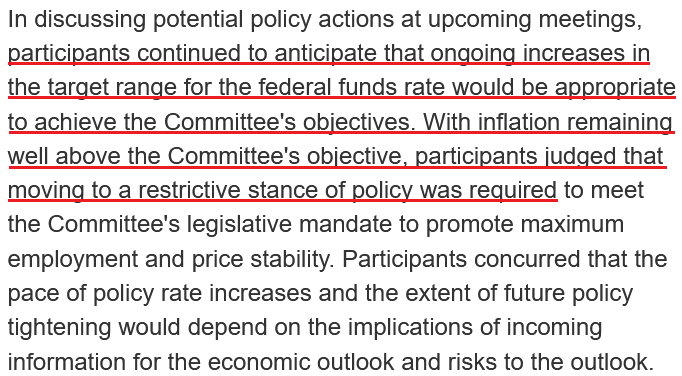
Likewise, the Fed released the minutes from its Jul. 26-27 monetary policy meeting on Aug. 17. Moreover, with the report more dovish than hawkish, Fed officials still underestimate the task at hand. An excerpt read:
“Market participants perceived falling commodity prices – particularly for oil – and the FOMC's commitment to bringing inflation down as pointing to lower inflation ahead. Market-based measures of near-dated inflation compensation declined and continued to suggest that inflation would ease in coming quarters. In the Desk surveys, respondents also expected inflation to decline substantially in 2023 but assigned meaningful probabilities to a wide range of potential outcomes, including scenarios involving continued elevated rates of inflation.”
In addition:
“Participants judged that, as the stance of monetary policy tightened further, it would likely become appropriate at some point to slow the pace of policy rate increases while assessing the effects of cumulative policy adjustments on economic activity and inflation.”
Thus, with the minutes another example of the Fed talking out of both sides of its mouth (hawkish on one side, dovish on the other), the results largely align with what Powell said on Jul. 27.
Please see below:
 Source: U.S. Fed
Therefore, Fed officials are attempting to solve two problems at once: they want to keep spirits uplifted and support economic growth (dovish comments), while at the same time eliminating inflation and maintaining rate hikes (hawkish comments). However, their lack of urgency to deal with the inflation problem should haunt them when it’s all said and done.
Remember, their willingness to “slow the pace of policy rate increases” is profoundly bullish for the PMs; and if the Fed wants to play chicken with inflation and risk another uprising, the PMs should have rallied on the news. However, with gold, silver and mining stocks heading in the opposite direction, the bearish technicals have gained the upper hand.
All in all, if the PMs can’t sustain rallies when financial conditions loosen and the Fed (to its detriment) is effectively encouraging investors to ignore inflation, then it’s likely a red flag that signals more downside ahead.
The Fight of a Lifetime
With the Fed essentially dismissing inflation and assuming the metric will “decline substantially in 2023,” it’s confusing a lion for a lamb. However, with another reality check heard loud and clear in Britain on Aug. 17, officials don’t realize that inflation is much more ferocious than it appears.
Please see below:
 Source: Investing.com
To explain, U.K. inflation hit double digits year-over-year (YoY), with the metric outperforming the 9.8% YoY consensus estimate. As a result, while global inflation rates hit levels unseen since the 1970s and 1980s, investors are still steadfast that central banks will pivot. Even more troubling, they genuinely believe that pivots alongside 8%+ inflation will result in positive medium-term outcomes. However, I warned on Aug. 9 that investors should be careful about what they wish for. I wrote:
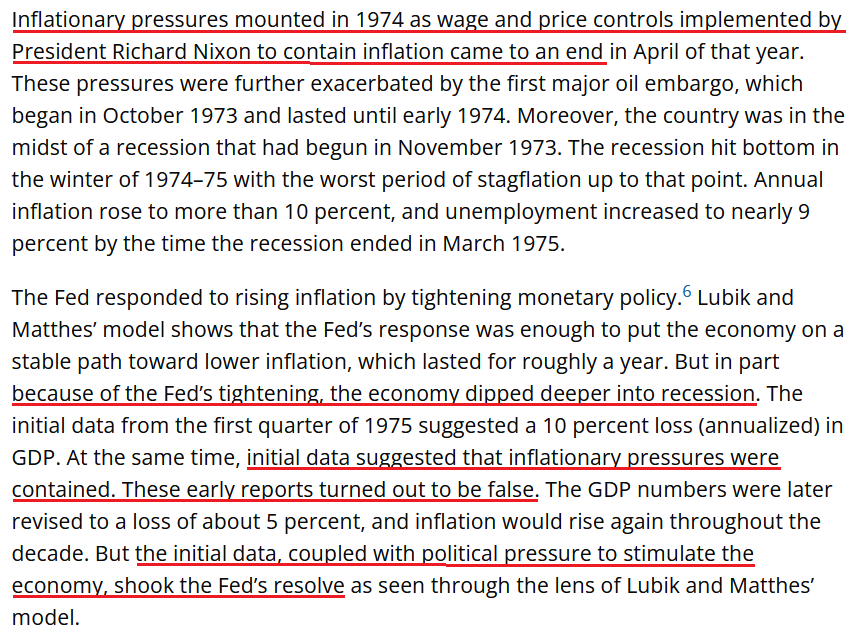
When the Richmond Fed did a post-mortem on the [1973/1974] monetary mistake, the findings mirrored the false narratives that are prevalent today. An excerpt read:
“Volcker still deserves credit for resisting political pressure to ease during the 1981–82 recession, which might have led to a continuation of the stop-go approach the Fed was seen as pursuing under Burns. What distinguishes Volcker from Burns in the minds of many is the fact that he followed through after initial disinflationary policy moves, a consistent approach that helped build and maintain the Fed’s credibility for keeping inflation in check.”
For context, a “stop-go approach” means the Fed cuts interest rates and then has to raise them once again. However, the mistakes of the past highlight how the Fed’s inflation gambit ends the same either way.
Please see below:
 Source: Richmond Fed
Thus, while Fed officials maintain that higher interest rates are on the horizon, their hints at slowdowns, pauses, or even rate cuts highlight how unaware they are of the challenges that lie ahead. However, with fundamental gravity poised to bring officials and investors back down to earth, the consensus should learn the hard way that “peak inflation” is only the beginning of the epic battle.
For example, Ford – one of the Big Three U.S. automakers – announced on Aug. 9 that its electric F-150 Lightning pickup truck prices will increase by roughly 5.4% to 17.5% in 2023 due to “significant material cost increases and other factors.”
Please see below:
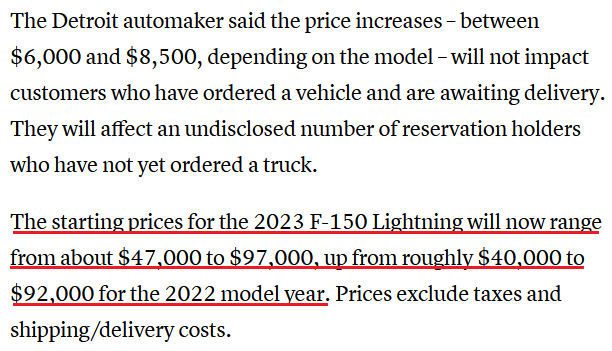 Source: CNBC
Likewise, Walt Disney announced on Aug. 10 that the price for Disney+ will rise substantially in the months ahead. CEO Bob Chapek said during the Q3 earnings call:
“We believe because the increase in the investment over the past two and a half years relative to a very good price point that we have plenty of room on price value. And we do not believe that there's going to be any meaningful long-term impact on our churn as a result. I mean, one only needs to look at our recent significant increase on ESPN+, which had the exact same impact of really no meaningful impact at all on our churn. And we believe that we've got plenty of price value room left to go.”
Please see below:
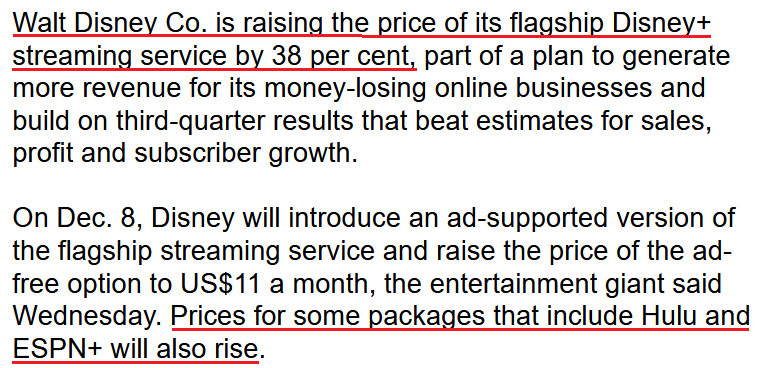 Source: Bloomberg
Furthermore, while the Fed attempts to achieve a milestone that no other committee has in ~70 years (reduce unanchored inflation to 2% without causing a sharp recession), officials materially underestimate the challenge.
For example, the NFIB released its Small Business Optimism Index on Aug. 9. The report revealed:
“NFIB’s Small Business Optimism Index rose 0.4 points in July to 89.9, however, it is the sixth consecutive month below the 48-year average of 98. Thirty-seven percent of small business owners reported that inflation was their single most important problem in operating their business, an increase of three points from June and the highest level since the fourth quarter of 1979.”
Moreover, with small businesses accounting for ~40% of U.S. GDP and employment, the Fed’s miscalculations should have drastic consequences over the next six to 12 months.
Please see below:
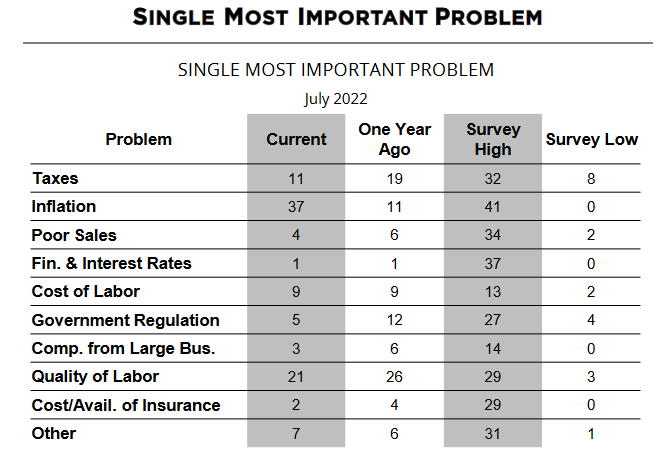 Source: NFIB
To explain, the table above shows how inflation and the cost of labor remain near their survey highs as small businesses’ “Single Most Important Problem.” For example, the former has increased from 11 to 37 YoY and is only four points off the all-time high of 41. Likewise, the latter is flat YoY at 9, but is also four points off its all-time high of 13.
In stark contrast, poor sales as small businesses’ main concern declined from 6 to 4 YoY and is only 2 points off its all-time low of 2. Moreover, if demand was so dire, wouldn’t the poor sales response be closer to the all-time high of 34?
Thus, the Fed doesn’t realize that inflation is the primary problem, and the longer it lingers, the more damage it inflicts. As a result, don’t be surprised if the Fed’s forecasting error results in another 1970s-style calamity.
The Bottom Line
While history highlights the destruction that unfolds when the Fed underestimates inflation, officials seem eager to test the failing theory once again. Moreover, while a slower pace of rate hikes is better than no rate hikes at all, they still underestimate the difficulty of achieving their objective.
However, while their patience should be bullish for the PMs, the metals’ suffering can be attributed to the bearish technical developments that I’ve been warning about for months. As such, when the Fed finally realizes the magnitude of its inflation fight, other asset classes should suffer mightily as well.
In conclusion, the PMs declined on Aug. 17, and the GDXJ ETF was a noticeable underperformer. Moreover, with the USD Index rallying slightly and the U.S. 10-Year real yield increasing, the S&P 500 should be next in line for a material drawdown. Therefore, the medium-term outlook remains profoundly bearish.
Overview of the Upcoming Part of the Decline
- It seems to me that the corrective upswing is either over or about to be over, and that the next big move lower is about to start.
- If we see a situation where miners slide in a meaningful and volatile way while silver doesn’t (it just declines moderately), I plan to – once again – switch from short positions in miners to short positions in silver. At this time, it’s too early to say at what price levels this could take place and if we get this kind of opportunity at all – perhaps with gold prices close to $1,600.
- I plan to exit all remaining short positions once gold shows substantial strength relative to the USD Index while the latter is still rallying. This may be the case with gold prices close to $1,400. I expect silver to fall the hardest in the final part of the move. This moment (when gold performs very strongly against the rallying USD and miners are strong relative to gold after its substantial decline) is likely to be the best entry point for long-term investments, in my view. This can also happen with gold close to $1,400, but at the moment it’s too early to say with certainty.
- The above is based on the information available today, and it might change in the following days/weeks.
You will find my general overview of the outlook for gold on the chart below:
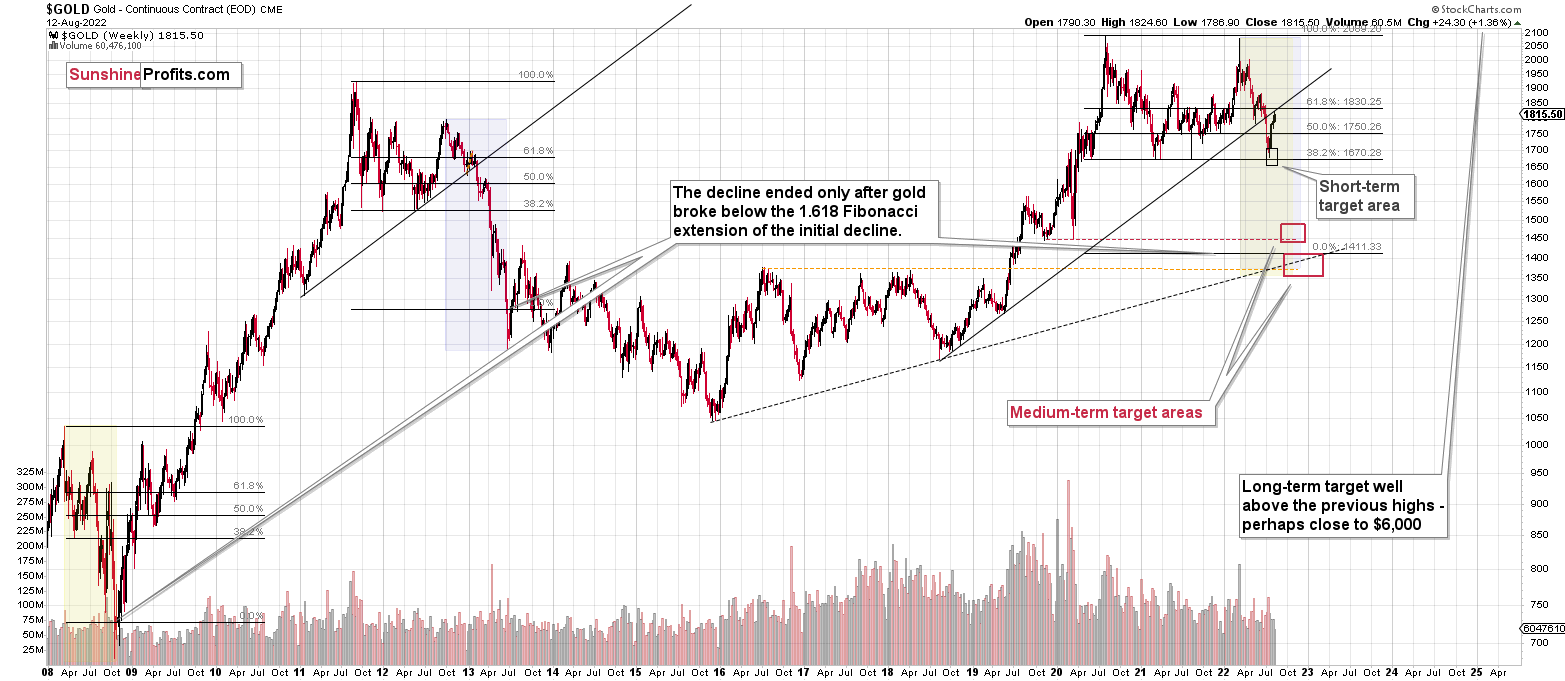
Please note that the above timing details are relatively broad and “for general overview only” – so that you know more or less what I think and how volatile I think the moves are likely to be – on an approximate basis. These time targets are not binding nor clear enough for me to think that they should be used for purchasing options, warrants, or similar instruments.
Letters to the Editor
Q: A question for PR. In viewing your sloping line, are you indicating an SP 500 slide to 3000 or 3100?
If gold slides to 1200 or 1300, wouldn't it be a good time to buy gold futures contracts on a futures exchange, or better yet, play ETFs? Today was a decent day. All my temporary losses were recovered, and I made a small paper profit, so let the slide begin. I am well positioned, I think! Also, with midterms around the corner, do you think they may try to prop the market up and delay the slide?
A: Yes, I think that the S&P 500 will decline to 3,000-3,250 and we might see a rebound from there – this bottom might (!) correspond to the final bottom in the precious metals sector, but it’s too early to tell. Then, after a correction, I expect stocks to decline even more (probably while the PMs and miners are already moving up again).
I can’t tell you what instrument you should use for a trade – that would be investment advice. Some time ago, I prepared this table with a comparison of different methods of buying gold, and it remains up-to-date – you might find it useful. In general, futures might be useful for advanced traders, while ETFs might be more useful for beginning traders. Long-term investors might want to focus on building their physical holdings and consider trading only after the above is completed. However, I can’t tell anyone (specifically) what they should do – I can only provide my general opinions.
It could be the case that they try to move the stock market higher before the elections, but inflation is the key thing that most voters are concerned about, so that will be the main focus, in my opinion.
So, it could be the case that inflation is fought the entire time, or there’s an attempt to quench it while allowing stocks – and commodities/gold – to fall initially, and then it would be beneficial (from the political point of view) to try to revive the stock market closer to the elections, with the “the worst is over, good times ahead” narrative.
Either way, I think that the precious metals sector is likely to decline in the coming weeks and months. However, I do think that we’ll see the major – final – bottom sometime this year.
Summary
Summing up, it seems that the corrective upswing is over (or close to being over), which means that the powerful medium-term downtrend can now resume.
Two weeks ago, we closed yet another profitable trade in a row. This year’s profits are already enormous, but it seems likely to me that they will grow even more in the following weeks and months. In particular, I expect the profits on the current short positions to be really profound.
After the final sell-off (that takes gold to about $1,350-$1,500), I expect the precious metals to rally significantly. The final part of the decline might take as little as 1-5 weeks, so it's important to stay alert to any changes.
As always, we'll keep you – our subscribers – informed.
To summarize:
Trading capital (supplementary part of the portfolio; our opinion): Full speculative short positions (300% of the full position) in junior mining stocks are justified from the risk to reward point of view with the following binding exit profit-take price levels:
Mining stocks (price levels for the GDXJ ETF): binding profit-take exit price: $20.32; stop-loss: none (the volatility is too big to justify a stop-loss order in case of this particular trade)
Alternatively, if one seeks leverage, we’re providing the binding profit-take levels for the JDST (2x leveraged). The binding profit-take level for the JDST: $29.87; stop-loss for the JDST: none (the volatility is too big to justify a SL order in case of this particular trade).
For-your-information targets (our opinion; we continue to think that mining stocks are the preferred way of taking advantage of the upcoming price move, but if for whatever reason one wants / has to use silver or gold for this trade, we are providing the details anyway.):
Silver futures downside profit-take exit price: $12.32
SLV profit-take exit price: $11.32
ZSL profit-take exit price: $79.87
Gold futures downside profit-take exit price: $1,504
HGD.TO – alternative (Canadian) 2x inverse leveraged gold stocks ETF – the upside profit-take exit price: $19.87
HZD.TO – alternative (Canadian) 2x inverse leveraged silver ETF – the upside profit-take exit price: $49.87
Long-term capital (core part of the portfolio; our opinion): No positions (in other words: cash)
Insurance capital (core part of the portfolio; our opinion): Full position
Whether you’ve already subscribed or not, we encourage you to find out how to make the most of our alerts and read our replies to the most common alert-and-gold-trading-related-questions.
Please note that we describe the situation for the day that the alert is posted in the trading section. In other words, if we are writing about a speculative position, it means that it is up-to-date on the day it was posted. We are also featuring the initial target prices to decide whether keeping a position on a given day is in tune with your approach (some moves are too small for medium-term traders, and some might appear too big for day-traders).
Additionally, you might want to read why our stop-loss orders are usually relatively far from the current price.
Please note that a full position doesn't mean using all of the capital for a given trade. You will find details on our thoughts on gold portfolio structuring in the Key Insights section on our website.
As a reminder - "initial target price" means exactly that - an "initial" one. It's not a price level at which we suggest closing positions. If this becomes the case (as it did in the previous trade), we will refer to these levels as levels of exit orders (exactly as we've done previously). Stop-loss levels, however, are naturally not "initial", but something that, in our opinion, might be entered as an order.
Since it is impossible to synchronize target prices and stop-loss levels for all the ETFs and ETNs with the main markets that we provide these levels for (gold, silver and mining stocks - the GDX ETF), the stop-loss levels and target prices for other ETNs and ETF (among other: UGL, GLL, AGQ, ZSL, NUGT, DUST, JNUG, JDST) are provided as supplementary, and not as "final". This means that if a stop-loss or a target level is reached for any of the "additional instruments" (GLL for instance), but not for the "main instrument" (gold in this case), we will view positions in both gold and GLL as still open and the stop-loss for GLL would have to be moved lower. On the other hand, if gold moves to a stop-loss level but GLL doesn't, then we will view both positions (in gold and GLL) as closed. In other words, since it's not possible to be 100% certain that each related instrument moves to a given level when the underlying instrument does, we can't provide levels that would be binding. The levels that we do provide are our best estimate of the levels that will correspond to the levels in the underlying assets, but it will be the underlying assets that one will need to focus on regarding the signs pointing to closing a given position or keeping it open. We might adjust the levels in the "additional instruments" without adjusting the levels in the "main instruments", which will simply mean that we have improved our estimation of these levels, not that we changed our outlook on the markets. We are already working on a tool that would update these levels daily for the most popular ETFs, ETNs and individual mining stocks.
Our preferred ways to invest in and to trade gold along with the reasoning can be found in the how to buy gold section. Furthermore, our preferred ETFs and ETNs can be found in our Gold & Silver ETF Ranking.
As a reminder, Gold & Silver Trading Alerts are posted before or on each trading day (we usually post them before the opening bell, but we don't promise doing that each day). If there's anything urgent, we will send you an additional small alert before posting the main one.
Thank you.
Przemyslaw Radomski, CFA
Founder, Editor-in-chief

