

Briefly: in our opinion, full (300% of the regular position size) speculative short positions in junior mining stocks are justified from the risk/reward point of view at the moment of publishing this Alert.
What comes up, must come down, right?
Well, not necessarily. Once an object reaches second cosmic velocity, it escapes Earth’s gravitational pull, so wherever it goes next, it won’t go “down” in the classic sense of this word. Besides, what’s “up” and “down” in space?
Enough of fancy nerd speak for today. Let’s move on to something that just went up, and then came back down without a bigger delay – the precious metals sector.
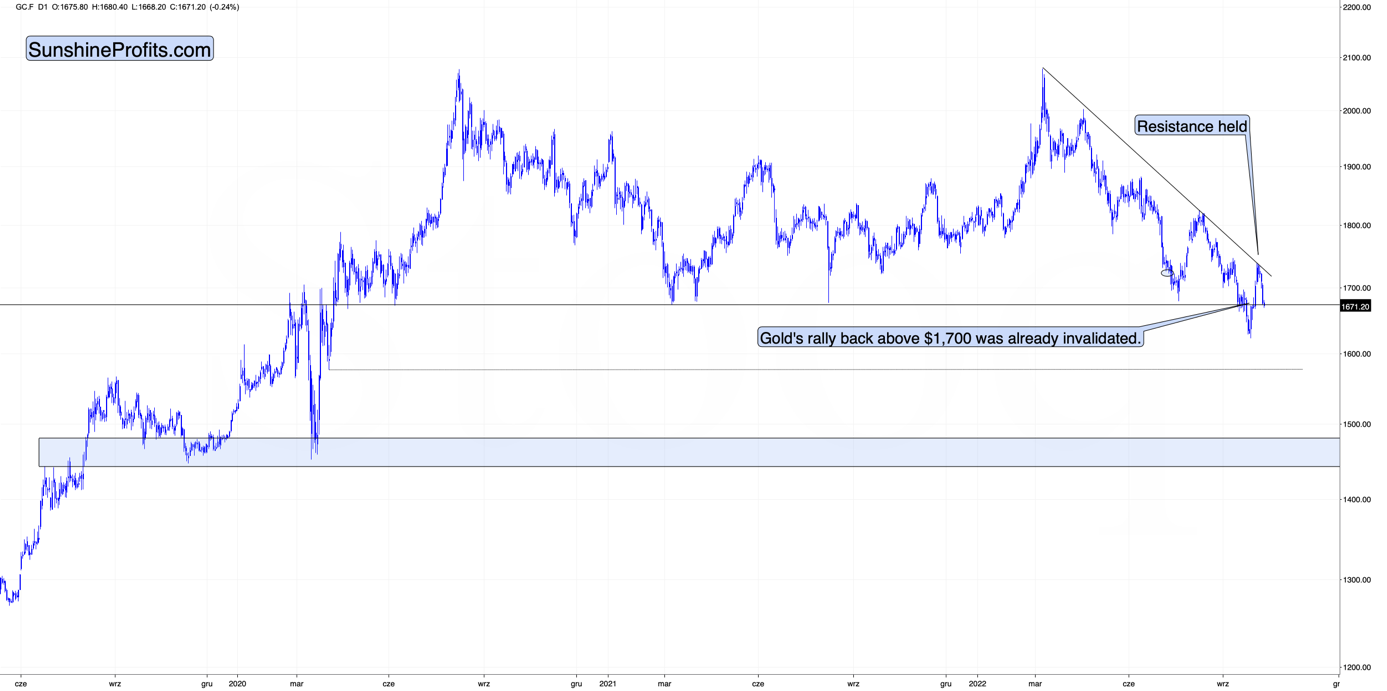
At the moment of writing these words, gold is not only back below $1,700 – it’s also back below its 2021 lows, and yes - it’s as bearish as it sounds.
In fact, it’s even more bearish since gold broke below those lows just a few weeks ago, as now it’s right after a very short-term correction, which means that it can easily decline much lower without yet another correction.
The analogy to 2013 clearly supports it, and my yesterday’s comments on gold’s very long-term chart remain very much up-to-date:
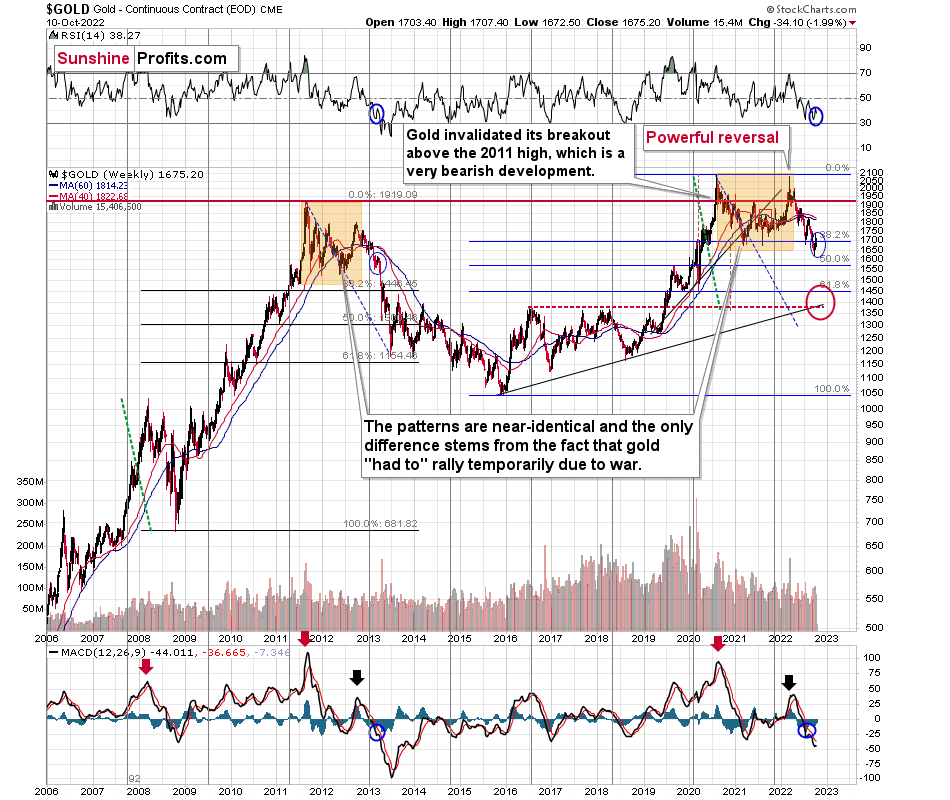
I’ve been writing about this important analogy for months, but if you haven’t read my previous analyses, please focus on the orange rectangles on the above chart – how the price behaved and what happened in the RSI and MACD indicators. The situations are near-perfectly aligned.
If you were monitoring the gold market back in April 2013, you might remember the overall feeling among gold investors and traders when gold rallied from the 2012 lows. Practically everyone and their brother were convinced that the bottom in gold is really in, and that it was about to soar to new highs.
Sort of like what we experienced recently.
However, it wasn’t the bottom. It wasn’t even the mid-point of the entire medium-term decline.
Sure, history doesn’t have to repeat itself to the letter, and the geopolitical and monetary situation now is different than it was back in 2013, but… Fear and greed work in the same way, and when people try to forecast the future by looking at previous price patterns (very few people look at the big picture; most just focus on the last year or so), they ultimately follow a similar emotional process. This leads them to repeat their past behaviors and, as a result, the price patterns continue to be similar.
Actually, the situation regarding monetary policy now supports even a more profound slide than it did back in 2013. Still, due to geopolitics, the decline could be “only” similar to what we saw back then.
There’s very strong support just a bit below $1,400, and the decline to this level (approximately) would be in tune with the size of the 2011-2013 decline.
Can gold really slide that low? Absolutely.
Will it slide there immediately? There’s a good chance we’ll have some sort of correction in the meantime, and one of them might be tradable. The rebound from the 2020 lows seems quite likely at the moment, but I’ll keep monitoring the situation and report to my subscribers accordingly. I’ll also describe which part of the precious metals sector is likely to benefit the most from this decline. At this time, it seems that junior mining stocks are likely to decline the most (as they have so far this year), but this might change as prices move lower.
Either way, the short- and medium-term outlooks for gold are bearish.
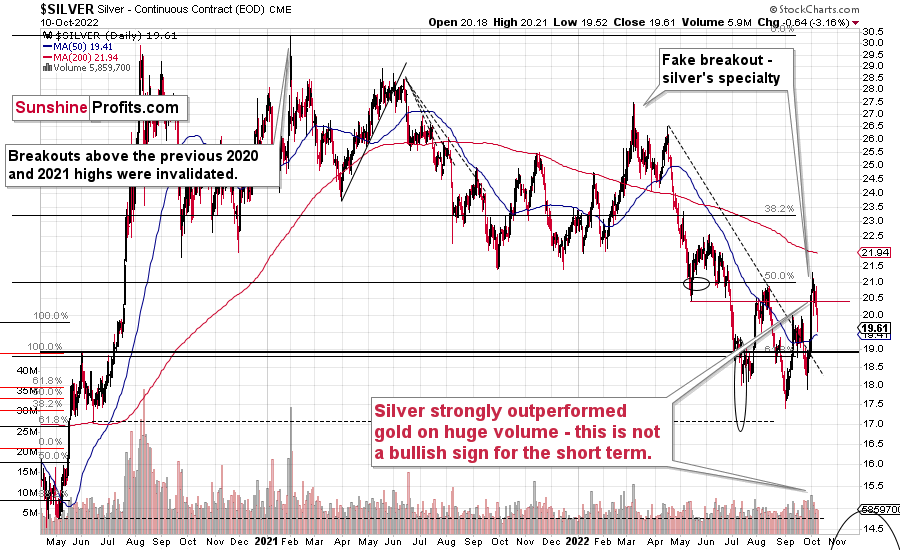
Moving to silver, we can see that it has not only invalidated its fake breakout above the August highs, but it has also invalidated a breakout above its September highs.
I warned you about silver’s “fake” nature when it comes to breakouts, and indeed it was a fake move.
What’s next? Well, what was next after silver failed its April rally? It declined from about $26 to about $18 within a few months.
Can we see a similar crash in the near term?
Yes!
The link to 2013 remains intact, and silver prices declined significantly at that time.
What about mining stocks?
In short, they are likely to decline significantly too.
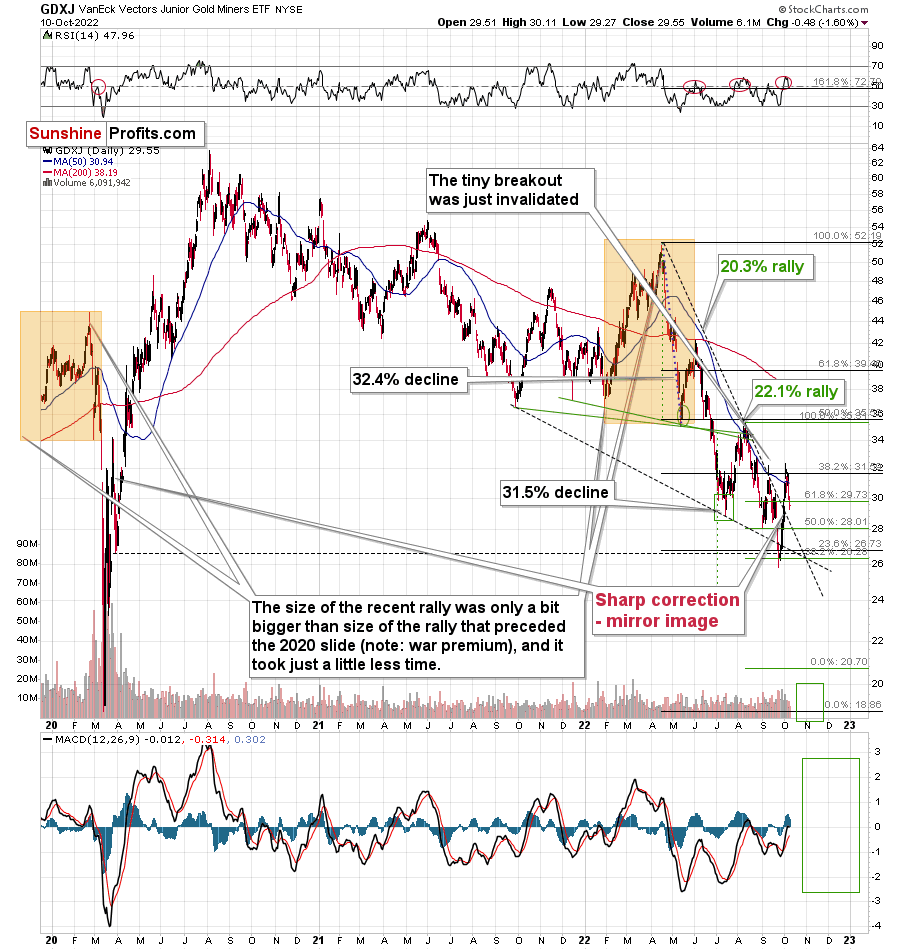
I previously (in the premium version of the Oct. 5 analysis) commented on the above chart in the following way:
The GDXJ rallied sharply once again yesterday, and it reversed close to its September high. That happened slightly above the 50-day moving average. Both previous attempts to break above this moving average failed, and that’s when declines to new lows started. The same is likely right now.
Indeed, the declines started, and the move above GDXJ’s 50-day moving average was invalidated. It looks like we’re about to see another big move lower.
Let’s keep in mind that, based on the link to 2013, the next big move lower could be really big. In fact, a move to 2020 is definitely in the cards.
Why haven’t miners declined more so far? It’s probably due to the stock market’s performance – people probably still don’t believe that stocks are going to slide, but it seems that they are going to get convinced any day now.
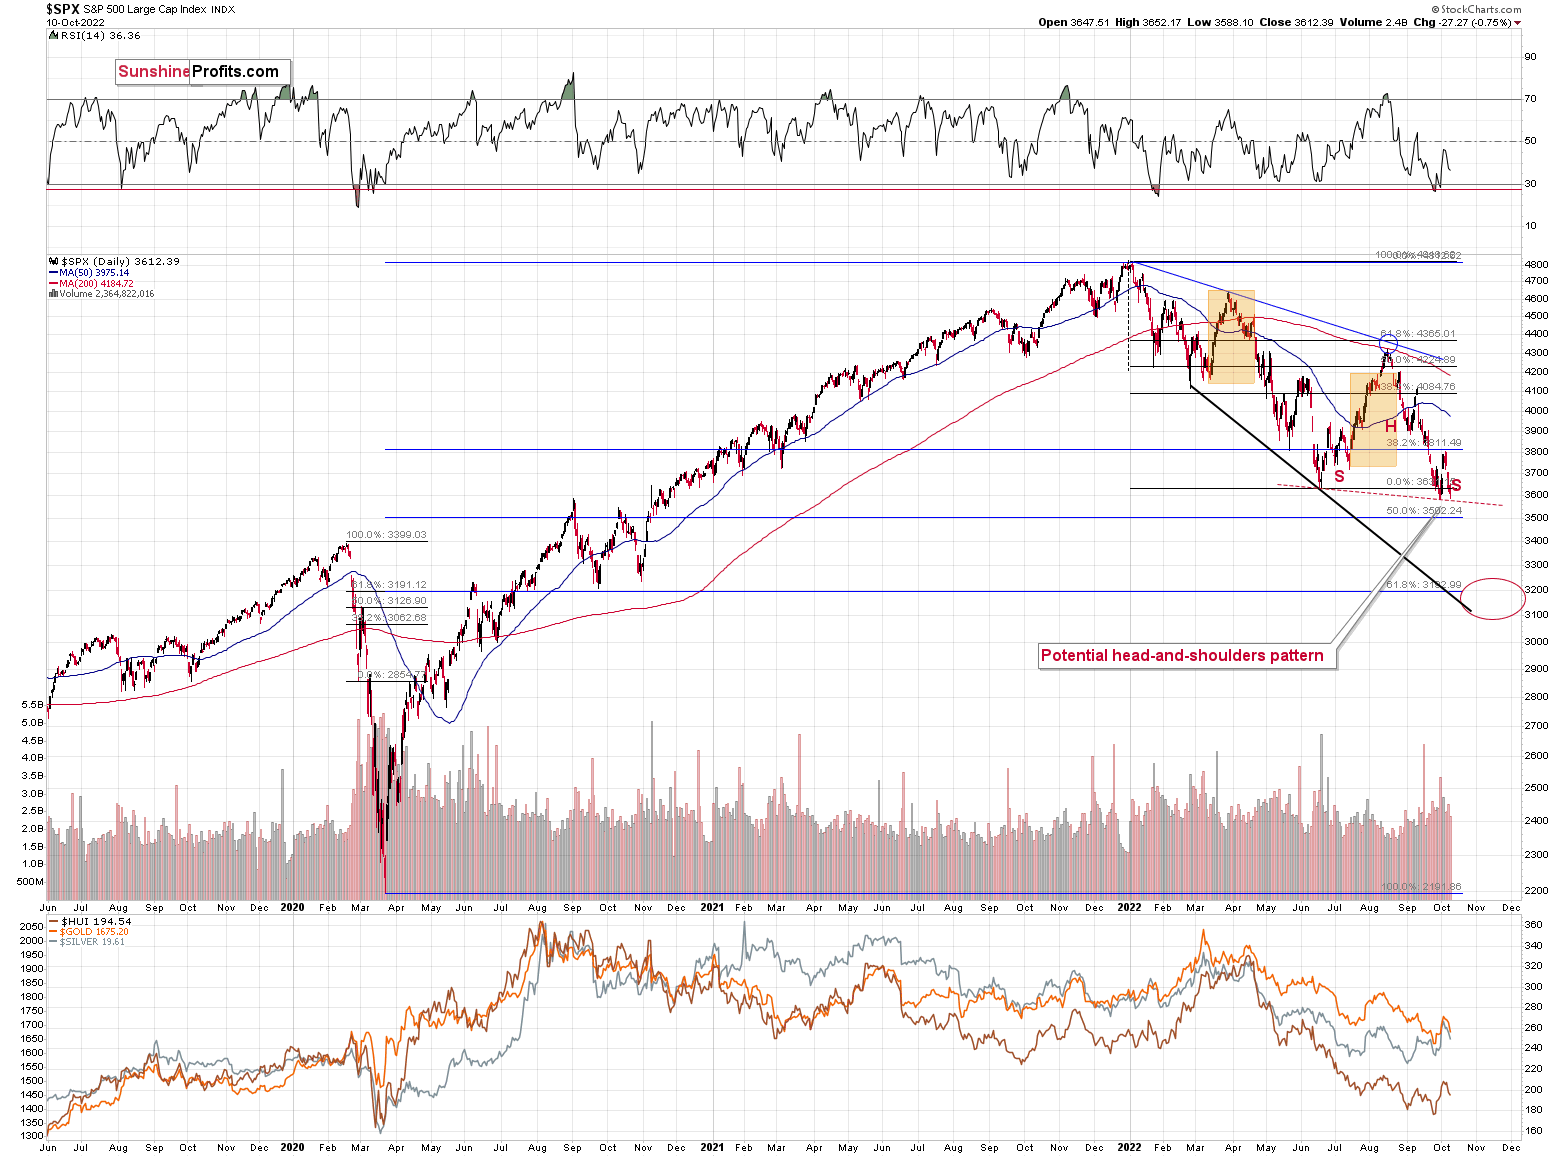
On Friday, I commented on the above chart in the following way:
Stocks rallied on the unfounded expectations of the Fed’s dovish U-turn, but it could be the case that the rally has already run its course.
The upswing was rather small, and if it is followed by another decline (and that’s likely!), it might create a very bearish head-and-shoulders pattern. This pattern would leave the door wide open to declines to the mid-2020 lows at about 3,200.
Such a decline would likely have a devastating effect on the prices of precious metals, especially silver, and mining stocks – and in particular, junior mining stocks.
As interest rates are likely to go up, the stock market is likely to go down – perhaps as low as 3,200 on a short-term basis – and then – after a correction – even lower.
If stocks decline more here, they will break below the neck level of the H&S formation, which will have very bearish effects.
Then, those who bought silver and mining stocks recently (especially juniors) are likely to drop the towel and run for the hills. That’s when the slide will likely accelerate.
As a quick reminder, silver (due to multiple industrial uses) and mining stocks (they are stocks, after all) are more closely related to the performance of the general stock market than gold.
Consequently, the bearish outlook for the precious metals sector remains intact for the coming weeks. It’s bullish in the long run, but it seems that the entire sector will need to slide first.
Having said that, let’s take a look at the markets from a more fundamental point of view.
The Carnage Continues
With gold, silver, and mining stocks underperforming the S&P 500 on Oct. 10, it was the PMs’ turn to suffer from investors’ rotation wrath. Moreover, with the pivot crowd waking up from their dovish daydream, risk assets realized that inflation remains highly problematic.
Please see below:
 Source: Bloomberg/ZeroHedge
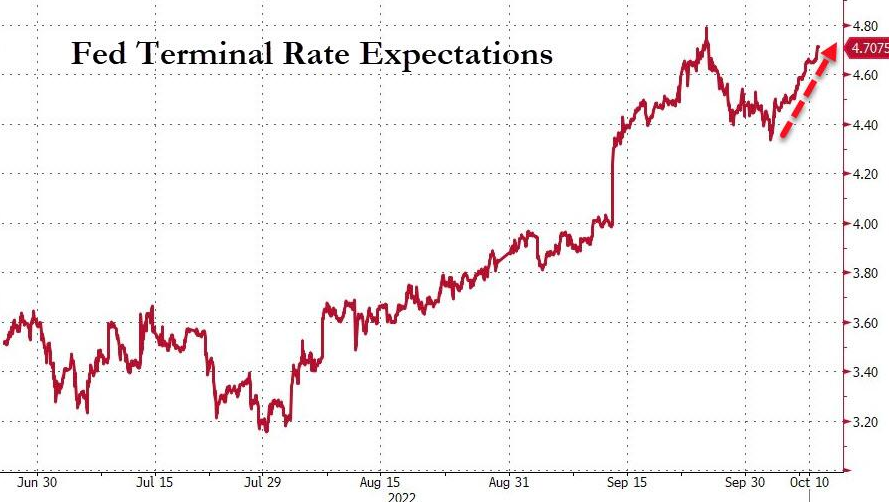
To explain, the red line above tracks the U.S. federal funds rate’s (FFR) expected peak. If you analyze the right side of the chart, you can see that the futures market is pricing in a ~4.71% FFR in 2023. More importantly, the metric has rallied sharply recently and has nearly erased all of the pivot-narrative-induced losses. As a result, hawkish realities have returned, and the implications are profoundly bearish for the PMs.
To that point, Fed officials have been out in droves warning of higher interest rates; and with Chicago Fed President Charles Evans dropping the hawkish hammer on Oct. 10, risk assets confront a materially bearish backdrop. He said:
“Inflation is the most important thing to get under control. That’s job-one. Price stability sets the stage for stronger growth in the future.”
He added:
“If unemployment goes up, that’s unfortunate. If it goes up a lot, that’s really very difficult. But price stability makes the future better.”
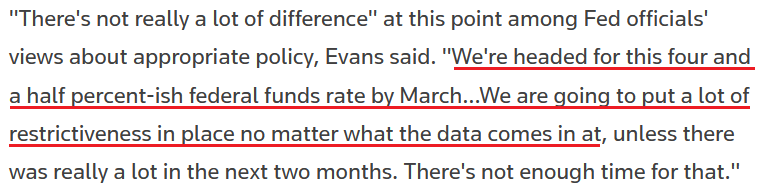
Thus, while Evans noted that a significant slowdown in inflation over “the next two months” could change his outlook (highly unlikely), he warned that the FFR would head much higher over the next ~six months.
Please see below:
 Source: Reuters
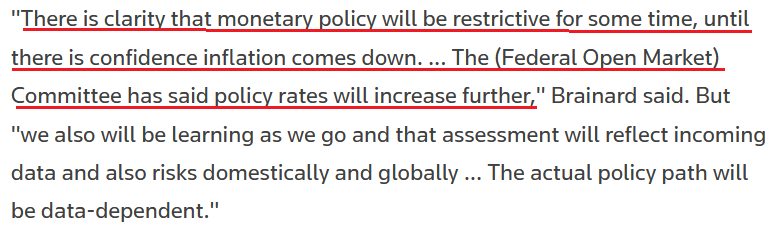
Singing a similar tune, Fed Vice Chair Lael Brainard said on Oct. 10:
“We are starting to see the effects [of a higher FFR] in some areas, but it will take some time for the cumulative tightening to transmit throughout the economy and to bring inflation down. Uncertainty remains high, and I am paying close attention to the evolution of the outlook as well as global risks (…). [However], monetary policy will be restrictive for some time to ensure that inflation moves back to target over time.”
As such, with financial market freakouts largely ignored by Fed officials, investors can’t rely on the central bank to save the day.
Please see below:
 Source: Reuters
To that point, while old habits die hard, I warned on May 25 that the post-GFC crowd doesn’t realize this time is different. I wrote:
A decade of dovish pivots has a generation of investors believing that the central bank is all talk and no action. However, with inflation at levels unseen in 40+ years, Powell is not out of ammunition, and the Fed pivot crowd should suffer profound disappointment as the drama unfolds.
The bottom line? We’ve officially entered the monetary version of The Boy Who Cried Wolf. With Fed officials running to the rescue each time the financial markets showed signs of stress, investors are programmed to ignore their hawkish threats. However, while these post-GFC pivots occurred with inflation perched near 2%, investors are so steadfast in their belief that they ignore the climactic consequences of unanchored inflation.
Therefore, with the consensus now seeing things from our point of view, the wolf has arrived; and with OPEC+ adding to the ills by reducing its oil output, the inflationary implications make an already bad situation worse.
Please see below:
 Source: Cleveland Fed
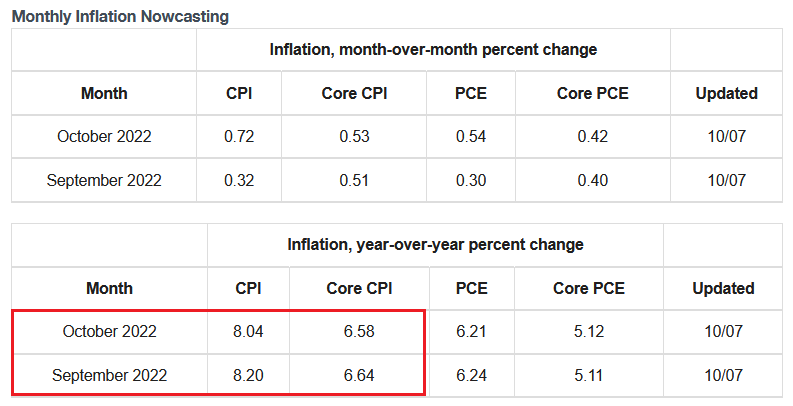
To explain, the Cleveland Fed expects the headline Consumer Price Index (CPI) to increase by 0.32% and 0.72% month-over-month (MoM) in September and October (updated on Oct. 7). Moreover, a realization would result in year-over-year (YoY) increases of 8.20% and 8.04%. As such, little inflation progress has materialized.
In addition, the core CPI is expected to remain elevated at 6.64% and 6.58% YoY in September and October. So while the supply-side proponents may blame OPEC+ for higher oil, gasoline and headline CPI readings, the reality is that resilient consumer spending keeps core inflation uplifted.
Furthermore, if the Cleveland Fed’s projections prove prescient, the core CPI will rise YoY again in September.
Please see below:
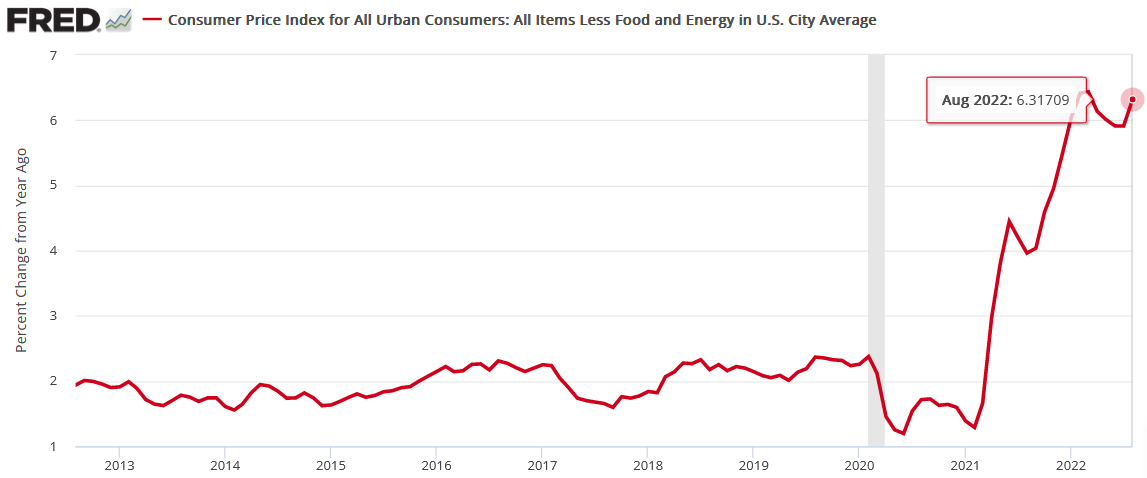
To explain, the red line above tracks the YoY percentage change in the core CPI. If you analyze the right side of the chart, you can see that the metric hit ~6.32% YoY in August. Thus, a 6.64% YoY print in September would mark another acceleration, and the latest upswing came on the back of four-consecutive monthly YoY declines, which highlights the difficulty of suppressing unanchored inflation.
Also, since the pivot crowd argues that the Fed can’t control commodity supply or their prices (which has merit), the historical implications of the FFR and the core CPI highlight the challenges that lie ahead.
Please see below:
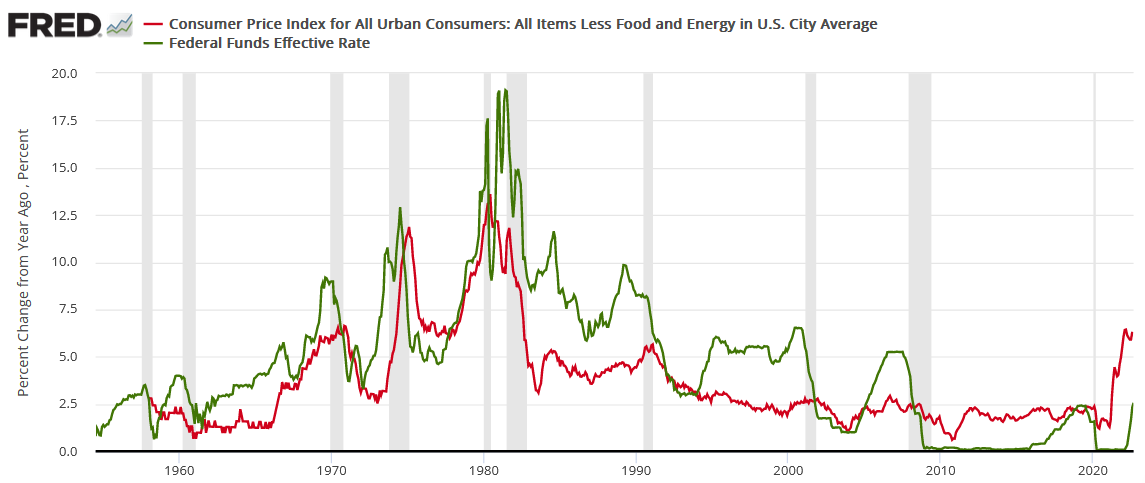
To explain, the red line above tracks the YoY percentage change in the core CPI, while the green line above tracks the FFR. As you can see, the FFR always eclipses the YoY core CPI during the Fed's rate hike cycles. Therefore, while August's core CPI print implies a peak FFR of more than 6%, our projection of 4.5% to 5.5% in 2023 is a conservative and realistic estimate.
More importantly, a realization is profoundly bullish for the USD Index and the U.S. 10-Year real yield. In contrast, it's an ominous development for gold, silver and mining stocks.
High-Class Warnings
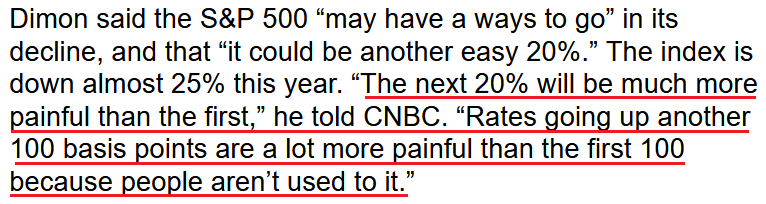
While both billionaires have held consistent views for many months, influential market participants made headlines on Oct. 10. For example, JPMorgan CEO Jamie Dimon – who heads the largest bank in the U.S. – said that “Europe is already in recession” and the region is “likely to put the U.S. in some kind of recession six to nine months from now.”
Thus, while he said we should “keep our fingers crossed” that the Fed can engineer a soft landing, he added that “It can go from very mild to quite hard,” which could push the S&P 500 lower by “another easy 20%.”
He continued:
“The likely place you’re going to see more of a crack and maybe a little bit more of a panic is in credit markets, and it might be ETFs, it might be a country, it might be something you don’t suspect. If you make a list of all the prior crises, sitting here we would not have predicted where they came from, though I think you could predict this time that it probably will happen.”
As a result, another bout of panic and a sharp drawdown of the S&P 500 could inflict plenty of pain on the PMs, especially silver and mining stocks.
Please see below:
 Source: Bloomberg
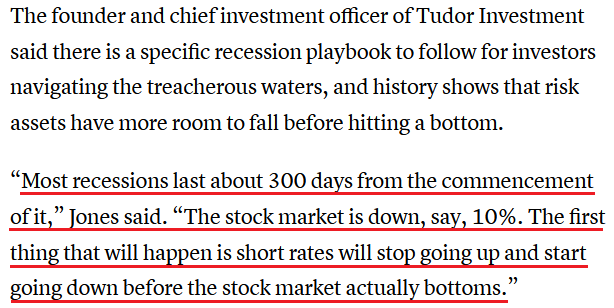
Also noteworthy, hedge fund manager Paul Tudor Jones said on Oct. 10:
“Inflation is a bit like toothpaste. Once you get it out of the tube, it’s hard to get it back in. The Fed is furiously trying to wash that taste out of their mouth. ... If we go into recession, that has really negative consequences for a variety of assets.”
Moreover, he cited my argument that a hyperinflationary collapse is much worse than a rate-hike-induced recession.
“If they don’t keep going and we have high and permanent inflation, it just creates I think more issues down the road,” Jones said. “If we are going to have long-term prosperity, you have to have a stable currency and a stable way to value it. You have to have [inflation] 2% and under in the very long run to have a stable society. There’s short-term pain associated with long-term gain.”
So while Jones expects a milder drawdown of 10% from here, the PMs are unlikely to perform well if the S&P 500 slides. Furthermore, his recession playbook shows that short-term interest rates often retreat before the stock market bottoms (pricing in a Fed pivot), and we’re nowhere near that. Therefore, more downside should confront the PMs before long-term buying opportunities emerge.
 Source: CNBC
The Bottom Line
The financial markets are fighting an uphill battle as hawkish realities depress investor sentiment. Moreover, while oversold conditions can elicit short-term bounces, the medium-term technicals and fundamentals remain firmly bearish. Likewise, with demand still outweighing supply in the U.S. labor market, the Fed has plenty of room to hike interest rates before unemployment becomes problematic. As such, the backdrop is highly bullish for the USD Index and real yields.
In conclusion, the PMs declined on Oct. 10, as risk assets remained under pressure; and while the U.S. bond market was closed, the USD Index rallied for the fourth-straight day. In addition, with the dollar basket, real yields and rate hike expectations largely moving in lockstep, gold, silver, mining stocks and the S&P 500 should remain on the defensive over the next few months.
Overview of the Upcoming Part of the Decline
- It seems to me that the corrective upswing is over, and that the next big move lower is already underway.
- If we see a situation where miners slide in a meaningful and volatile way while silver doesn’t (it just declines moderately), I plan to – once again – switch from short positions in miners to short positions in silver. At this time, it’s too early to say at what price levels this could take place and if we get this kind of opportunity at all – perhaps with gold prices close to $1,600.
- I plan to switch from the short positions in junior mining stocks or silver (whichever I’ll have at that moment) to long positions in junior mining stocks when gold / mining stocks move to their 2020 lows (approximately). While I’m probably not going to write about it at this stage yet, this is when some investors might consider getting back in with their long-term investing capital (or perhaps 1/3 or 1/2 thereof).
- I plan to return to short positions in junior mining stocks after a rebound – and the rebound could take gold from about $1,450 to about $1,550, and it could take the GDXJ from about $20 to about $24.
- I plan to exit all remaining short positions once gold shows substantial strength relative to the USD Index while the latter is still rallying. This may be the case with gold prices close to $1,400 and GDXJ close to $15 . This moment (when gold performs very strongly against the rallying USD and miners are strong relative to gold after its substantial decline) is likely to be the best entry point for long-term investments, in my view. This can also happen with gold close to $1,400, but at the moment it’s too early to say with certainty.
- The above is based on the information available today, and it might change in the following days/weeks.
You will find my general overview of the outlook for gold on the chart below:
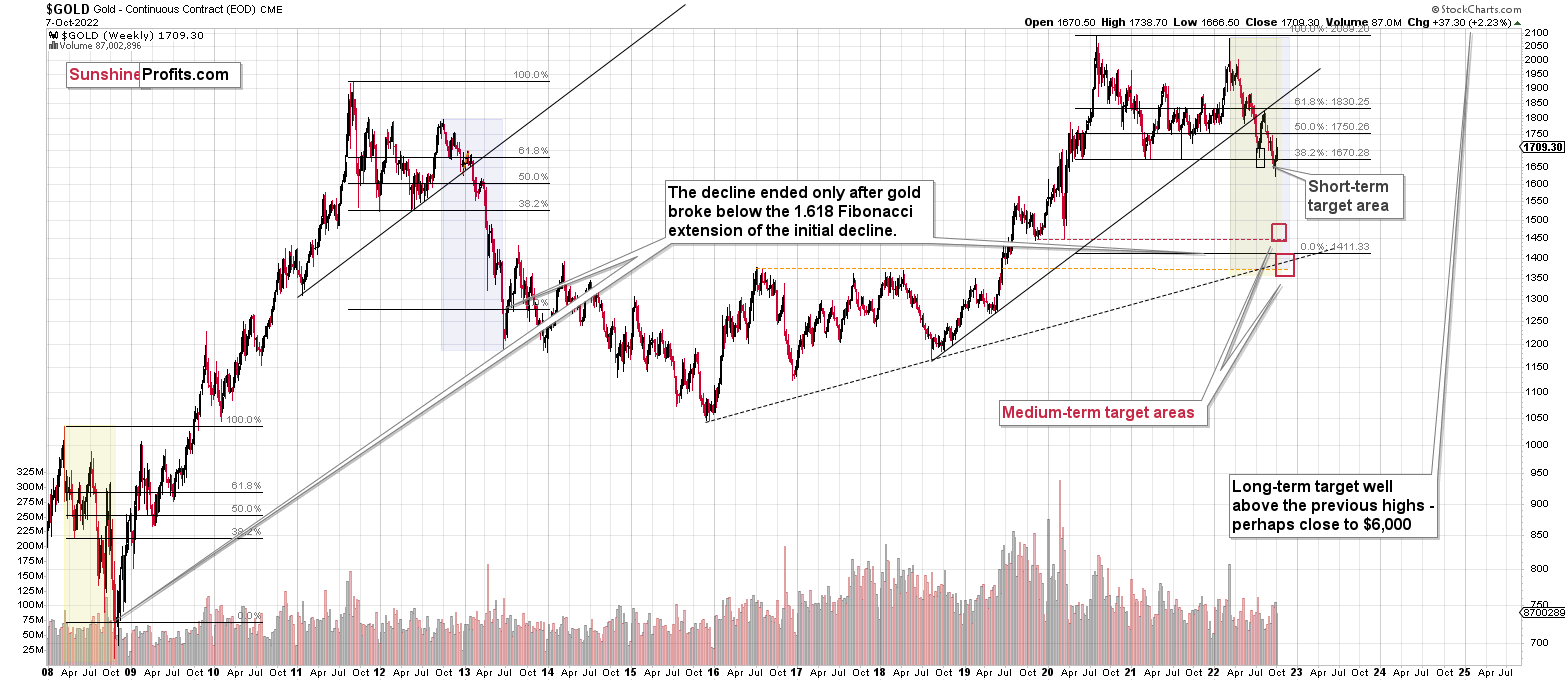
Please note that the above timing details are relatively broad and “for general overview only” – so that you know more or less what I think and how volatile I think the moves are likely to be – on an approximate basis. These time targets are not binding nor clear enough for me to think that they should be used for purchasing options, warrants, or similar instruments.
Letters to the Editor
Q: A GDXJ 14-day RSI at 30 would price it at around $23.16. Would not this be the next price at which an upside correction would occur?
A: It’s certainly possible, but I don’t view this as the most likely outcome. The bottoms can form when RSI is at 30 or just “close to” this level.
Remember the May 2022 bottom? Or the 2020 bottom? They both formed with an RSI below 30. In the latter case, it was well below 30 – actually slightly below 20.
If the situation develops as it did in 2013, and the move lower is truly big, then the price might need to move to a strong support level before it bounces – RSI on its own might not be enough to trigger a rebound. The 2020 lows provide such very strong support.
Of course, that’s just my opinion on that matter.
Q: Why does GDXJ go down more when gold is down a lot?
A: Because the profits of junior mining companies (the GDXJ is a proxy for them) go down more than gold itself when gold declines. In other words, one of the key factors the “operational leverage”.
To simplify:
Profit = Revenue – Costs
Example 1: $1000 (profit) = $1700 (revenue) - $700 (cost)
Example 2: $500 (profit) = $1200 (revenue) - $700 (cost)
In the above case, the revenue (based on the price of gold, for example) dropped from $1,700 to $1,200, so by about 29.4%. However, the profit dropped by 50%.
If those companies are not even producing gold (and often they are not, as they are, well, junior mining stocks, not senior producers), the effect can be even stronger as the “profits” are just “perceived” and “expected”. And when gold falls, it’s easy for people to predict even lower prices in the future.
Another reason is that junior mining stocks, are ultimately stocks and their performance is also somewhat linked to the performance of the general stock market. And as the stock market has declined so far this year, junior miners have underperformed.
Summary
Summing up, it seems that the biggest part of the 2013-like decline is taking place right now, and – while I can’t make any promises regarding performance - it seems likely to me that our big profits are about to become huge, and then ridiculously big in the relatively near future.
As far as this quick corrective upswing is concerned, it seems that it might already be over.
The current quick upswing most likely doesn’t change anything. Fundamentals and technicals continue to point to lower precious metals values in the coming weeks / months. The current geopolitical news-based rally is likely to serve as nothing more than just a verification of the breakdown below the previous lows in gold.
Things might happen very fast in the coming days, and if I plan to make any adjustments, I’ll keep you informed. Still, if the targets that I’m mentioning in the “Trading” part of the summary are reached, I think that profits should be taken off the table without an additional confirmation from me. I will probably get on the long side of the market at that time, but I’ll send a confirmation if I decide to do so.
After the final sell-off (that takes gold to about $1,350-$1,500), I expect the precious metals to rally significantly. The final part of the decline might take as little as 1-5 weeks, so it's important to stay alert to any changes.
As always, we'll keep you – our subscribers – informed.
To summarize:
Trading capital (supplementary part of the portfolio; our opinion): Full speculative short positions (300% of the full position) in junior mining stocks are justified from the risk to reward point of view with the following binding exit profit-take price levels:
Mining stocks (price levels for the GDXJ ETF): binding profit-take exit price: $20.32; stop-loss: none (the volatility is too big to justify a stop-loss order in case of this particular trade)
Alternatively, if one seeks leverage, we’re providing the binding profit-take levels for the JDST (2x leveraged). The binding profit-take level for the JDST: $29.87; stop-loss for the JDST: none (the volatility is too big to justify a SL order in case of this particular trade).
For-your-information targets (our opinion; we continue to think that mining stocks are the preferred way of taking advantage of the upcoming price move, but if for whatever reason one wants / has to use silver or gold for this trade, we are providing the details anyway.):
Silver futures downside profit-take exit price: $12.32
SLV profit-take exit price: $11.32
ZSL profit-take exit price: $79.87
Gold futures downside profit-take exit price: $1,504
HGD.TO – alternative (Canadian) 2x inverse leveraged gold stocks ETF – the upside profit-take exit price: $19.87
HZD.TO – alternative (Canadian) 2x inverse leveraged silver ETF – the upside profit-take exit price: $49.87
Long-term capital (core part of the portfolio; our opinion): No positions (in other words: cash)
Insurance capital (core part of the portfolio; our opinion): Full position
Whether you’ve already subscribed or not, we encourage you to find out how to make the most of our alerts and read our replies to the most common alert-and-gold-trading-related-questions.
Please note that we describe the situation for the day that the alert is posted in the trading section. In other words, if we are writing about a speculative position, it means that it is up-to-date on the day it was posted. We are also featuring the initial target prices to decide whether keeping a position on a given day is in tune with your approach (some moves are too small for medium-term traders, and some might appear too big for day-traders).
Additionally, you might want to read why our stop-loss orders are usually relatively far from the current price.
Please note that a full position doesn't mean using all of the capital for a given trade. You will find details on our thoughts on gold portfolio structuring in the Key Insights section on our website.
As a reminder - "initial target price" means exactly that - an "initial" one. It's not a price level at which we suggest closing positions. If this becomes the case (as it did in the previous trade), we will refer to these levels as levels of exit orders (exactly as we've done previously). Stop-loss levels, however, are naturally not "initial", but something that, in our opinion, might be entered as an order.
Since it is impossible to synchronize target prices and stop-loss levels for all the ETFs and ETNs with the main markets that we provide these levels for (gold, silver and mining stocks - the GDX ETF), the stop-loss levels and target prices for other ETNs and ETF (among other: UGL, GLL, AGQ, ZSL, NUGT, DUST, JNUG, JDST) are provided as supplementary, and not as "final". This means that if a stop-loss or a target level is reached for any of the "additional instruments" (GLL for instance), but not for the "main instrument" (gold in this case), we will view positions in both gold and GLL as still open and the stop-loss for GLL would have to be moved lower. On the other hand, if gold moves to a stop-loss level but GLL doesn't, then we will view both positions (in gold and GLL) as closed. In other words, since it's not possible to be 100% certain that each related instrument moves to a given level when the underlying instrument does, we can't provide levels that would be binding. The levels that we do provide are our best estimate of the levels that will correspond to the levels in the underlying assets, but it will be the underlying assets that one will need to focus on regarding the signs pointing to closing a given position or keeping it open. We might adjust the levels in the "additional instruments" without adjusting the levels in the "main instruments", which will simply mean that we have improved our estimation of these levels, not that we changed our outlook on the markets. We are already working on a tool that would update these levels daily for the most popular ETFs, ETNs and individual mining stocks.
Our preferred ways to invest in and to trade gold along with the reasoning can be found in the how to buy gold section. Furthermore, our preferred ETFs and ETNs can be found in our Gold & Silver ETF Ranking.
As a reminder, Gold & Silver Trading Alerts are posted before or on each trading day (we usually post them before the opening bell, but we don't promise doing that each day). If there's anything urgent, we will send you an additional small alert before posting the main one.
Thank you.
Przemyslaw Radomski, CFA
Founder, Editor-in-chief

