

Briefly: in our opinion, full (300% of the regular position size) speculative short positions in junior mining stocks are justified from the risk/reward point of view at the moment of publishing this Alert.
Gold, silver, and mining stocks declined on Friday, which means that points from my previous analysis remain up-to-date. The way they all declined is quite interesting, though, and that’s what I’d like to discuss in the technical part of today’s analysis.
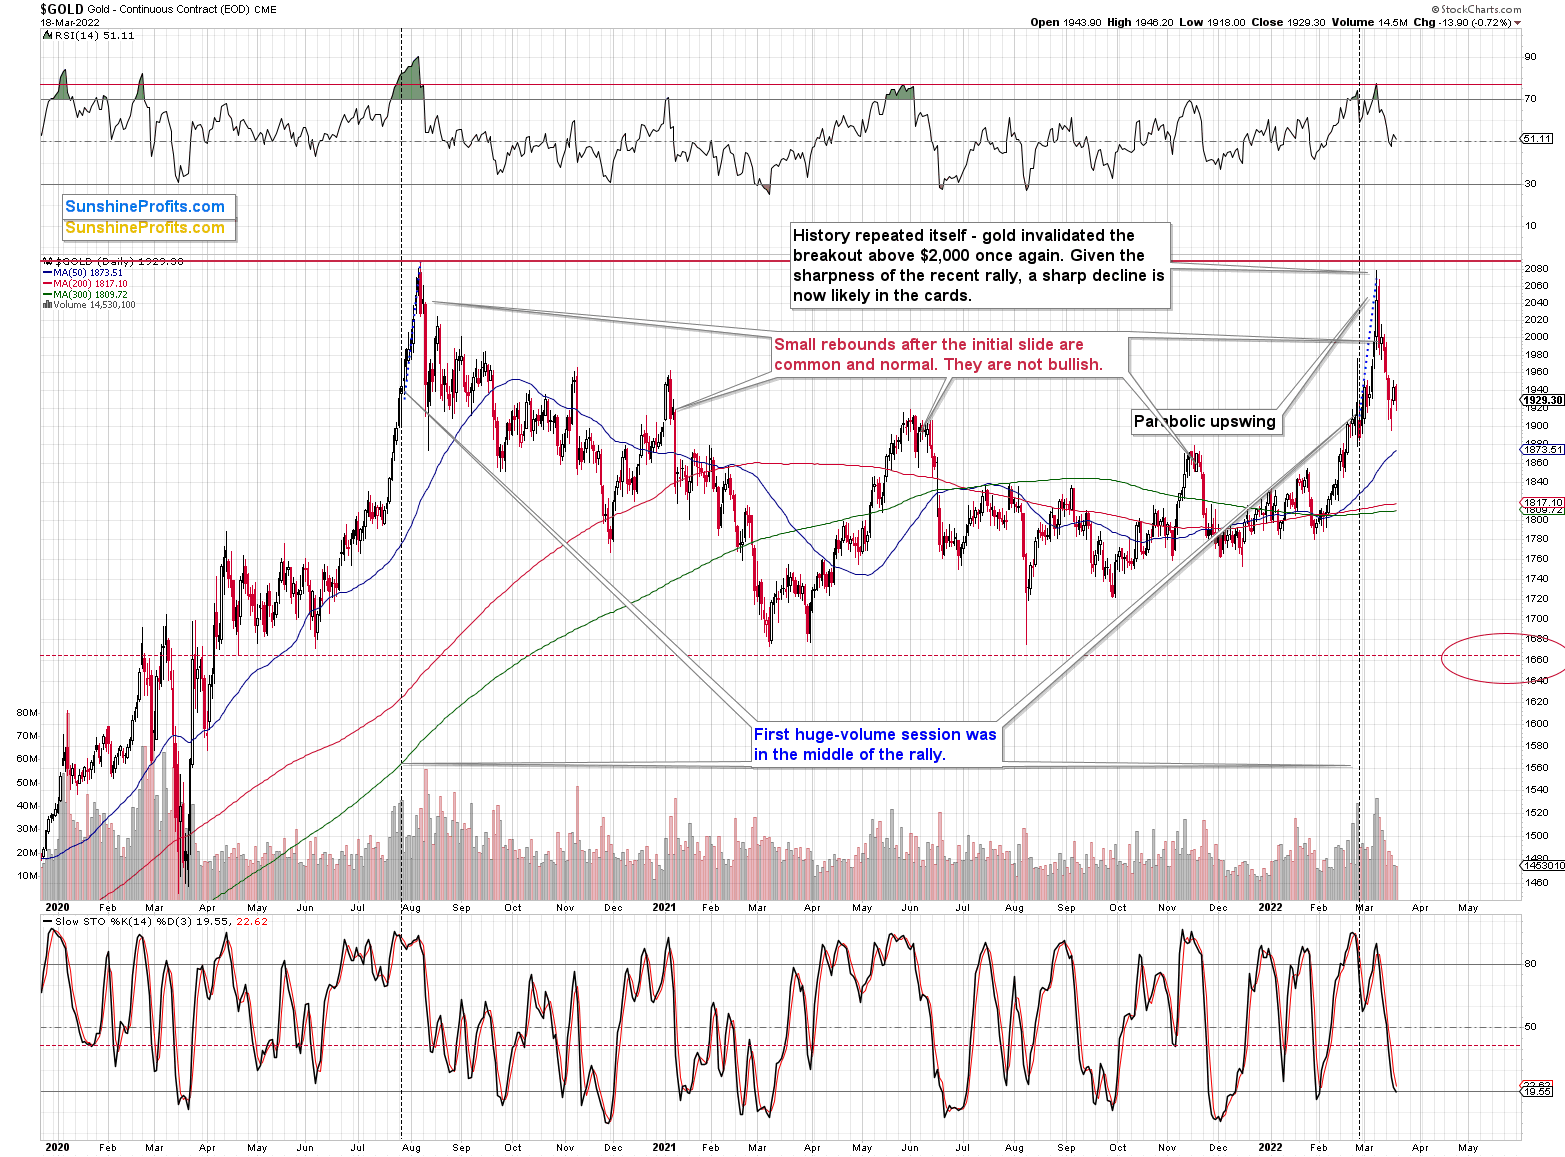
Gold declined by $13.90 on Friday (Mar. 18), and the move took place on low volume. That was yet another day when gold moved on one of the lowest volumes we’ve seen this year.
This tells us two things:
- Gold’s recent upswing was likely just a breather within a bigger decline.
- Friday’s decline is probably just the initial part of the decline, as the sellers have barely entered the arena.
Let’s focus on the second point for a moment. The way the market works is that there must be fresh buying power for the price to keep moving. If there are no buyers and sellers, the price will not stay at the previous levels, but rather decline until buyers show up. That’s what we saw on Friday: people were not interested in selling or in buying – they were waiting for the situation to clarify.
Remember when gold declined on relatively low volume in early June 2021? That was the very initial part of the move lower. The decline gained momentum when sellers intensified their activities, and the short-term decline was over when they got ahead of themselves – huge daily volume confirmed it.
What does it tell us now? It tells us that the decline is likely in its early days, not close to its end.
Besides, looking at gold’s weekly chart shows us that gold did exactly what it was supposed to do based on the previous week’s huge reversal.
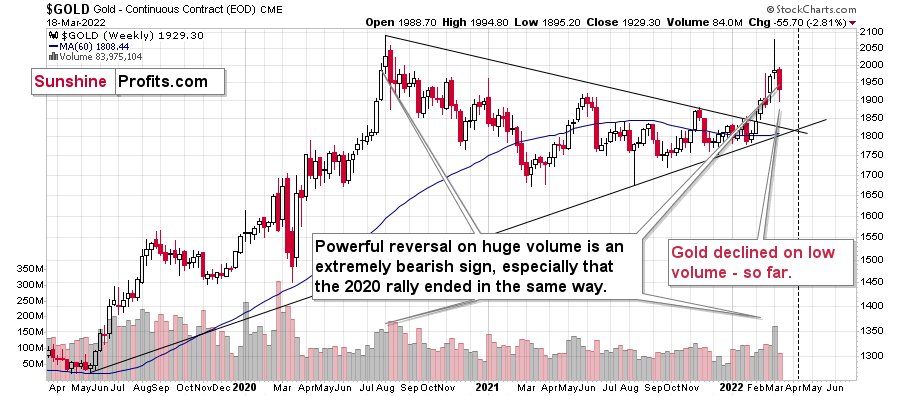
Last week, I commented on the above chart in the following way:
(…) gold’s weekly chart, which shows last week’s key development.
By key development, I mean – of course – gold’s failed attempt to rally above its 2020 high that ended in a powerful weekly reversal candlestick. These patterns are particularly bearish when they are accompanied by strong volume, and that’s exactly what we saw last week.
Gold reversed on volume that was huge – it was the biggest weekly volume that we’ve seen in months.
In fact, it was the highest weekly volume that we saw while gold still ended the week higher than the week that directly preceded the 2020 slide.
Please note that while gold declined over $50 last week, it moved lower on rather low volume, which makes last week somewhat similar to what we saw at the end of 2020. Back then, gold also declined on low volume, and that was actually the beginning of a much bigger decline.
Is the same thing likely to happen to gold next? Yes, and that’s in perfect tune with how gold used to perform after previous military invasions (U.S. – Afghanistan, U.S. – Iraq, Russia – Crimea). Namely, gold rallies initially, mostly on rumors, and then declines once military operations start. That’s simply the way in which the gold market implements the buy-the-rumor-sell-the-fact rule.
The low-volume decline materialized in silver and mining stocks, too.
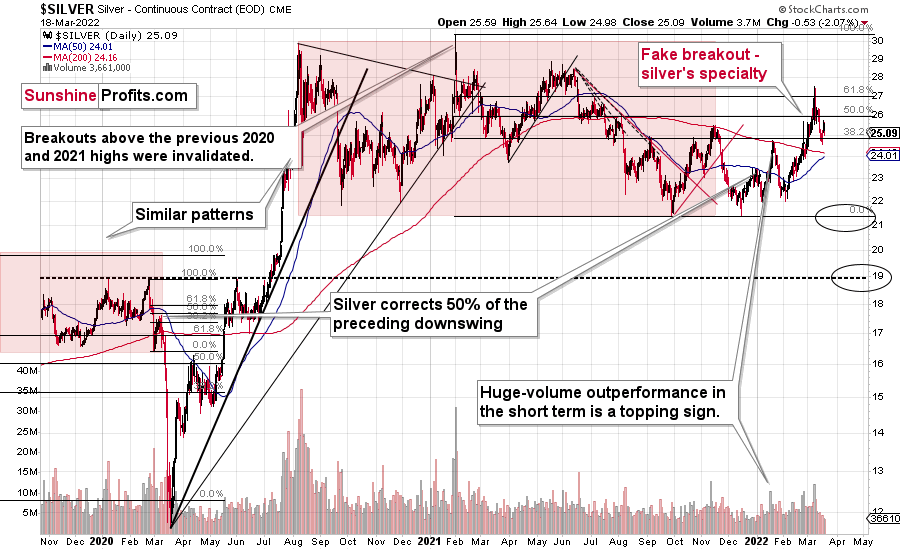
Interestingly, both silver price and junior mining stocks ended last week below their late-2021 highs. So, yes, gold’s rally was significant this year (the breakout above the previous highs was invalidated, though, and that’s a powerful sell signal), but silver and junior miners moved only slightly and temporarily above their respective late-2021 highs.
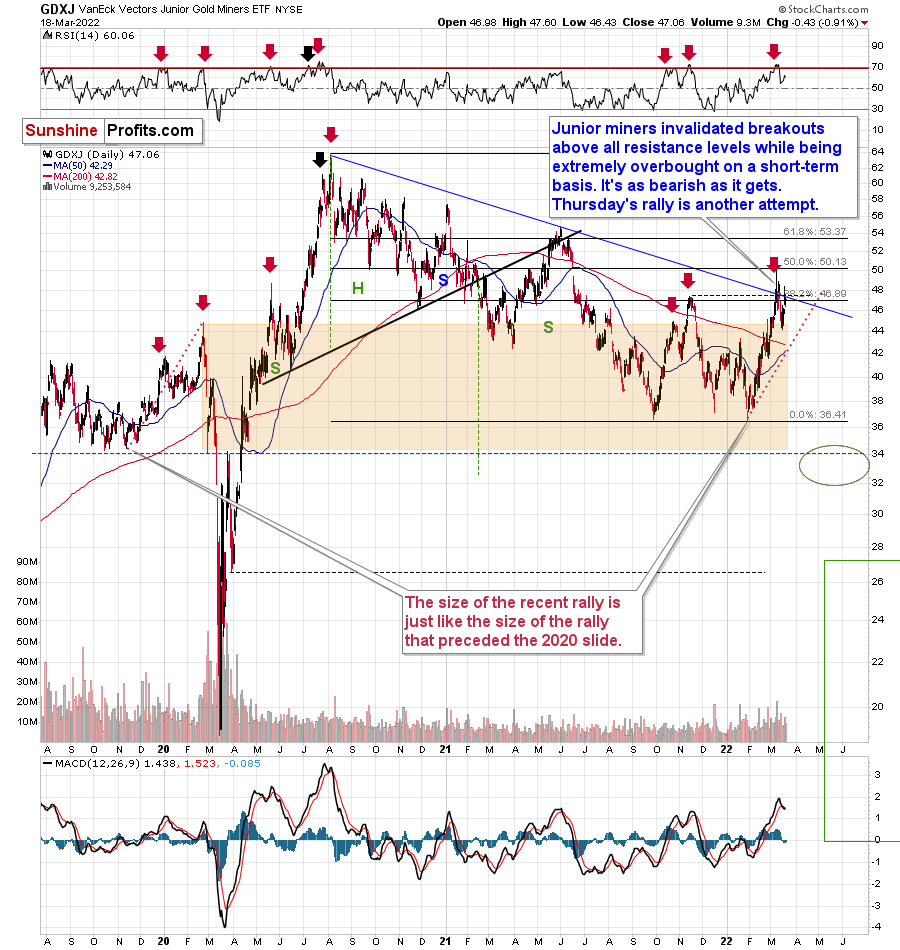
Silver invalidated its breakout above the 61.8% Fibonacci retracement, while junior miners invalidated their breakout above the 38.2% retracement (in intraday terms). The latter also invalidated two attempts to break above the declining medium-term resistance line that I marked in blue. In short, that’s very bearish.
Also, let’s not forget about the recent sell signal from GDXJ’s MACD indicator. We’ve only seen it a couple of times in the recent past, and it provided useful medium-term selling signals. Please note how significant declines occurred in January 2021, June 2021, and November 2021. The selling signal that we saw in October 2021 did not mark the final top, but it was still very close to it, and the overall implications can be viewed as bearish.
We saw it once again, and we’re likely to see the same thing that we saw in previous cases – significant declines.
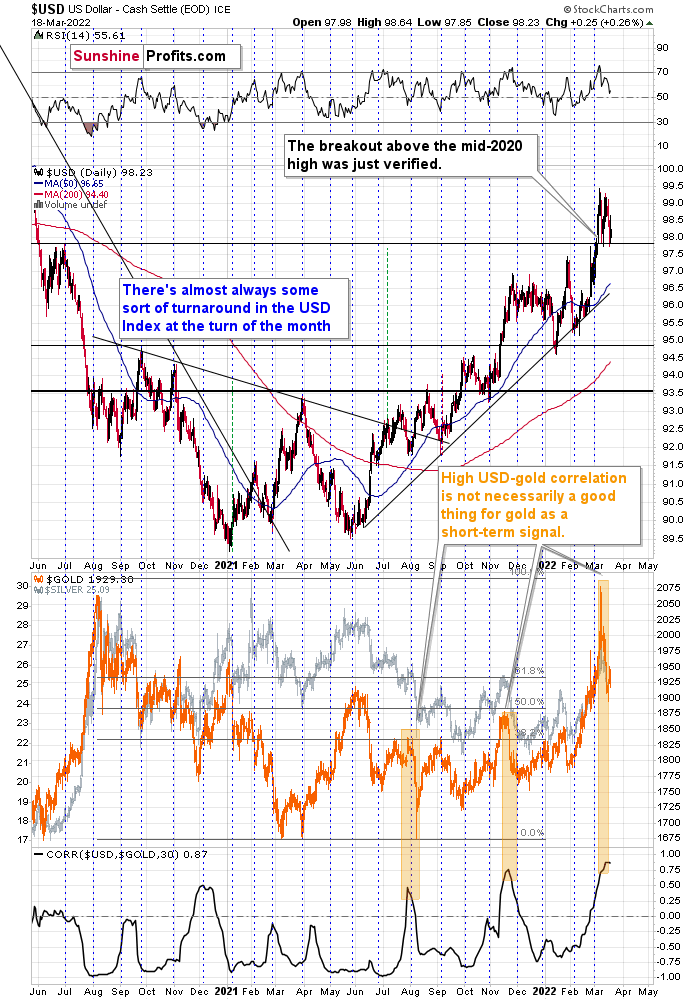
Besides, given the USD Index’s confirmation of the breakout above its mid-2020 highs, it’s likely to move higher once again. Since the war-uncertainty-based rally in both gold and the USDX appears to be over, the negative link between both markets is likely to return shortly – along with gold’s declines – similarly to what we saw in mid-2021 and late-2021 (marked with orange rectangles).
All in all, technicals favor a decline in the precious metals sector sooner rather than later.
Having said that, let’s take a look at the market from a more fundamental point of view.
The Doves Are Gone
With rampant inflation forcing the Fed into a hawkish corner, I warned throughout 2021 that the end of looser-for-longer monetary policy would surprise investors. To explain, I wrote on Aug. 31:
With Fed Chairman Jerome Powell threading the dovish needle on Aug. 27, investors rejoiced as he downplayed the consequences of surging inflation. However, while his perpetual patience may elicit comfort in the short term, the medium-term ramifications could end up shocking the financial markets.
Case in point: while Powell allows the economy to run hot, his lack of prudence has left him far behind the inflation curve. With one policy mistake liable to result in an accelerated rate hike cycle once the Fed finally moves, his ability to placate investors could come under immense pressure.
Now, with the most dovish Fed official sounding the hawkish alarm on Mar. 18, the PMs could suffer a hard landing as the liquidity drain unfolds. To explain, Minneapolis Fed President Neel Kashkari preached patience throughout all of 2021. However, in an article written on Mar. 18, he stated:
“In the September 2021 Summary of Economic Projections (SEP), I estimated inflation would be 4.2 percent for 2021 and 1.8 percent for 2022. Actual inflation for 2021 ended up being 5.8 percent, and I just increased my forecast this week to 4.5 percent for 2022. PCE inflation for the 12 months through January was 6.1 percent. What happened, and why were my forecasts about inflation wrong?”
Well, after citing multiple factors including supply chain disruptions, wage inflation and resilient consumer demand, he concluded:
“The FOMC has already made a profound shift in the past six months with its forward guidance on the path of the federal funds rate and the balance sheet, and I believe the SEP we just released is sending a strong signal that further reinforces our commitment to achieving our inflation target. The first hike we announced this week demonstrates that we will follow through on our guidance with action.”
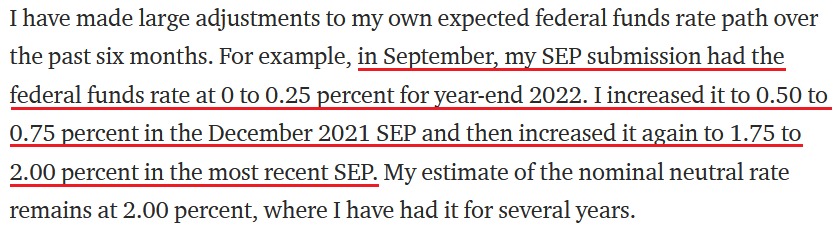
More importantly, though, he said:
 Source: Neel Kashkari/Medium
Thus, the most dovish Fed official of them all expects the U.S. federal funds rate to hit 1.75% to 2% by the end of 2022. For context, this implies seven to eight rate hikes, which is in line or slightly more than the FOMC's median estimate of seven. Moreover, when the doves turn hawkish, the medium-term implications are often profound. While the PMs remain elevated for the time being, their fundamental outlooks continue to worsen.
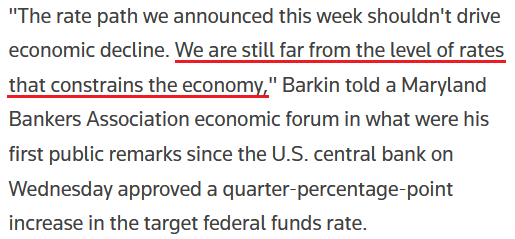
To that point, other Fed officials also made the rounds on Mar. 18. For example, Richmond Fed President Thomas Barkin said that "think of [the SEP] as an indication that the extraordinary support of the pandemic era is unwinding." Moreover, he stated that the U.S. federal funds rate still has plenty of room to run.
Please see below:
 Source: Reuters
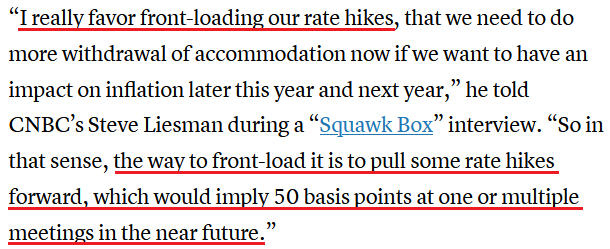
Likewise, Fed Governor Christopher Waller told CNBC on Mar. 18 that “inflation is raging.” Moreover, he said that the neutral federal funds rate likely lies between 2% and 2.25%, and that the Fed should “try to be above that by the end of the year.” As a result, he’s advocating for more than eight or nine rate hikes by the end of 2022. For context, the neutral rate is the overnight lending rate that neither expands nor restricts the U.S. economy.
Furthermore, with inflation showing no signs of slowing down, Waller said that he expects a 50 basis point rate hike “at one or multiple meetings in the near future.”
Please see below:
 Source: CNBC
If that wasn’t enough, St. Louis Fed President James Bullard went rogue on Mar. 18. Releasing a statement about his dissatisfaction with the FOMC’s 25 basis point rate hike, he stated:
“I dissented with the Federal Open Market Committee (FOMC) decision announced on March 16, 2022, to raise the target range for the federal funds rate by 25 basis points to 0.25% to 0.50%. In my view, raising the target range to 0.50% to 0.75% and implementing a plan for reducing the size of the Fed’s balance sheet would have been more appropriate actions.”
He added:
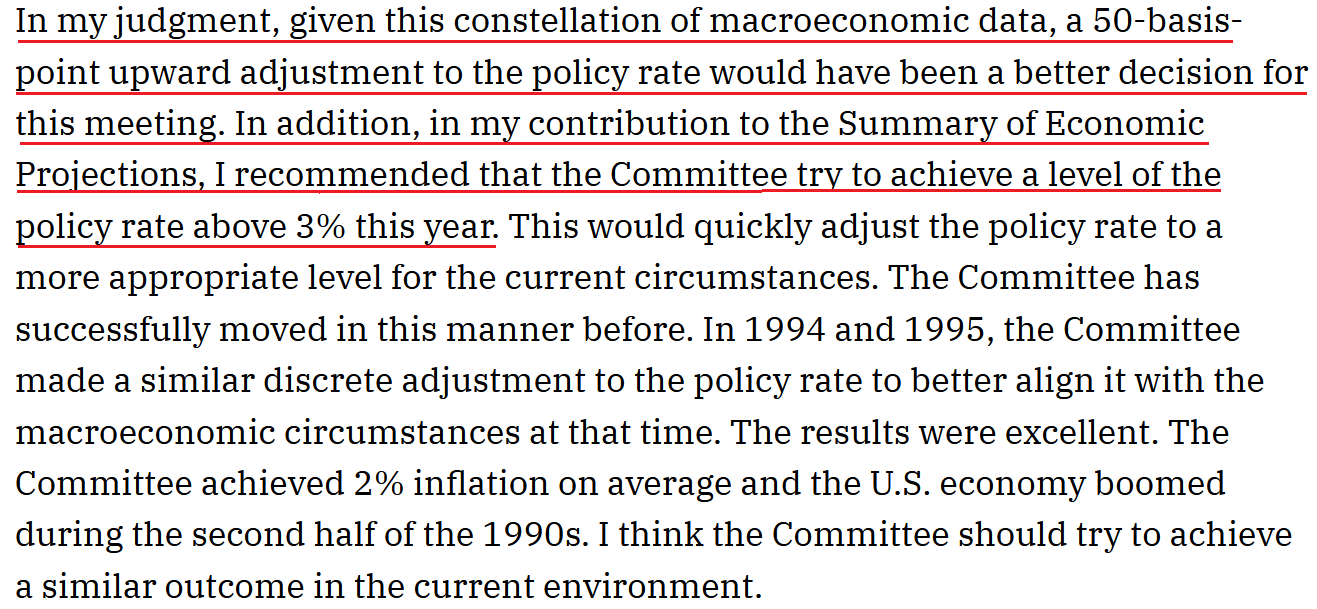
“The combination of strong real economic performance and unexpectedly high inflation means that the Committee’s policy rate is currently far too low to prudently manage the U.S. macroeconomic situation. Moreover, U.S. monetary policy has been unwittingly easing further because inflation has risen sharply while the policy rate has remained very low, pushing short-term real interest rates lower. The Committee will have to move quickly to address this situation or risk losing credibility on its inflation target.”
As a result:
 Source: James Bullard/ St. Louis Fed
Thus, while Bullard is clearly on the hawkish end of the spectrum, he’s advocating for 12 or more rate hikes by the end of 2022. Therefore, while the gold price remain sanguine due to the Russia-Ukraine conflict, the potential for seven to 12+ rate hikes is profoundly bearish. Moreover, with financial conditions already tight and poised to tighten further, these environments are often unkind to the entire commodity complex.
Please see below:
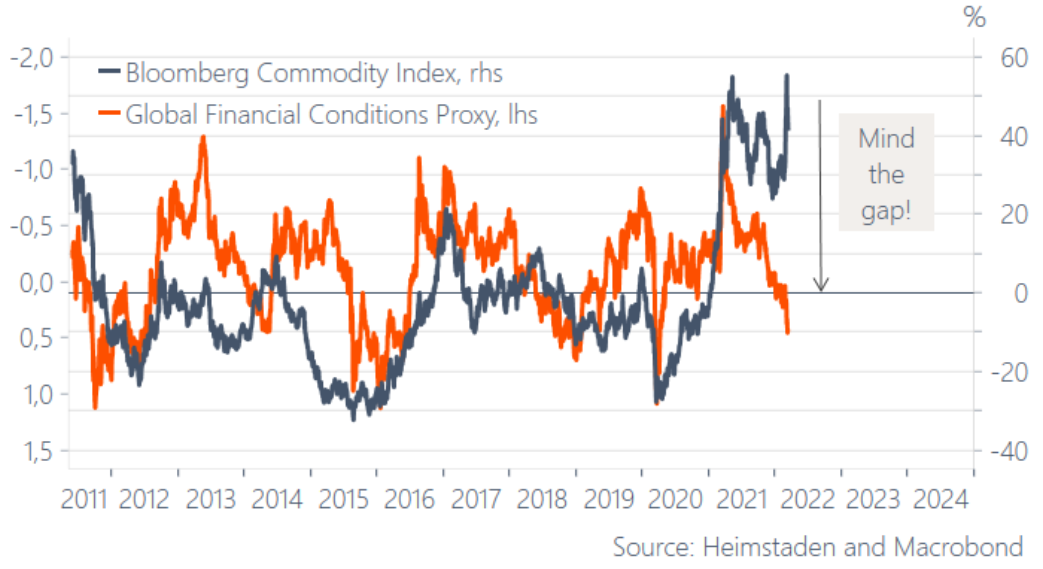
To explain, the blue line above tracks the year-over-year (YoY) percentage change in the Bloomberg Commodity Index, while the orange line above tracks the inverted YoY percentage change in global financial conditions. For context, inverted means that the latter’s scale is flipped upside down and that a falling orange line means that financial conditions are tightening.
If you analyze the relationship, you can see that tighter financial conditions often result in weaker performance by commodities.
Moreover, with the Fed poised to raise interest rates several times in the coming months, the liquidity drain should intensify. As a result, the PMs may suffer sharp declines when the profound divergence reverts to its historical norm.
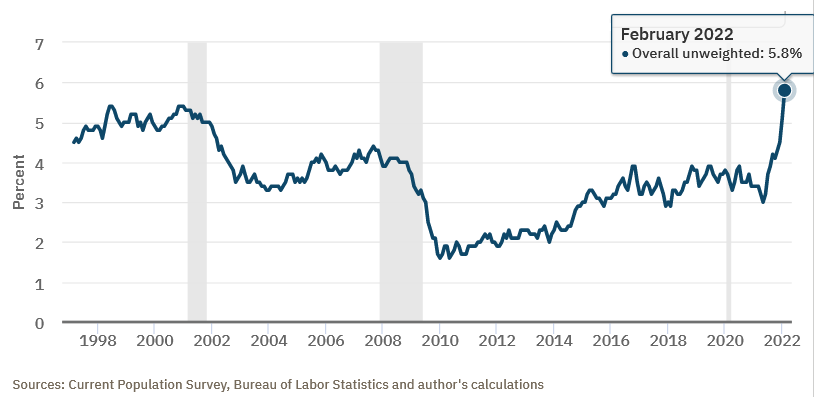
Furthermore, with the Fed still behind the inflation curve, a 25 basis point rate hike does little to calm the pricing pressures, and with the Atlanta Fed’s wage tracker hitting an all-time high in February, the wage-price spiral is unlikely to unwind without swift monetary intervention.
Please see below:
Finally, I noted previously that Treasury market depth continues to deteriorate. To explain, I wrote on Mar. 16:
The U.S. 10-Year Treasury yield rallied again on Mar. 15 and closed at another 2022 high of 2.15%. Moreover, with liquidity in the futures market continuing to deteriorate, more yield spikes could be on the horizon.
Please see below:
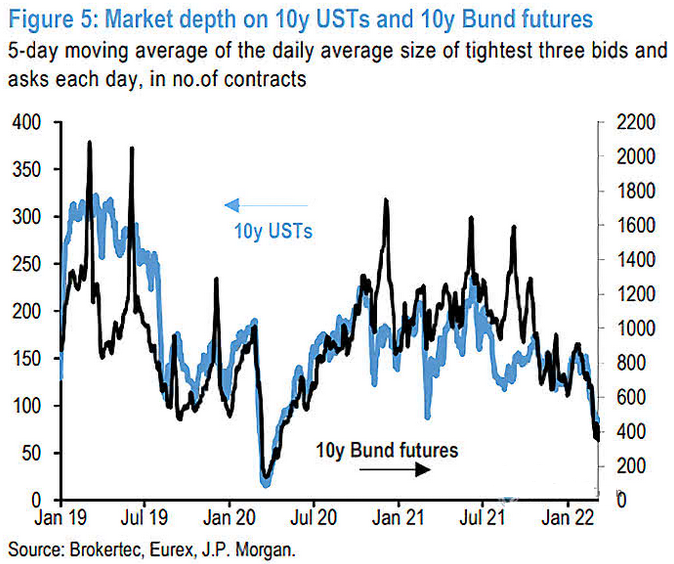
To explain, the black and blue lines above track the market depth for 10-Year Treasury and Bund (German bonds) futures. If you analyze the right side of the chart, you can see that the five-day moving average of the tightest bid-ask settlements continues to decline. As a result, a shallow market has resulted in more contracts being settled with wider bid-ask spreads.
In turn, this creates liquidity risk, as buyers may not be there when large sellers want to unwind 10-Year Treasury futures positions. Due to that, yields often spike when sellers outweigh buyers. As such, the more the blue line declines, the more it increases the chance of a taper-tantrum-like event.
To that point, with data from Goldman Sachs singing a similar tune, the lack of liquidity in the Treasury market is near crisis levels. As a result, the Fed’s hawkish disposition could spark a rapid rise in interest rates.
Please see below:
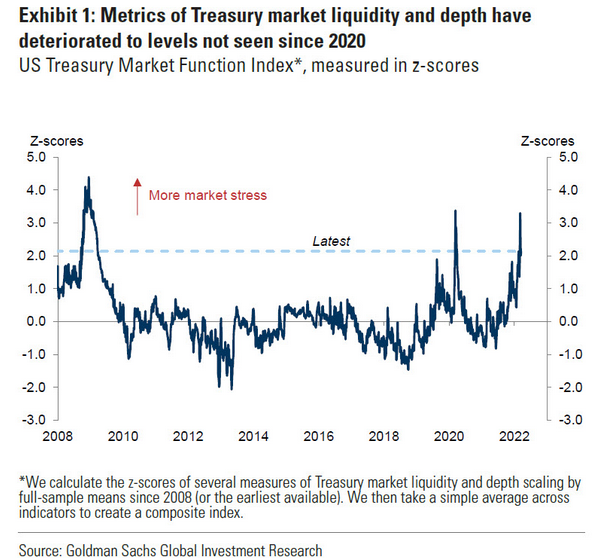
To explain, the blue line above tracks the z-score of Treasury market liquidity, or lack thereof. If you analyze the right side of the chart, you can see that the liquidity crunch is more than three standard deviations above its average. As a result, if large sell orders can’t find any bids, a rapid rise in U.S. Treasury yields could profoundly impact the PMs.
The bottom line? While the prices of silver and gold have ridden the momentum of the Russia-Ukraine conflict, their medium-term fundamentals are worse now than they were in 2021. Back then, the Fed parroted the “transitory” narrative, and the PMs could take solace in their dovish pushback. However, the inflation outlook has worsened in the last few months, and the commodities’ fervor is only accelerating the problem. Moreover, when doves like Kashkari turn hawkish, the game has changed. As a result, the PMs may learn this lesson the hard way over the medium term.
In conclusion, the PMs declined on Mar. 18, as bearish realities are starting to catch up with gold, silver, and mining stocks. However, war premiums are still embedded, and they haven’t priced in the implications of the Fed’s battle with inflation. As such, sharp slides should confront the PMs over the next few months as the Fed’s rate hike cycle starts to have its desired effect.
Overview of the Upcoming Part of the Decline
- It seems to me that the corrective upswing is now over or very close to being over , and that gold, silver, and mining stocks are now likely to continue their medium-term decline.
- It seems that the first (bigger) stop for gold will be close to its previous 2021 lows, slightly below $1,800 . Then it will likely correct a bit, but it’s unclear if I want to exit or reverse the current short position based on that – it depends on the number and the nature of the bullish indications that we get at that time.
- After the above-mentioned correction, we’re likely to see a powerful slide, perhaps close to the 2020 low ($1,450 - $1,500).
- If we see a situation where miners slide in a meaningful and volatile way while silver doesn’t (it just declines moderately), I plan to – once again – switch from short positions in miners to short positions in silver. At this time, it’s too early to say at what price levels this could take place, and if we get this kind of opportunity at all – perhaps with gold close to $1,600.
- I plan to exit all remaining short positions once gold shows substantial strength relative to the USD Index while the latter is still rallying. This may be the case with gold close to $1,350 - $1,400. I expect silver to fall the hardest in the final part of the move. This moment (when gold performs very strongly against the rallying USD and miners are strong relative to gold after its substantial decline) is likely to be the best entry point for long-term investments, in my view. This can also happen with gold close to $1,375, but at the moment it’s too early to say with certainty.
- As a confirmation for the above, I will use the (upcoming or perhaps we have already seen it?) top in the general stock market as the starting point for the three-month countdown. The reason is that after the 1929 top, gold miners declined for about three months after the general stock market started to slide. We also saw some confirmations of this theory based on the analogy to 2008. All in all, the precious metals sector is likely to bottom about three months after the general stock market tops.
- The above is based on the information available today, and it might change in the following days/weeks.
You will find my general overview of the outlook for gold on the chart below:
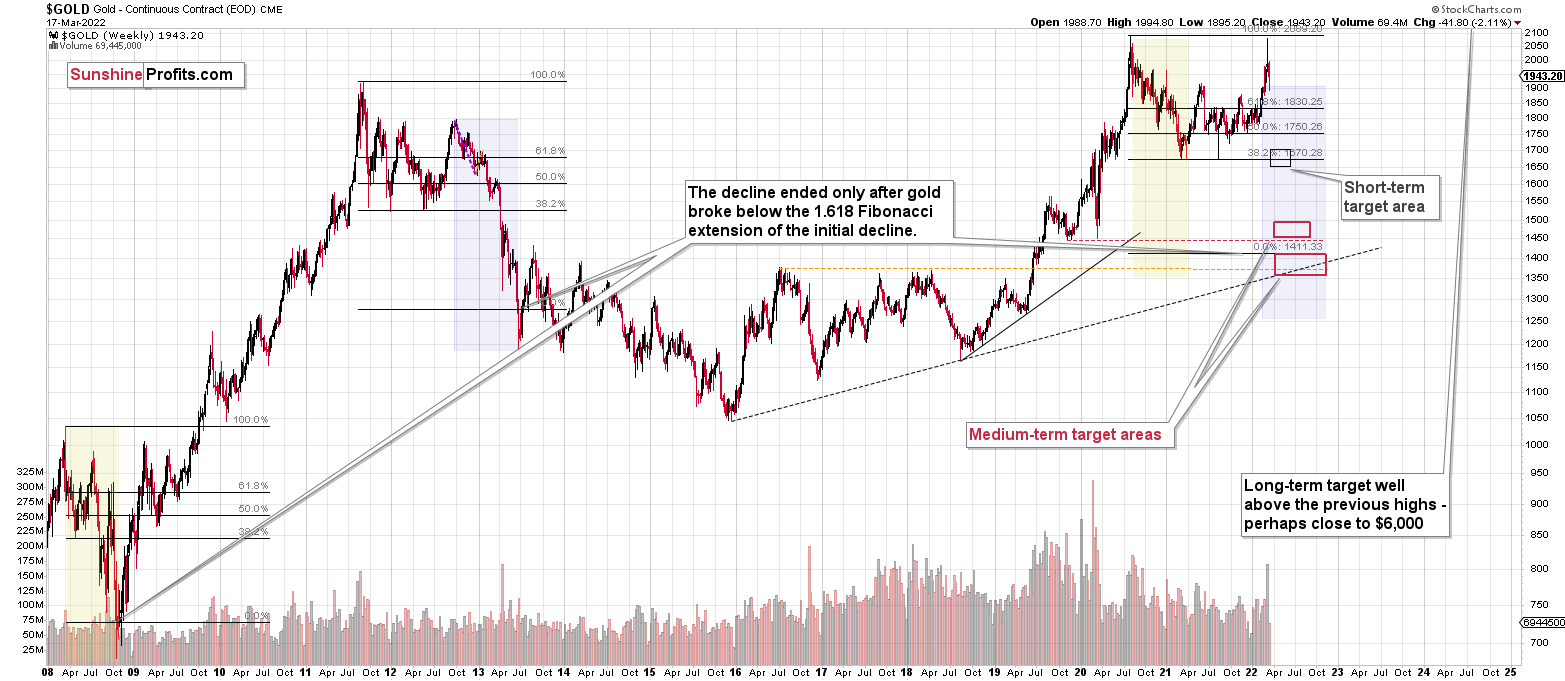
Please note that the above timing details are relatively broad and “for general overview only” – so that you know more or less what I think and how volatile I think the moves are likely to be – on an approximate basis. These time targets are not binding or clear enough for me to think that they should be used for purchasing options, warrants or similar instruments.
Summary
Summing up, despite the recent rally in gold, the outlook for junior mining stocks remains exactly as I described previously.
Crude oil’s extreme outperformance, the stock market’s weakness, and critical medium-term resistance levels reached by gold (all-time high!) and junior mining stocks, all indicate that the tops are at hand or have just formed. The huge-volume reversals in gold and (especially) mining stocks, along with silver’s short-term outperformance, all point to lower precious metals prices in the following days/weeks. It seems that the top is in.
Investing and trading are difficult. If it was easy, most people would be making money – and they’re not. Right now, it’s most difficult to ignore the urge to “run for cover” if you physically don’t have to. The markets move on “buy the rumor and sell the fact.” This repeats over and over again in many (all?) markets, and we have direct analogies to similar situations in gold itself. Junior miners are likely to decline the most, also based on the massive declines that are likely to take place (in fact, they have already started) in the stock markets.
From the medium-term point of view, the two key long-term factors remain the analogy to 2013 in gold and the broad head and shoulders pattern in the HUI Index. They both suggest much lower prices ahead.
It seems that our profits from short positions are going to become truly epic in the coming months.
After the sell-off (that takes gold to about $1,350-$1,500), I expect the precious metals to rally significantly. The final part of the decline might take as little as 1-5 weeks, so it's important to stay alert to any changes.
Most importantly, please stay healthy and safe. We made a lot of money last March and this March, and it seems that we’re about to make much more in the upcoming decline, but you have to be healthy to enjoy the results.
As always, we'll keep you - our subscribers - informed.
To summarize:
Trading capital (supplementary part of the portfolio; our opinion): Full speculative short positions (300% of the full position) in junior mining stocks are justified from the risk to reward point of view with the following binding exit profit-take price levels:
Mining stocks (price levels for the GDXJ ETF): binding profit-take exit price: $34.63; stop-loss: none (the volatility is too big to justify a stop-loss order in case of this particular trade)
Alternatively, if one seeks leverage, we’re providing the binding profit-take levels for the JDST (2x leveraged) and GDXD (3x leveraged – which is not suggested for most traders/investors due to the significant leverage). The binding profit-take level for the JDST: $14.98; stop-loss for the JDST: none (the volatility is too big to justify a SL order in case of this particular trade); binding profit-take level for the GDXD: $25.48; stop-loss for the GDXD: none (the volatility is too big to justify a SL order in case of this particular trade).
For-your-information targets (our opinion; we continue to think that mining stocks are the preferred way of taking advantage of the upcoming price move, but if for whatever reason one wants / has to use silver or gold for this trade, we are providing the details anyway.):
Silver futures downside profit-take exit price: $19.12
SLV profit-take exit price: $17.72
ZSL profit-take exit price: $38.28
Gold futures downside profit-take exit price: $1,683
HGD.TO – alternative (Canadian) inverse 2x leveraged gold stocks ETF – the upside profit-take exit price: $11.79
HZD.TO – alternative (Canadian) inverse 2x leveraged silver ETF – the upside profit-take exit price: $29.48
Long-term capital (core part of the portfolio; our opinion): No positions (in other words: cash
Insurance capital (core part of the portfolio; our opinion): Full position
Whether you already subscribed or not, we encourage you to find out how to make the most of our alerts and read our replies to the most common alert-and-gold-trading-related-questions.
Please note that we describe the situation for the day that the alert is posted in the trading section. In other words, if we are writing about a speculative position, it means that it is up-to-date on the day it was posted. We are also featuring the initial target prices to decide whether keeping a position on a given day is in tune with your approach (some moves are too small for medium-term traders, and some might appear too big for day-traders).
Additionally, you might want to read why our stop-loss orders are usually relatively far from the current price.
Please note that a full position doesn't mean using all of the capital for a given trade. You will find details on our thoughts on gold portfolio structuring in the Key Insights section on our website.
As a reminder - "initial target price" means exactly that - an "initial" one. It's not a price level at which we suggest closing positions. If this becomes the case (like it did in the previous trade), we will refer to these levels as levels of exit orders (exactly as we've done previously). Stop-loss levels, however, are naturally not "initial", but something that, in our opinion, might be entered as an order.
Since it is impossible to synchronize target prices and stop-loss levels for all the ETFs and ETNs with the main markets that we provide these levels for (gold, silver and mining stocks - the GDX ETF), the stop-loss levels and target prices for other ETNs and ETF (among other: UGL, GLL, AGQ, ZSL, NUGT, DUST, JNUG, JDST) are provided as supplementary, and not as "final". This means that if a stop-loss or a target level is reached for any of the "additional instruments" (GLL for instance), but not for the "main instrument" (gold in this case), we will view positions in both gold and GLL as still open and the stop-loss for GLL would have to be moved lower. On the other hand, if gold moves to a stop-loss level but GLL doesn't, then we will view both positions (in gold and GLL) as closed. In other words, since it's not possible to be 100% certain that each related instrument moves to a given level when the underlying instrument does, we can't provide levels that would be binding. The levels that we do provide are our best estimate of the levels that will correspond to the levels in the underlying assets, but it will be the underlying assets that one will need to focus on regarding the signs pointing to closing a given position or keeping it open. We might adjust the levels in the "additional instruments" without adjusting the levels in the "main instruments", which will simply mean that we have improved our estimation of these levels, not that we changed our outlook on the markets. We are already working on a tool that would update these levels daily for the most popular ETFs, ETNs and individual mining stocks.
Our preferred ways to invest in and to trade gold along with the reasoning can be found in the how to buy gold section. Furthermore, our preferred ETFs and ETNs can be found in our Gold & Silver ETF Ranking.
As a reminder, Gold & Silver Trading Alerts are posted before or on each trading day (we usually post them before the opening bell, but we don't promise doing that each day). If there's anything urgent, we will send you an additional small alert before posting the main one.
Thank you.
Przemyslaw Radomski, CFA
Founder, Editor-in-chief

