

Briefly: in our opinion, full (300% of the regular position size) speculative short positions in junior mining stocks are justified from the risk/reward point of view at the moment of publishing this Alert.
In short, yesterday, the situation in the precious metals market continued to develop almost exactly like in 2013. In yesterday’s analysis, I wrote about the specific link between what happened in early April 2013 and what happened very recently. Quoting my yesterday’s analysis:
Today, I would like to show you how the GDXJ (a proxy for junior mining stocks) is repeating its 2013 performance, and I want to emphasize just how bearish the implications are.
Here’s what the GDXJ did in 2013.
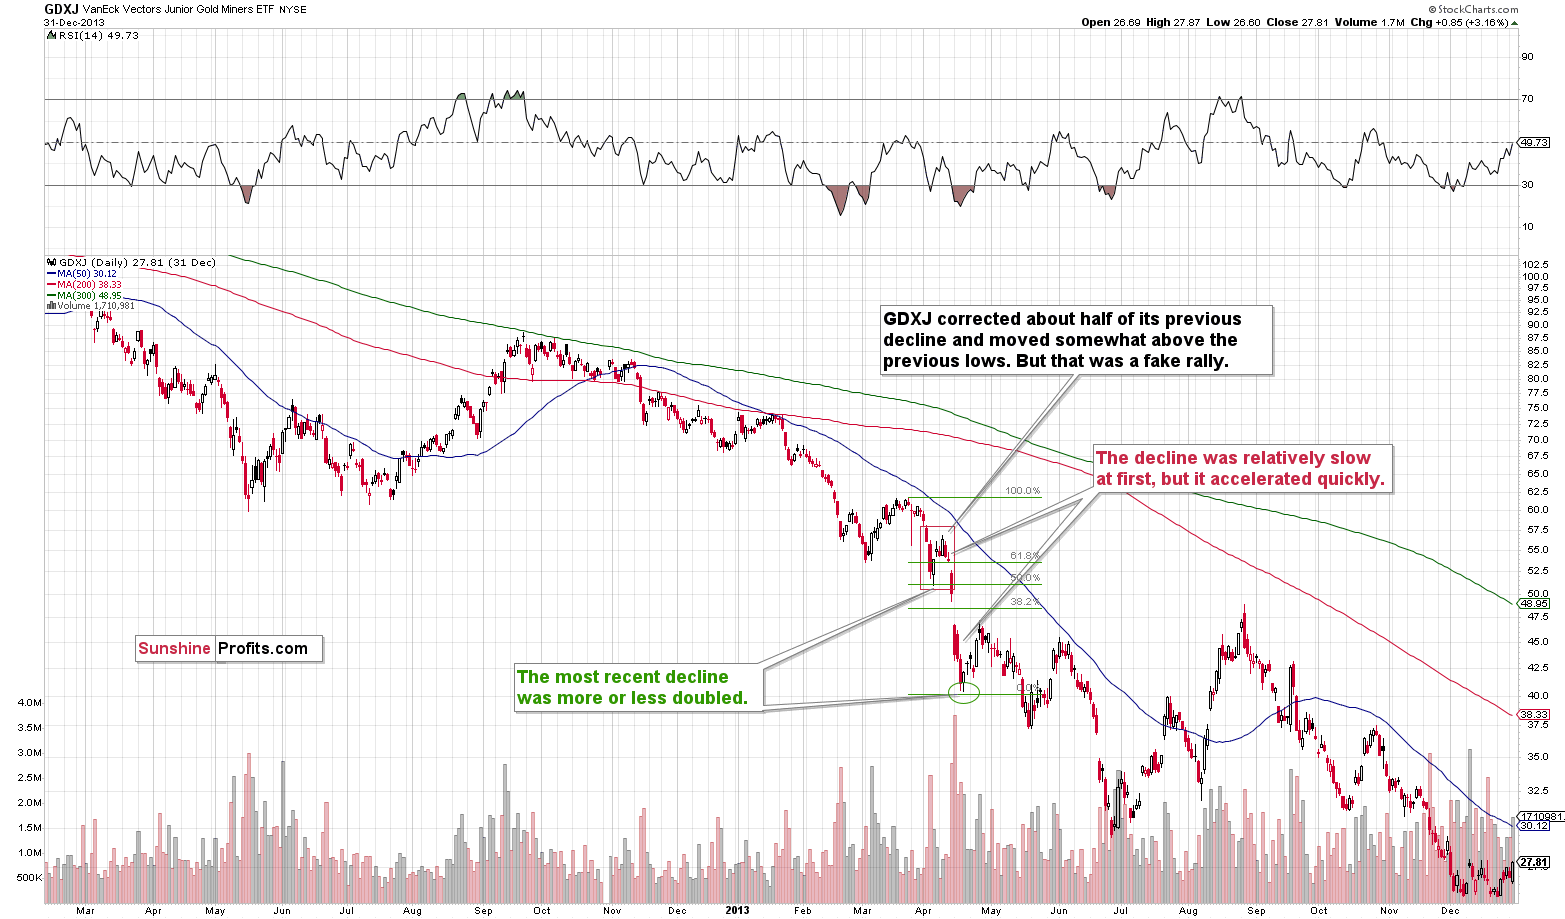
Right before the April 2013 plunge, the GDXJ corrected about half of the preceding short-term rally, and it moved above its most recent short-term low. This rally was relatively quick.
Then the decline started, but it was not huge at first. However, it took only a few days for the pace of the decline to pick up, and shortly after the GDXJ moved below its recent lows, it truly plunged. The slide was also huge in the rest of the precious metals sector.
The GDXJ declined in a major way, and it formed a short-term bottom once it doubled the initial decline. I marked this with the green Fibonacci extension tool. The initial decline is 50% of the entire decline (approximately), which means that the latter was twice as big.
What does this imply for the current situation?
First of all, it implies that the analogy to 2013 remains intact.
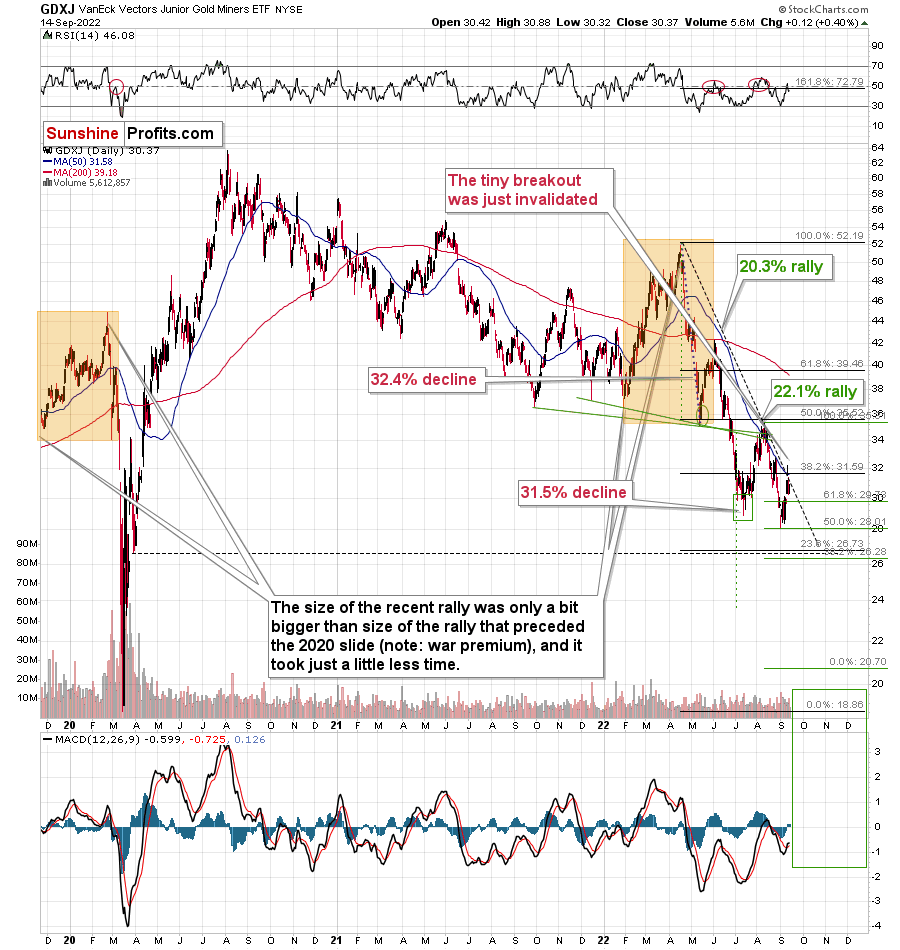
Second, it implies that – based on the size of the recent decline – the GDXJ is likely to decline until it moves below $22 or so. Given the proximity of the 2020 lows that are just below $20, and the fact that right now there are more factors that are happening outside of the precious metals market that favor lower junior miners’ (and gold) prices, I wouldn’t be surprised to see the GDXJ bottom close to its 2020 low (or even slightly below it), and not slightly above the green target provided by the doubling-the-previous-decline technique.
Those “other factors” are the soaring USD Index, declining stock market prices, and rising interest rates.
Besides, the above is very much in tune with what I’ve been writing about for months. I’ve been emphasizing that the return to the 2020 target (or lower, perhaps much lower) is likely for mining stocks. We even have the short-term confirmation of this scenario now.
Moreover, please note that yesterday’s almost 5% decline caused the tiny breakout above the declining, medium-term resistance line to be invalidated. Invalidations of breakouts are immediate sell signs.
The additional implication of the recent rally is that since it happened, it’s no longer likely that we will see a rebound from the ~$26-27 area. Why? Because we already saw one recently, and based on the analogy to 2013, what was likely to happen already happened. Sure, there are no certainties in any market, and there might indeed be a correction in this area, but it’s not likely, let alone very likely, that it’s going to take place.
All in all, it seems that the downtrend continues, and that it’s the final time to make sure one is prepared to take advantage of the upcoming big slide. Of course, I can’t promise any kind of performance or profitability, but in my opinion, it does seem likely that the next big move lower will be truly epic.
Based on the analogy, the GDXJ should have more or less paused yesterday. Back in April 2013, it declined just slightly, and yesterday it rallied slightly. Both moves were close to being flat, and this is why I view them as similar and the analogy to be very much intact, even in the case of very short-term details.
If the analogy continues, then we’re likely to see sizable declines within the next several days (of course, I’m not making any promises). So far, gold is down by about $9 in today’s pre-market trading, and it’s already trading below the $1,700 mark.
Also, please keep in mind that the stock market also invalidated a breakout.
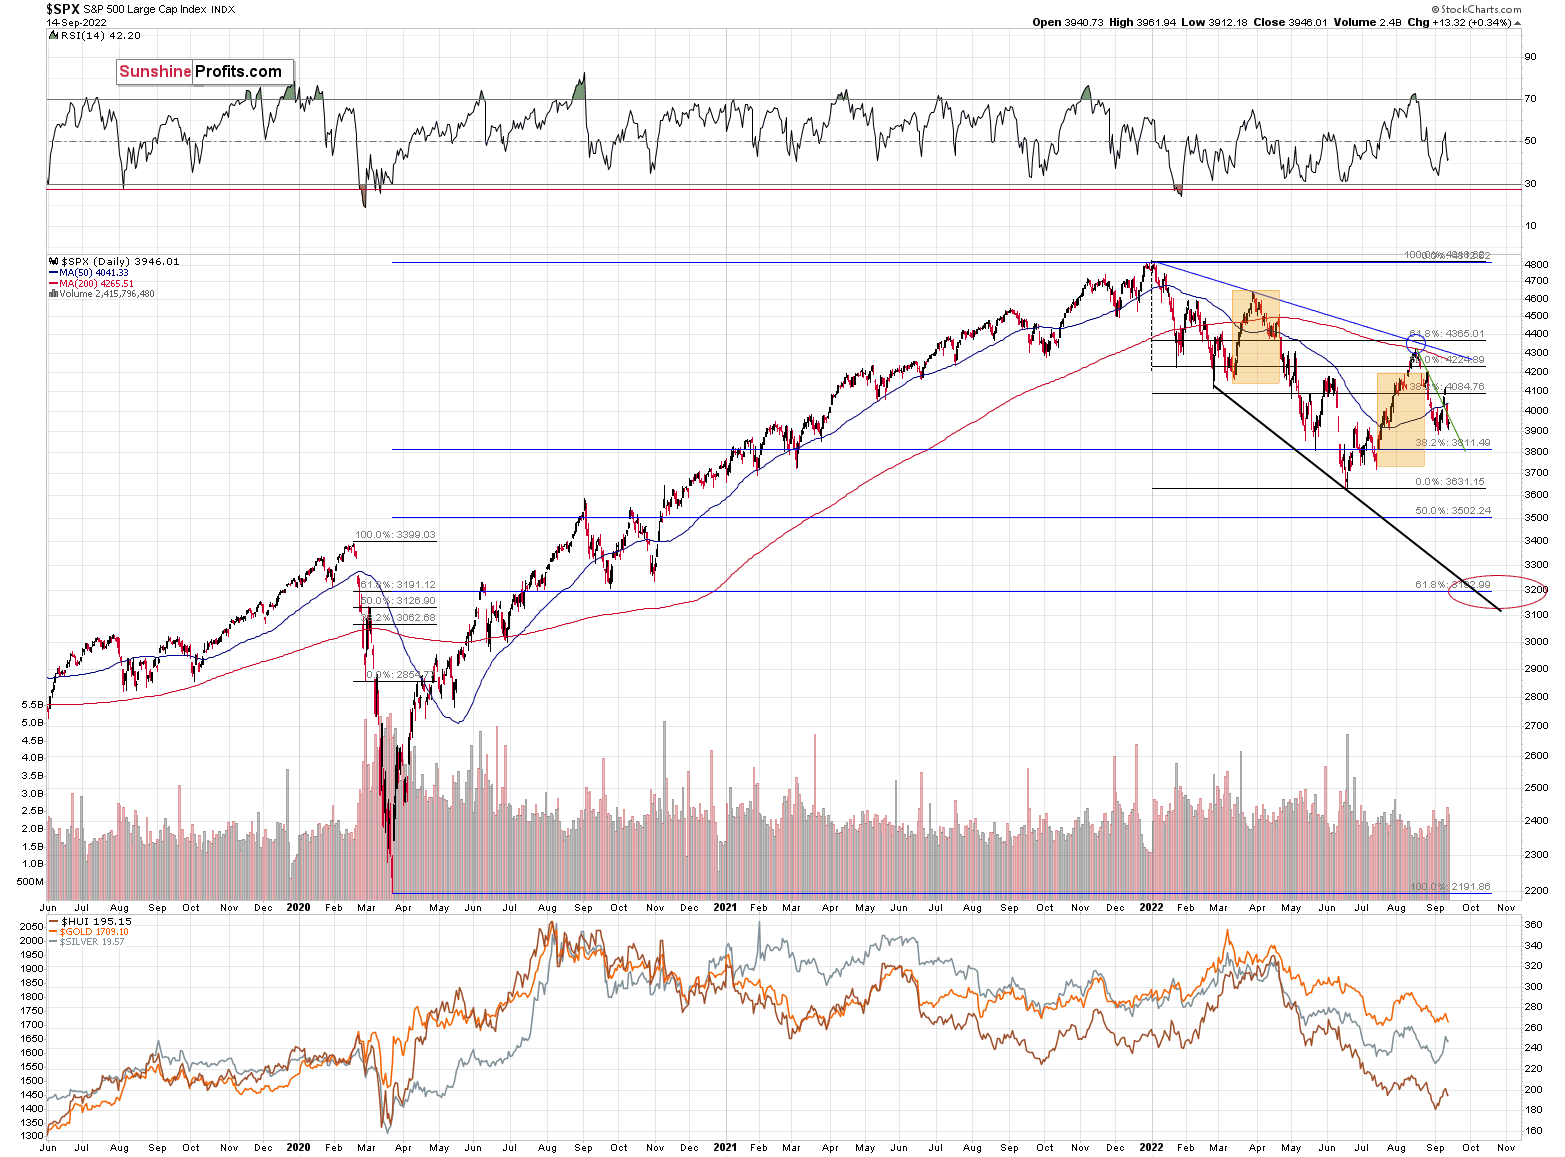
The S&P 500 plunged below its declining support/resistance line after moving above. This is a breakout’s invalidation, and it’s a sell signal. The implications are particularly bearish for junior mining stocks.
All in all, the outlook for the precious metals market remains very bearish.
Having said that, let’s take a look at the markets from a more fundamental point of view.
In Denial
With gold, silver, mining stocks and the S&P 500 attempting to recover from the Sep. 13 sell-off, the price action was relatively sleepy on Sep. 14. However, while many were spooked by the resiliency of the Consumer Price Index (CPI), the post-GFC crowds’ willingness to ‘buy the dip’ should has been its undoing.
For example, I’ve noted on numerous occasions that the consensus is more worried about missing a dovish pivot than suffering a major drawdown. As a result, they will panic buy on the slightest hope that the bull market can resume. In contrast, with unanchored inflation shifting the calculus, recency bias has clouded investors’ judgment. To explain, I wrote on May 25:
A decade of dovish pivots has left a generation of investors believing that the central bank is all talk and no action. However, with inflation at levels unseen in 40+ years, Powell is not out of ammunition, and the Fed pivot crowd should suffer profound disappointment as the drama unfolds.
The bottom line? We’ve officially entered the monetary version of The Boy Who Cried Wolf. With Fed officials running to the rescue each time the financial markets show signs of stress, investors are programmed to ignore their hawkish threats. However, while these post-GFC pivots occurred with inflation perched near 2%, investors are so steadfast in their belief that they ignore the climactic consequences of unanchored inflation.
To that point, with more of that behavior on display during the Sep. 13 rout, the lack of fear in the financial markets highlights why we’re likely far from a medium-term bottom.
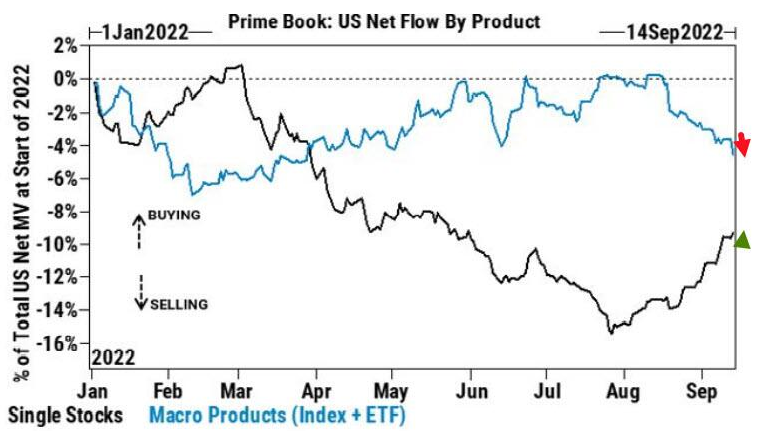
For example, Goldman Sachs Prime Brokerage data showed that while hedge funds were sellers of macro products (indexes and ETFs), they bought individual stocks. Furthermore, purchases of technology shares outnumbered sales 3.5 to 1, and tech has been net bought for 12 of the last 14 sessions.
Please see below:
 Source: Goldman Sachs
To explain, the blue line above tracks hedge funds’ activity in macro products, while the black line above tracks their activity in single stocks. If you analyze the divergence, you can see that the latter has remained uplifted over the last month and a half.
Furthermore, with the liquidity beneficiaries (tech stocks) catching a bid, hedge funds still believe in the Fed’s ability to orchestrate a soft landing.
Please see below:
 Source: Goldman Sachs
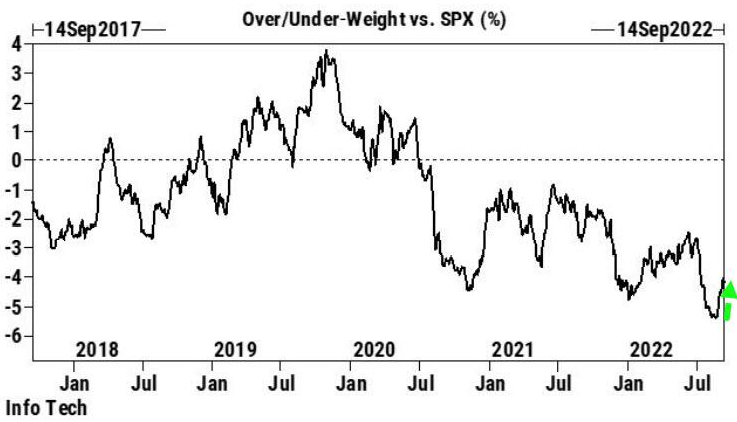
To explain, the black line above tracks hedge funds’ overweight/underweight of the technology sector relative to the S&P 500. If you analyze the right side of the chart, you can see that the black line has bounced off of its recent low, which implies that hedge funds are less bearish on the sector (though still underweight). As such, the sharp sell-off on Sep. 13 was nowhere near a capitulation.
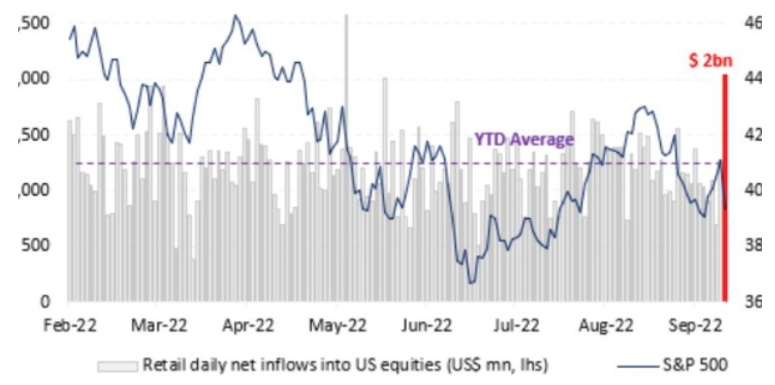
As further evidence, hedge funds weren’t the only ones eager to buy the dip. Data from Vanda Research shows that retail investors poured more than $2 billion into the market on Sep. 13, the second-largest daily net inflow in 2022.
Please see below:
 Source: Vanda Research
To explain, the blue line above tracks the S&P 500, while the purple and red bars above track retail investors’ net inflows into U.S. equities. If you analyze the right side of the chart, you can see that the crowd went all in. Likewise, the $395 million that flowed into the SPY ETF was the largest one-day splurge since July 2021. As a result, no one fears inflation or the Fed.
However, Vanda Research analysts led by Marco Iachini noted how retail investors’ overconfidence may come back to bite them.
“Multiple capitulation indicators are now flashing a warning sign,” they wrote. “That means the likelihood of retail capitulation increases significantly near term should equities re-test this year’s June lows.”
Thus, with hedge funds and retail investors unconcerned about the troublesome fundamental backdrop, U.S. households are mirroring their complacency.
Please see below:
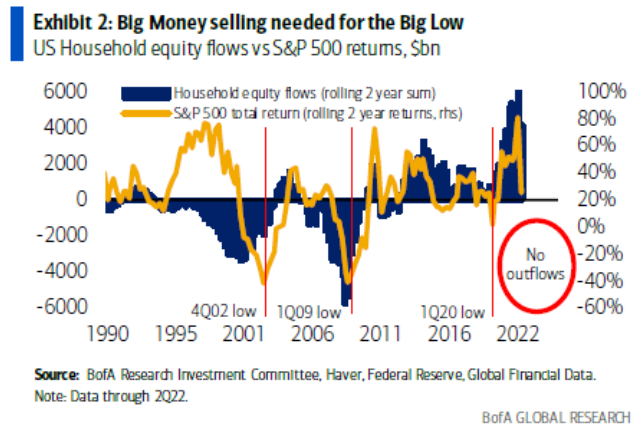
To explain, the gold line above tracks the S&P 500’s two-year rolling return, while the dark blue bars above track U.S. households’ rolling two-year equity flows. If you analyze the relationship, you can see that S&P 500 bottoms in 2002 and 2009 occurred after U.S. households rushed for the exits.
In contrast, the blue bars on the right side of the chart show how U.S. households are buying stocks, not selling them. Therefore, the post-GFC playbook has programmed investors to believe that the Fed can cure all economic ills.
Furthermore, while the 1970s/1980s recessions provided clear evidence of the destructive nature of inflation, the crowd has more faith in the Fed than in historical precedent or economic reality. However, the pivot proponents should suffer mightily as their soft landing hopes are derailed by inflation.
Speaking of which, I’ve been warning since 2021 that investors materially underestimate the inflation fight that confronts the Fed. Moreover, while consensus expectations continue to move in a hawkish direction, the medium-term economic ramifications are far from priced in.
Please see below:
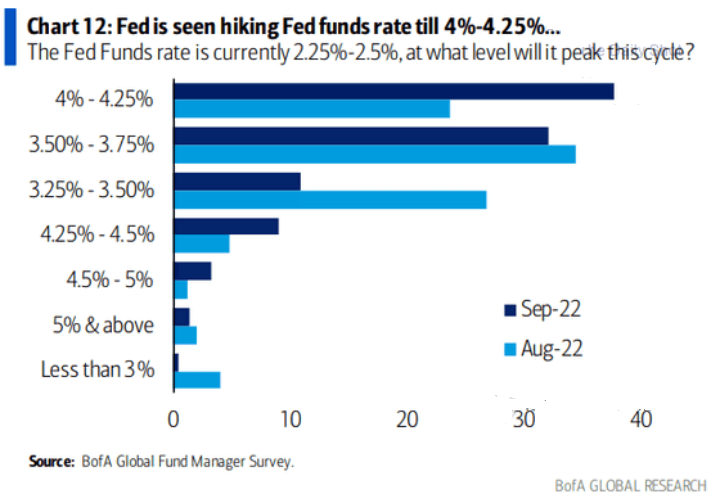
To explain, Bank of America’s latest Global Fund Manager Survey shows that most respondents expected the U.S. federal funds rate (FFR) to peak between 3.25% and 3.75% in August (the light blue bars). Conversely, September’s results show that the top spot is now in the 4% to 4.25% range (the dark blue bar).
As a result, what a difference a month makes. Yet, while rate hike expectations have moved materially higher, notice how the 4.5% to 5% and the 5% and above rows are in the major minority. In reality, these are the most likely outcomes. With an FFR in the 4.5% to 5.5% range needed to cool inflation, investors still underestimate the task at hand.
In addition, since it didn’t take long for the ~3.5% camp to jump to 4%+, don’t be surprised if these expectations ratchet higher in the months ahead.
The Real Deal
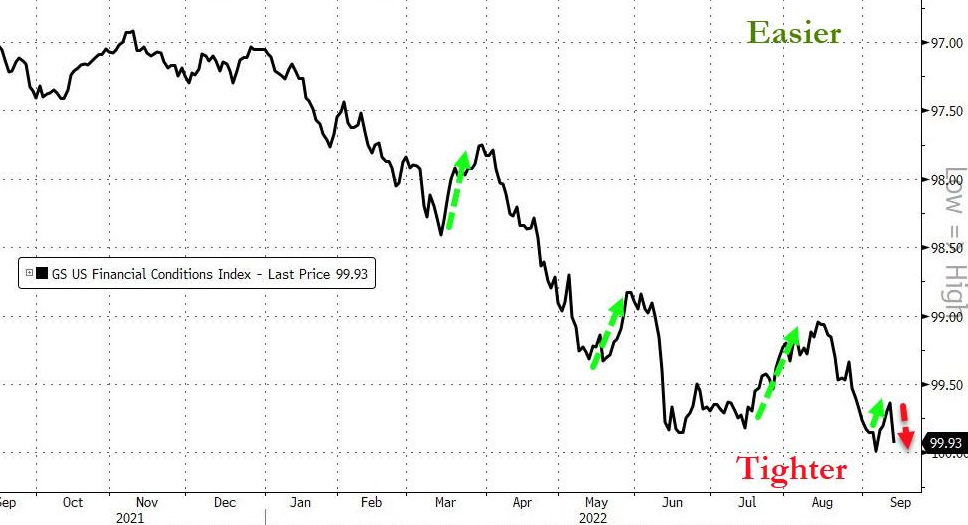
While the financial markets are eager to ignore the dilemma, Goldman Sachs’ Financial Conditions Index (FCI) continues to make higher highs and higher lows. For context, the chart below is inverted, which means that a lower black line results in tighter financial conditions.
Please see below:
 Source: Bloomberg/ZeroHedge
To explain, the Fed needs a lower black line to reduce inflation. Moreover, while tighter financial conditions are bearish for growth and risk assets, the post-GFC crowd assumes that once inflation dies, all of this will reverse and the bull market can resume. Therefore, not selling is the consensus strategy to front-run a dovish pivot.
However, the gambit is unrealistic because this mindset will prolong inflation. As long as investors brace for a dovish pivot, their bullish expectations will keep the Fed from achieving its goal. As such, continued denial will only make the Fed's job harder and result in a higher FFR over the medium term.
Likewise, investors' unwillingness to let the S&P 500 fall substantially is another reason why the Fed will need to work overtime to tame inflation.
Please see below:
 Source: Bloomberg/ZeroHedge
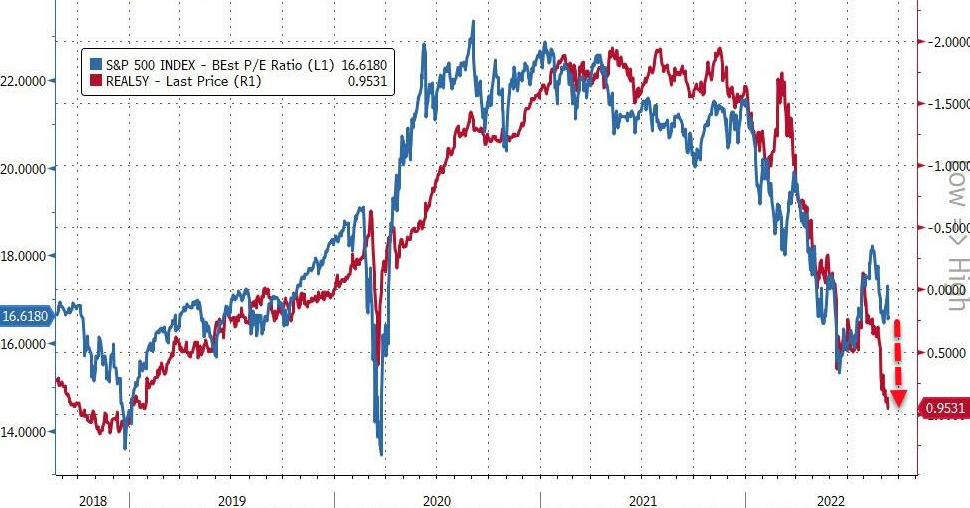
To explain, the blue line above tracks the S&P 500's forward price-to-earnings (P/E) ratio, while the red line above tracks the inverted (down means up) U.S. 5-Year real yield. If you analyze the gap on the right side of the chart, you can see that a higher U.S. 5-Year real yield has not been able to reduce the S&P 500's forward P/E recently.
However, this will only hurt investors in the long run. If asset prices decline sharply, the flow-through of lower commodity prices will assist in the Fed's inflation flight. However, with the financial markets unwilling to help, the Fed has to do the heavy lifting and push real yields even higher to achieve the desired results.
Overall, the Fed has a serious problem because the post-GFC crowd has been trained to hold and wait for the central bank's rescue. However, now, a sell-off would make the Fed's job easier. Yet, the Fed has created a monster, and the consensus mindset makes the central bank's job much harder. As a result, inflation should remain problematic and the FFR should continue its ascent until the financial markets reach a breaking point.
The Bottom Line
The dip buyers were out in full force as old habits die hard. However, despite their enthusiasm, only a little progress has been made on inflation. Moreover, the core CPI continues to increase even though the metric is least affected by supply-chain disruptions. Furthermore, prior Fed committees had to push the FFR above or within ~50 basis points of the peak headline CPI to curb inflation. Yet, is this time different? Either way, market participants drastically underestimate the challenges that lie ahead.
In conclusion, the PMs were mixed on Sep. 14, as gold ended the day in the red. However, while I’ve warned repeatedly that the bulls will likely buy the dip until the very end, a strong USD Index and higher real yields are profoundly bearish for financial assets. In addition, the sharp ascents of both have only reduced inflation by a small amount. As such, higher highs for the pair should be on the horizon, and gold, silver, mining stocks, and the S&P 500 should head in the opposite direction.
Overview of the Upcoming Part of the Decline
- It seems to me that the corrective upswing is over, and that the next big move lower is already underway. We’re probably seeing the final small corrective upswing right now.
- If we see a situation where miners slide in a meaningful and volatile way while silver doesn’t (it just declines moderately), I plan to – once again – switch from short positions in miners to short positions in silver. At this time, it’s too early to say at what price levels this could take place and if we get this kind of opportunity at all – perhaps with gold prices close to $1,600.
- I plan to exit all remaining short positions once gold shows substantial strength relative to the USD Index while the latter is still rallying. This may be the case with gold prices close to $1,400. I expect silver to fall the hardest in the final part of the move. This moment (when gold performs very strongly against the rallying USD and miners are strong relative to gold after its substantial decline) is likely to be the best entry point for long-term investments, in my view. This can also happen with gold close to $1,400, but at the moment it’s too early to say with certainty.
- The above is based on the information available today, and it might change in the following days/weeks.
You will find my general overview of the outlook for gold on the chart below:
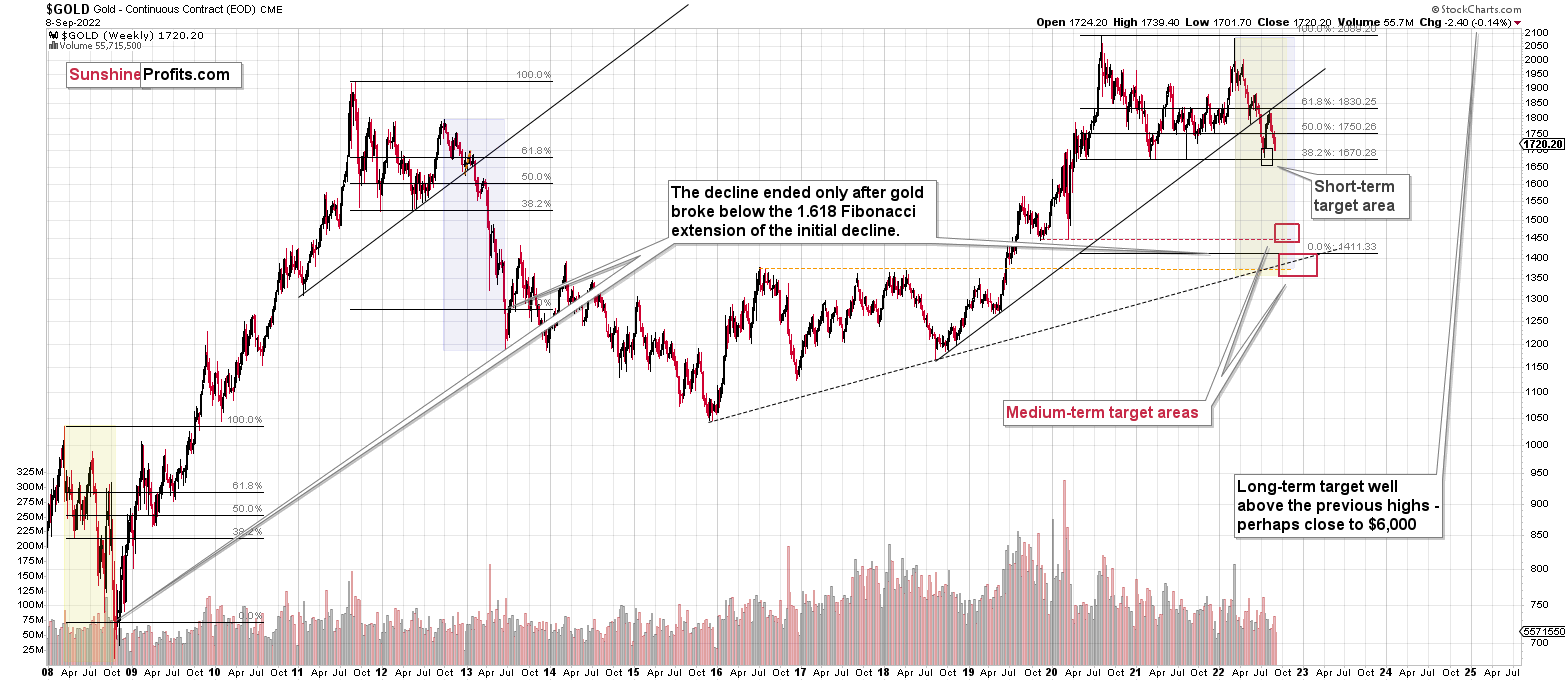
Please note that the above timing details are relatively broad and “for general overview only” – so that you know more or less what I think and how volatile I think the moves are likely to be – on an approximate basis. These time targets are not binding nor clear enough for me to think that they should be used for purchasing options, warrants, or similar instruments.
Letters to the… Author
(The letters are ultimately not to the editorial team but to the Author, so I figured that it makes more sense to name the section this way.)
Q: Thanks for your great service and daily updates. They are a source of stability when the market is not heading in the right direction. The longer I use your service, the more unemotional I have become - a trait I am trying to develop while active in today’s markets! Prem - I received this advertisement flyer - for the so-called 'Gold Miners Bullish % Index' (BPGDM). See attachment.
Have you heard of this indicator? I’d love to hear your thoughts on this.
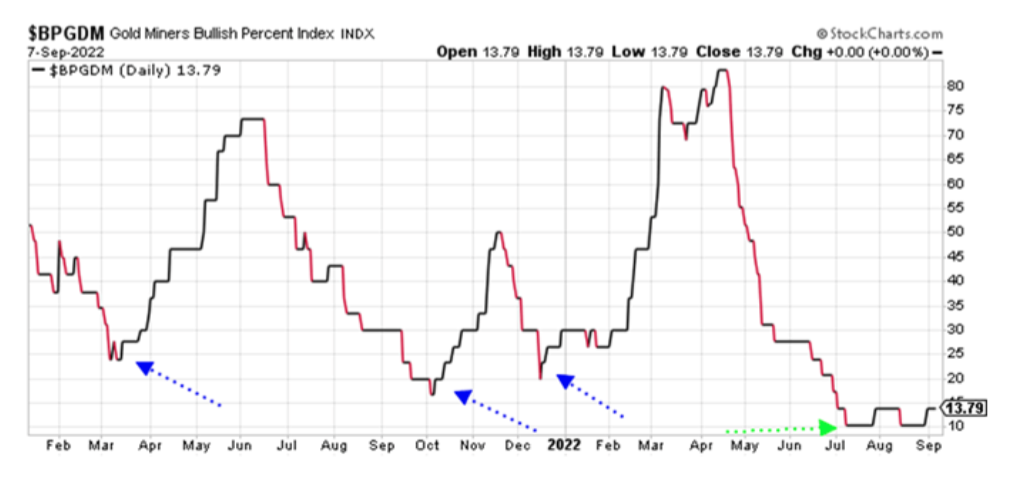
I’m attaching the key chart from the attachment below.
A: Thank you for your kind words. I particularly appreciate the fact that our work helps you grow as an investor. If this translates into an overall improved ability to handle stress or other benefits, then I’m extremely happy. I just want to stress that I’m not against emotions per se - emotions are very important when… well, enjoying and living life. The goal is not the absence of emotions but rather mastery of emotions (that’s the true message of Stoicism) - so that you have emotions instead of “emotions having you.”
Moving to the Gold Miners’ Bullish Percent Index, yes: I’m familiar with this indicator, we even have it explained in our “Dictionary” section.
The author of the chart shows some recent “buy points”, but they don’t really explain what made those “buy points” in the first place. Was it the fact that the index was below 30 and started rising? Or anything else? Either way, the history shown on the chart is only recent history, and it seems - as you know - that we’re seeing a repeat of the 2013 pattern that’s also somewhat similar to 2008.
Therefore, it is not the short-term analogy that really matters, but the long-term one.
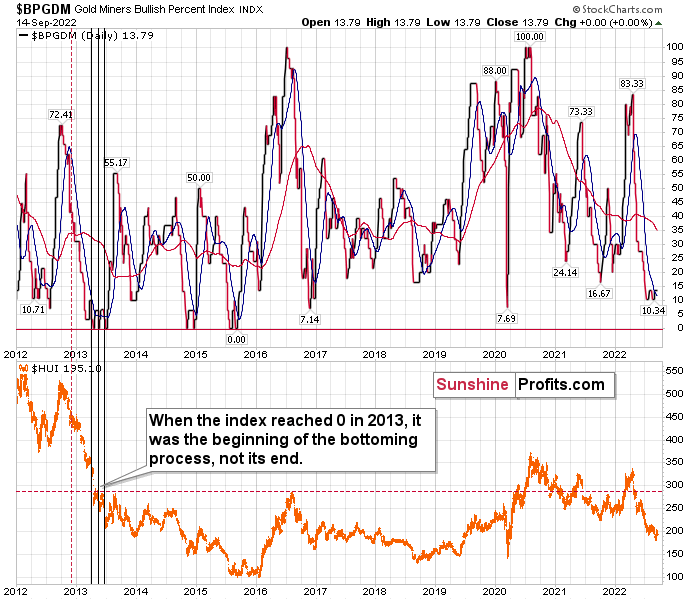
Based on the long-term analogy to 2013, we’re still before seeing the initial “bottom is near” signal. You see, in the case of huge declines, the prices don’t just get oversold. They get ridiculously oversold, and it rallies only after that.
Back in 2013, when the Gold Miners Bullish Percent Index declined to 0, it was only the initial bottom, not the final one.
If the mining stocks decline to their 2020 lows or so, then the Gold Miners Bullish Percent Index is likely to reach 0, thus indicating that the initial bottom is going to be in. It won’t necessarily mean that the final bottom is in, though. So, all in all, in the current market environment, I wouldn’t trust the “buy signal” that was featured on the chart.
Q: I wanted to get your input on what your levels for platinum and copper were during the gold collapse towards 1500. Thanks!
A: As far as copper is concerned, I wouldn’t rule out a move to $2.0-2.4 – you will find details and a chart in Friday’s analysis. As for platinum, I’d look for the bottom in the $570-630 range – relatively close to platinum’s 2020 low.
Summary
Summing up, it seems that the corrective upswing is over or is about to be over, which means that the powerful medium-term downtrend can resume any day now – the current corrective upswing simply appears to be of a very short-term nature. And based on the analogy to 2013, it seems that the next wave down might be really spectacular.
You have been profiting from how this situation develops practically throughout the entire year, and the above indicates (I’m not making any guarantees, of course) that the biggest gains are likely just ahead.
After the final sell-off (that takes gold to about $1,350-$1,500), I expect the precious metals to rally significantly. The final part of the decline might take as little as 1-5 weeks, so it's important to stay alert to any changes.
As always, we'll keep you – our subscribers – informed.
To summarize:
Trading capital (supplementary part of the portfolio; our opinion): Full speculative short positions (300% of the full position) in junior mining stocks are justified from the risk to reward point of view with the following binding exit profit-take price levels:
Mining stocks (price levels for the GDXJ ETF): binding profit-take exit price: $20.32; stop-loss: none (the volatility is too big to justify a stop-loss order in case of this particular trade)
Alternatively, if one seeks leverage, we’re providing the binding profit-take levels for the JDST (2x leveraged). The binding profit-take level for the JDST: $29.87; stop-loss for the JDST: none (the volatility is too big to justify a SL order in case of this particular trade).
For-your-information targets (our opinion; we continue to think that mining stocks are the preferred way of taking advantage of the upcoming price move, but if for whatever reason one wants / has to use silver or gold for this trade, we are providing the details anyway.):
Silver futures downside profit-take exit price: $12.32
SLV profit-take exit price: $11.32
ZSL profit-take exit price: $79.87
Gold futures downside profit-take exit price: $1,504
HGD.TO – alternative (Canadian) 2x inverse leveraged gold stocks ETF – the upside profit-take exit price: $19.87
HZD.TO – alternative (Canadian) 2x inverse leveraged silver ETF – the upside profit-take exit price: $49.87
Long-term capital (core part of the portfolio; our opinion): No positions (in other words: cash)
Insurance capital (core part of the portfolio; our opinion): Full position
Whether you’ve already subscribed or not, we encourage you to find out how to make the most of our alerts and read our replies to the most common alert-and-gold-trading-related-questions.
Please note that we describe the situation for the day that the alert is posted in the trading section. In other words, if we are writing about a speculative position, it means that it is up-to-date on the day it was posted. We are also featuring the initial target prices to decide whether keeping a position on a given day is in tune with your approach (some moves are too small for medium-term traders, and some might appear too big for day-traders).
Additionally, you might want to read why our stop-loss orders are usually relatively far from the current price.
Please note that a full position doesn't mean using all of the capital for a given trade. You will find details on our thoughts on gold portfolio structuring in the Key Insights section on our website.
As a reminder - "initial target price" means exactly that - an "initial" one. It's not a price level at which we suggest closing positions. If this becomes the case (as it did in the previous trade), we will refer to these levels as levels of exit orders (exactly as we've done previously). Stop-loss levels, however, are naturally not "initial", but something that, in our opinion, might be entered as an order.
Since it is impossible to synchronize target prices and stop-loss levels for all the ETFs and ETNs with the main markets that we provide these levels for (gold, silver and mining stocks - the GDX ETF), the stop-loss levels and target prices for other ETNs and ETF (among other: UGL, GLL, AGQ, ZSL, NUGT, DUST, JNUG, JDST) are provided as supplementary, and not as "final". This means that if a stop-loss or a target level is reached for any of the "additional instruments" (GLL for instance), but not for the "main instrument" (gold in this case), we will view positions in both gold and GLL as still open and the stop-loss for GLL would have to be moved lower. On the other hand, if gold moves to a stop-loss level but GLL doesn't, then we will view both positions (in gold and GLL) as closed. In other words, since it's not possible to be 100% certain that each related instrument moves to a given level when the underlying instrument does, we can't provide levels that would be binding. The levels that we do provide are our best estimate of the levels that will correspond to the levels in the underlying assets, but it will be the underlying assets that one will need to focus on regarding the signs pointing to closing a given position or keeping it open. We might adjust the levels in the "additional instruments" without adjusting the levels in the "main instruments", which will simply mean that we have improved our estimation of these levels, not that we changed our outlook on the markets. We are already working on a tool that would update these levels daily for the most popular ETFs, ETNs and individual mining stocks.
Our preferred ways to invest in and to trade gold along with the reasoning can be found in the how to buy gold section. Furthermore, our preferred ETFs and ETNs can be found in our Gold & Silver ETF Ranking.
As a reminder, Gold & Silver Trading Alerts are posted before or on each trading day (we usually post them before the opening bell, but we don't promise doing that each day). If there's anything urgent, we will send you an additional small alert before posting the main one.
Thank you.
Przemyslaw Radomski, CFA
Founder, Editor-in-chief

