

Briefly: Short positions (150% of the full position) in gold, silver and mining stocks are justified from the risk/reward perspective.
The HUI Index plunged yesterday, declining over 20 index points and it broke below both 2014 highs and not only the August lows, but also the July lows. All these breakdowns were confirmed closing prices and by very high volume. Is this decline still just a correction?
Most likely it’s not just a correction, but an early part of and big decline. Can you recall a time, when mining stocks were underperforming and declining almost on their own for weeks just like what we see right now?
There was one time, when such signals were in place. Let’s take a closer look (charts courtesy of http://stockcharts.com).
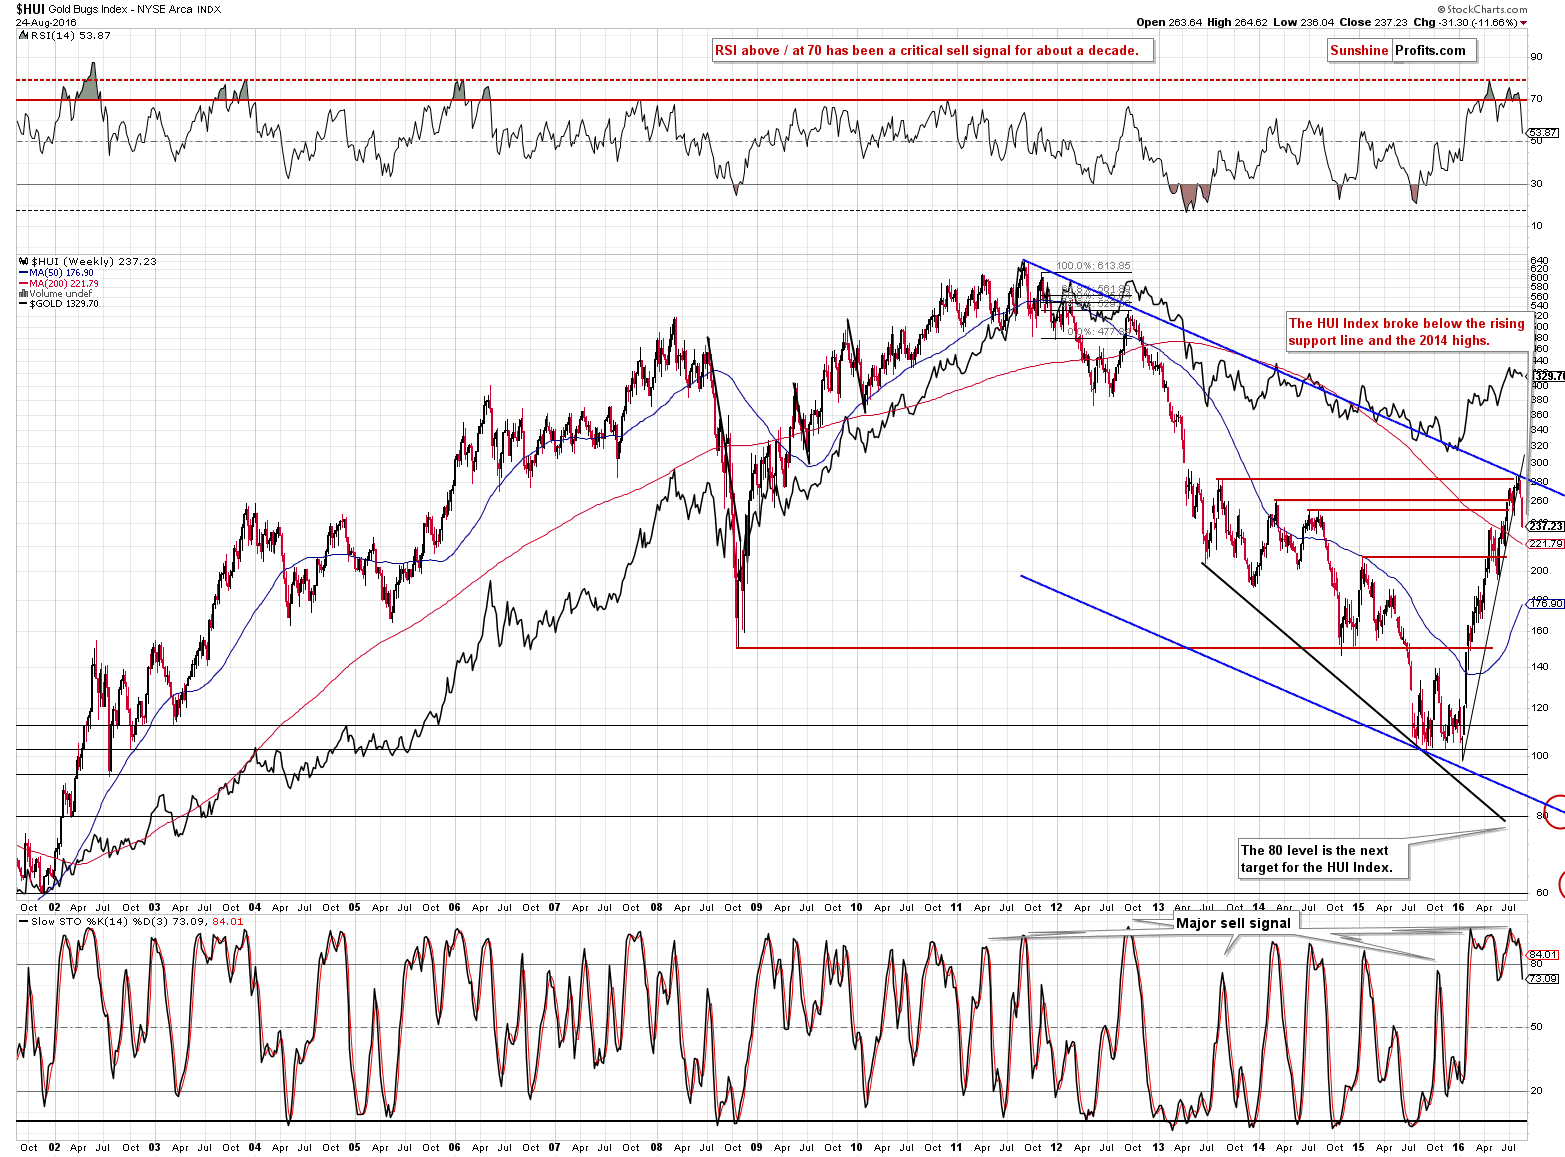
That’s what happened in early 2013. Gold was still moving sideways after a rather slow decline and gold stocks were already sliding. What happened after that? Miners continued to slide and gold followed. Gold declined hundreds of dollars within a few months and the HUI Index lost more than 200 index points.
The sell signal from the weekly Stochastic indicator remains in place and almost all of these signals were followed by significant declines.
What about the short-term picture?
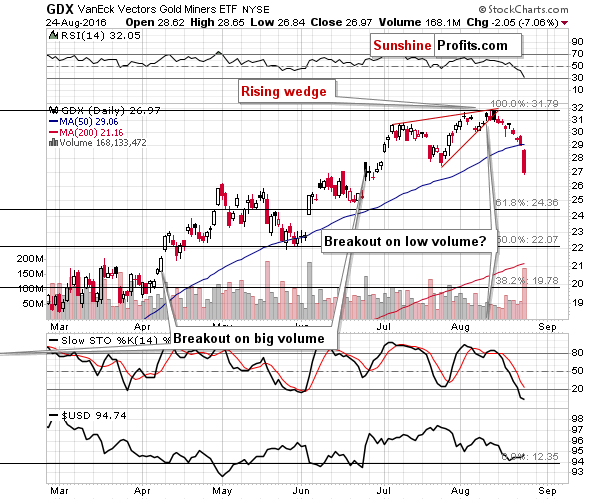
It’s bearish as well. The GDX ETF moved over 7% lower on huge volume, and the size of volume serves as a bearish confirmation. Moreover, please note that there was no comeback before the session was over, so the decline may not be over even on a very short-term basis.
On the other hand, the RSI indicator moved very close to the 30 level, which could attract some buyers here. Still, even if it does, it doesn’t seem likely that we would see a sizable rally given all the bearish signals that are in place – some sideways movement seems more probable.
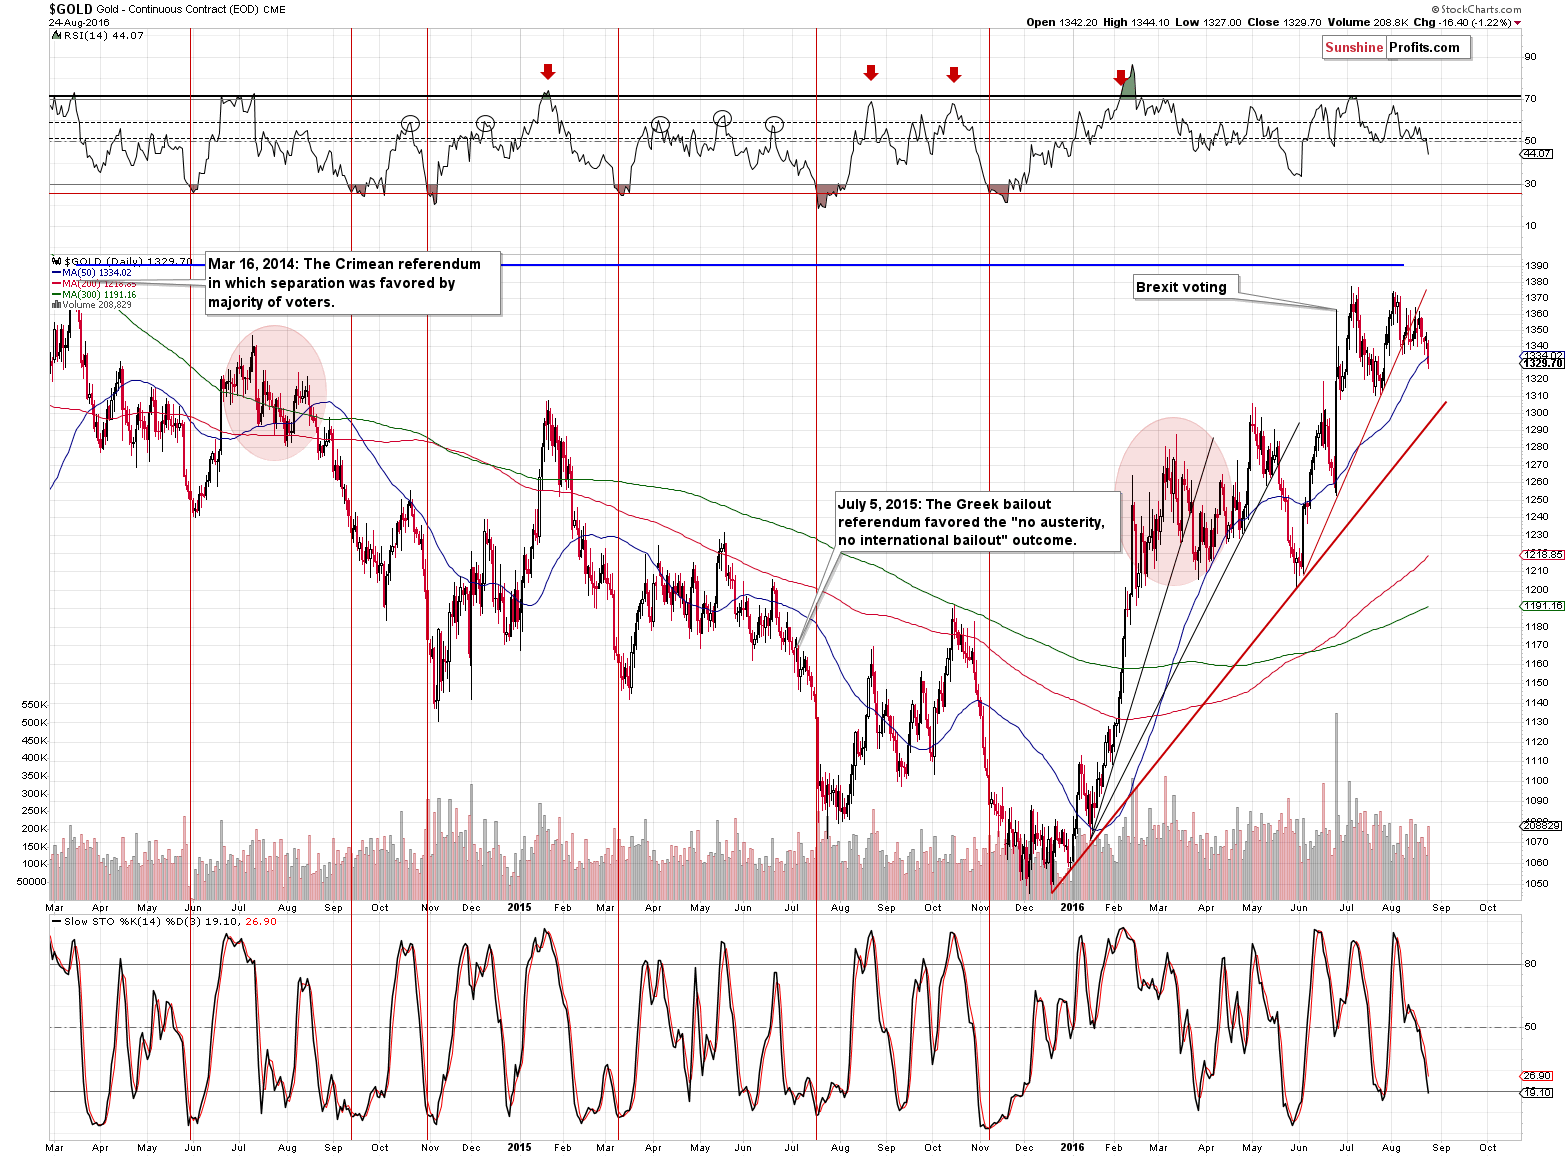
Gold declined on sizable volume as well and broke below the previous August lows. Gold didn’t break below the July lows yet, but that’s just yet another confirmation of miners’ underperformance, which is bearish.
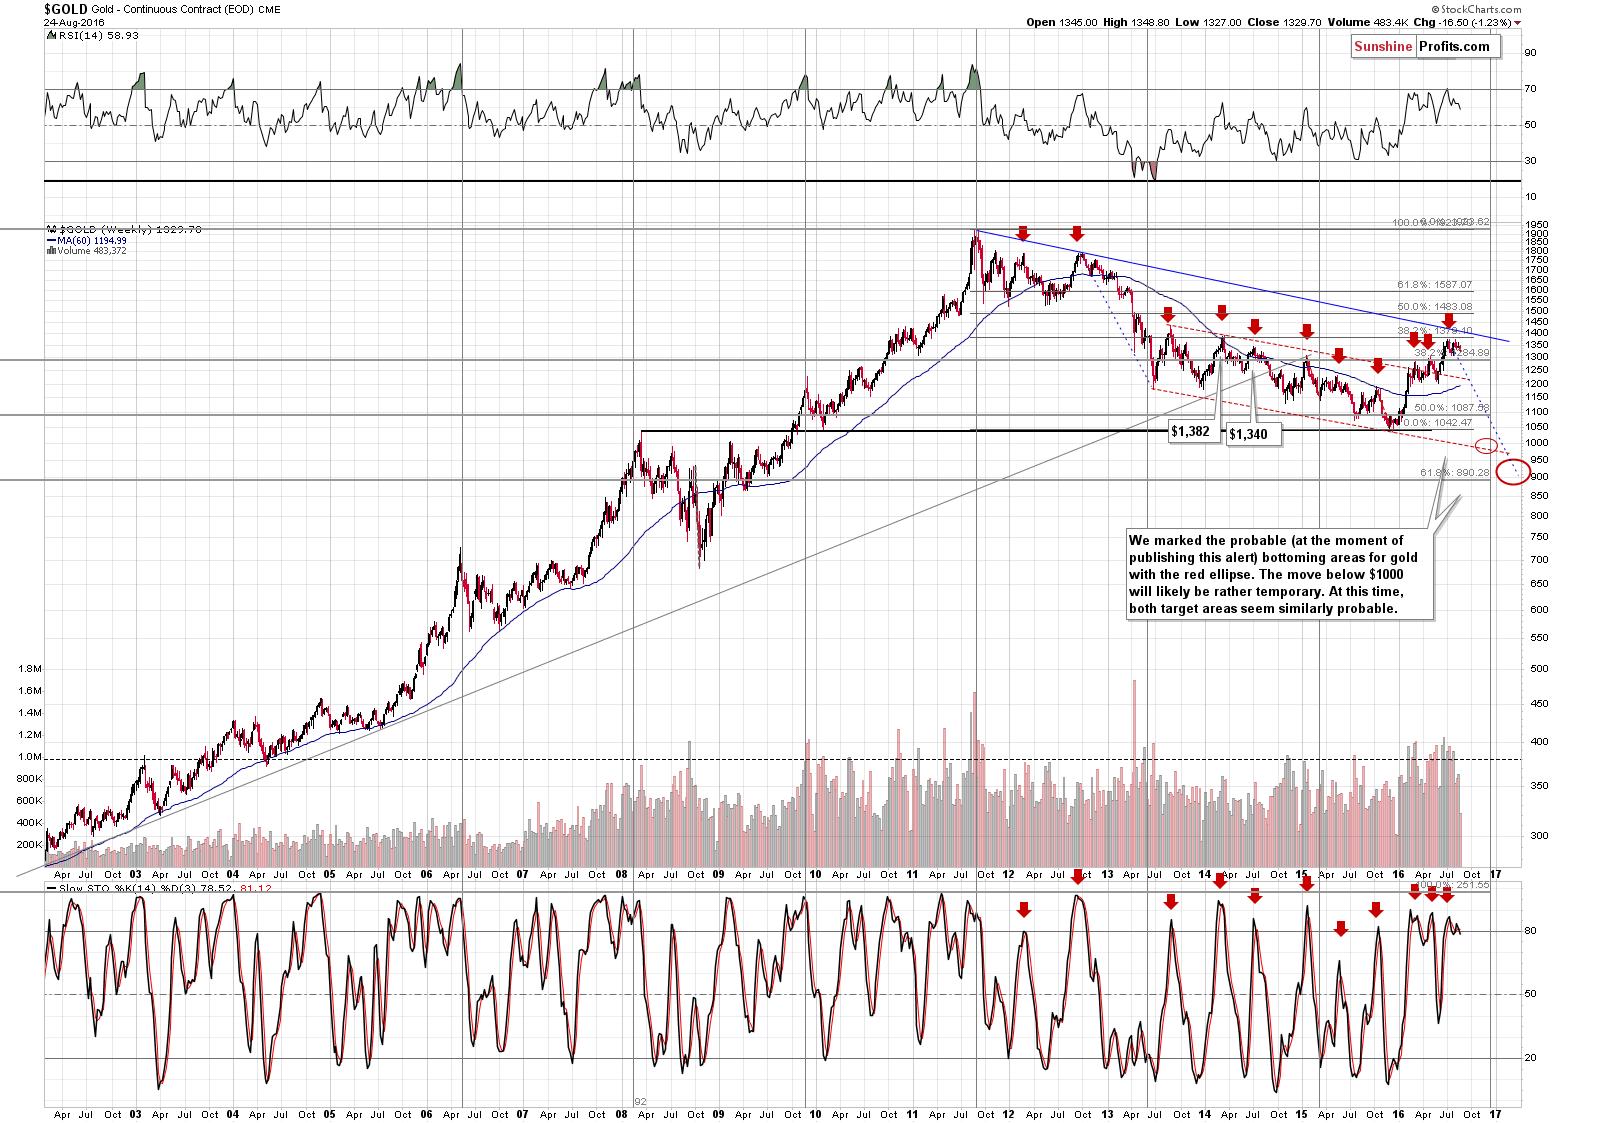
On the long-term chart, we can see that gold is already $16 lower this week and that the sell signal from the weekly Stochastic indicator remains in place.
Moreover, since we were asked about it, we would like to point out that the declining long-term resistance line is currently at about $1,425 (or $1,450 when based on weekly closing prices), so it’s something that is not likely to come into play anytime soon. If one based the analysis on a long-term gold chart in a linear scale, they would get a lower number, but using such scale is justified main in case of short-term patterns and a line that is about 5 years long, is not a short-term development. Consequently, the logarithmic scale should be used and in this case, we have the above-mentioned resistance about $100 higher than gold closed yesterday.
We were also asked if the current time of the year has meaningful bullish implications for the precious metals market (metals being traditionally strong in August and September). Our answer is “no”. It is not meaningfully bullish, because we have multiple bearish factors in place. Seasonality is most likely to impact markets in case there are no other strong signals in play and this is not the case at this time. Gold’s performance in August so far (about a $30 decline) despite positive seasonal tendencies serves as a great example. Gold stocks' major underperformance of gold has much more important implications than seasonals and that’s just one of the bearish factors that are currently in play.
Let’s take a look at silver – the metal that didn’t decline much yesterday.
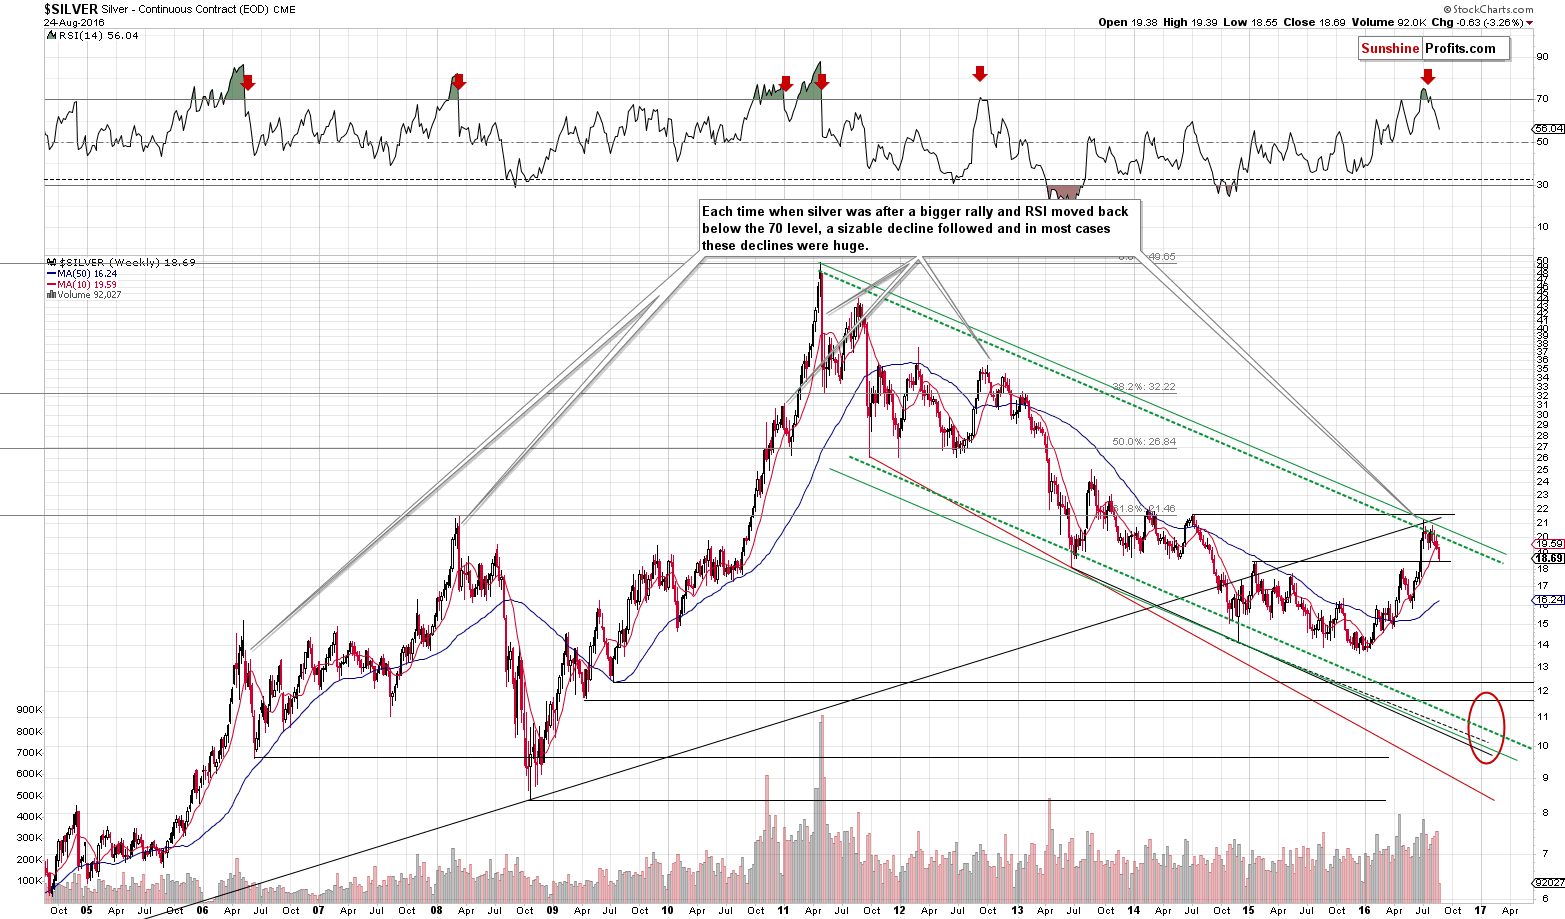
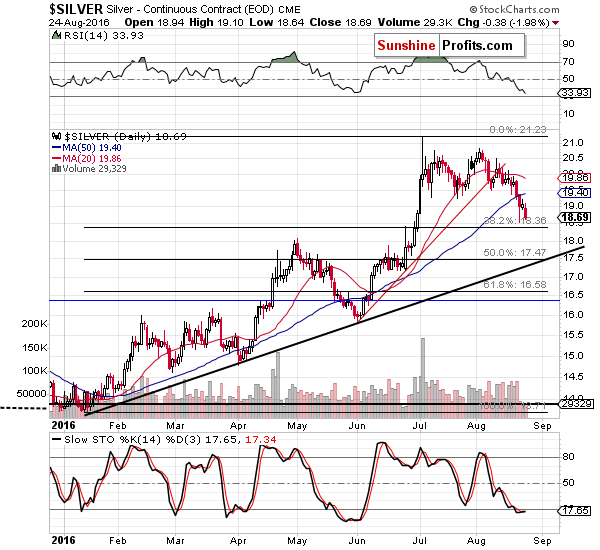
Silver had 2 reasons not to decline more yet: the proximity of the 38.2% Fibonacci retracement level and the 2015 high. Will these levels stop silver for long? Not likely – the major long-term sell signal from the RSI indicator remains in place. Please compare silver’s performance after RSI’s move back below the 70 level on the long-term chart. The current decline is tiny compared to these analogous moves. The last of them is particularly interesting.
Back in late 2012 and early 2013 silver started one of the most powerful declines. There were 3 local tops before the decline really started, so the question is if we are going to see 2 more short-term rallies before the decline accelerates. It could be the case, but it doesn’t have to be and it’s not even very likely.
The shape of the move is only one thing that one needs to examine, when detecting similarities. Time is a critical factor as well. How much time from the bottom did the entire corrective upswing take before the decline accelerated? The bottoms was formed in the middle of 2012 and the huge decline started in early 2013, so it took about 6 months. The most recent bottom was formed at the beginning of the year and silver topped right in the middle of the year – it took about 6 months. Consequently, we can already be in the stage of the decline when it accelerates. Naturally, the implications are very bearish.
What about the USD Index?
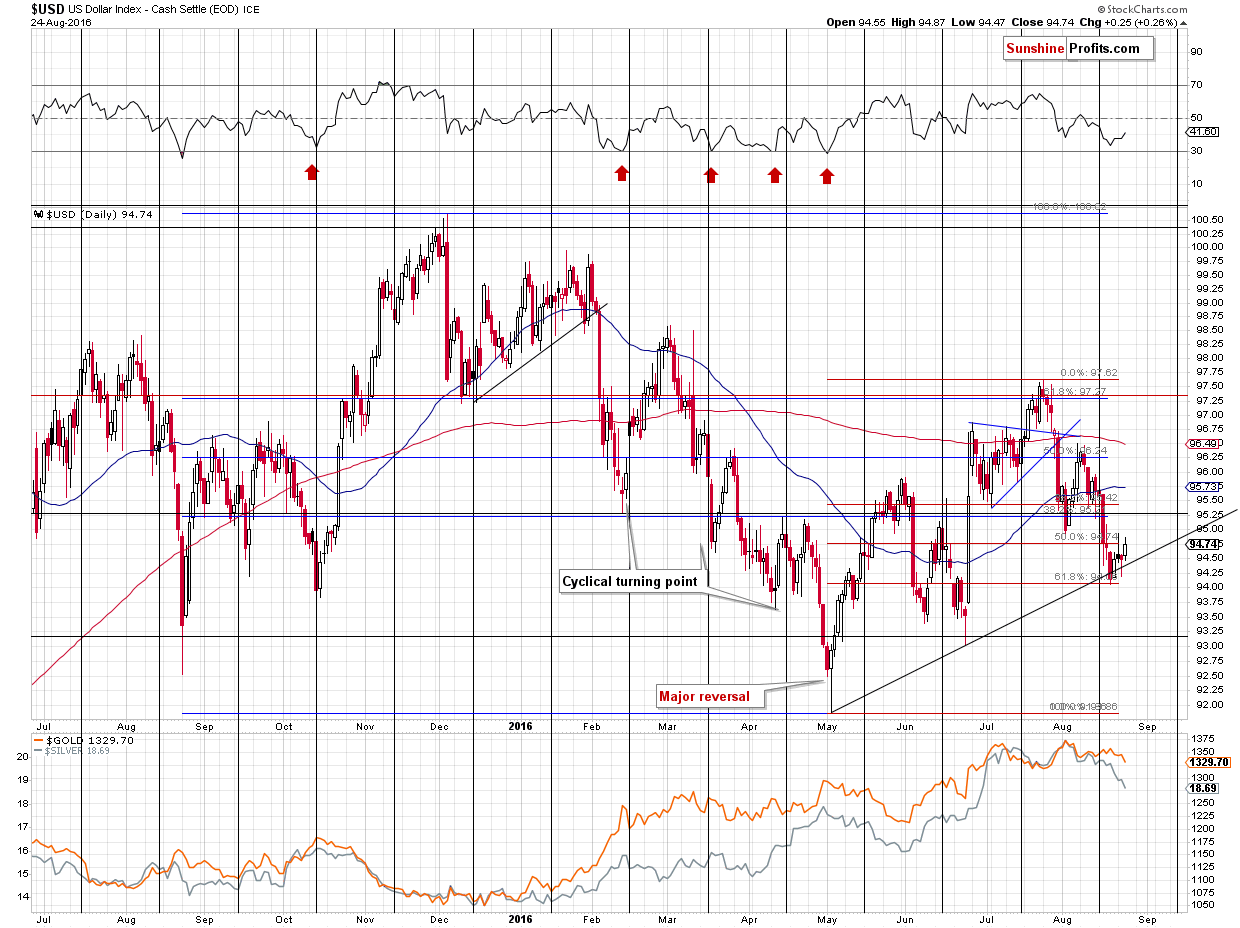
It moved higher, but not high enough to be the sole reason behind miners’ slide. Miners have mostly declined on their own, which makes it an even stronger bearish sign than it would be otherwise. Either way, the outlook for the USD Index remains bullish and our yesterday’s comments remain up-to-date:
The USD Index moved to the rising support line and the 61.8% Fibonacci retracement level a few days after the turning point and the since the tiny breakdown was invalidated, there was no new one in terms of daily closing prices. The USD Index moved a bit below the rising support line yesterday, but finally ended the session rather unchanged. The implications are bullish because the support line held up so well.
Finally, we would like to reply to the question that we just received (we will probably receive similar questions as the decline progresses):
Is it too late to add to Dust here or should I wait for a pullback?
First of all, we can’t reply with a “yes” or “no” to this question, because we can’t provide investment advice. We also can’t know if you should proceed, because we don’t know your current position size, your financial obligations, your liquidity needs, your risk tolerance and other things that relate directly to you. We can provide our analysis of the market, discuss what’s likely and our preferred way to taking advantage of the situation, but it is only you that can factor in all the other above-mentioned things and make a decision about trading your capital. In case of accredited investors, we can assist in case of the core part of the portfolio, though.
We can, however, explain what we mean by writing in the alerts that a given position is justified from the risk to reward point of view. In short, if the current position is different than what we view as justified, it seems that changing it is justified as well. For instance, in case of a small position (50% of the regular position size) and with a big position being justified (150% of the regular position size), it seems that adding to the position is justified. If the position was bigger than that (say, 200% of the regular position), decreasing the size of the position would be justified, in our opinion.
Whether waiting for a pullback is justified in general (we are not saying whether you should do it – we can only discuss it in general terms), in our opinion, depends on the time frame in which one is trading. If it is intra-day trading, then waiting for a pullback might be appropriate, but when one is focusing on bigger, more medium-term oriented trades (like the one we are currently engaged in), then it seems better to enter the position right away without waiting. Generally, if we thought that there is a good chance of seeing a big rally, we would have either exited the short position or we would have limited it – but we are not doing so now.
Summing up, the analogy to the 1983 decline remains in place and so do many bearish signals discussed previously. Yesterday’s huge slide in mining stocks confirms the bearish outlook and (along with the situation in gold and the USD Index) it suggests that the decline is in its early stage.
As always, we will keep you – our subscribers – updated.
To summarize:
Trading capital (supplementary part of the portfolio; our opinion): Short positions (150% of the full position) in gold, silver and mining stocks are justified from the risk/reward perspective with the following entry prices, stop-loss orders and initial target price levels:
- Gold: initial target price: $1,006; stop-loss: $1,423, initial target price for the DGLD ETN: $74.37; stop-loss for the DGLD ETN $34.91
- Silver: initial target price: $13.12; stop-loss: $21.63, initial target price for the DSLV ETN: $39.78; stop-loss for the DSLV ETN $14.34
- Mining stocks (price levels for the GDX ETF): initial target price: $9.34; stop-loss: $33.17, initial target price for the DUST ETF: $16.38; stop-loss for the DUST ETF $3.77
In case one wants to bet on junior mining stocks' prices (we do not suggest doing so – we think senior mining stocks are more predictable in the case of short-term trades – if one wants to do it anyway, we provide the details), here are the stop-loss details and initial target prices:
- GDXJ ETF: initial target price: $14.13; stop-loss: $54.29
- JDST ETF: initial target price: $14.39; stop-loss: $3.22
Long-term capital (core part of the portfolio; our opinion): No positions
Insurance capital (core part of the portfolio; our opinion): Full position
Plus, you might want to read why our stop-loss orders are usually relatively far from the current price.
Please note that a full position doesn’t mean using all of the capital for a given trade. You will find details on our thoughts on gold portfolio structuring in the Key Insights section on our website.
As a reminder – “initial target price” means exactly that – an “initial” one, it’s not a price level at which we suggest closing positions. If this becomes the case (like it did in the previous trade) we will refer to these levels as levels of exit orders (exactly as we’ve done previously). Stop-loss levels, however, are naturally not “initial”, but something that, in our opinion, might be entered as an order.
Since it is impossible to synchronize target prices and stop-loss levels for all the ETFs and ETNs with the main markets that we provide these levels for (gold, silver and mining stocks – the GDX ETF), the stop-loss levels and target prices for other ETNs and ETF (among other: UGLD, DGLD, USLV, DSLV, NUGT, DUST, JNUG, JDST) are provided as supplementary, and not as “final”. This means that if a stop-loss or a target level is reached for any of the “additional instruments” (DGLD for instance), but not for the “main instrument” (gold in this case), we will view positions in both gold and DGLD as still open and the stop-loss for DGLD would have to be moved lower. On the other hand, if gold moves to a stop-loss level but DGLD doesn’t, then we will view both positions (in gold and DGLD) as closed. In other words, since it’s not possible to be 100% certain that each related instrument moves to a given level when the underlying instrument does, we can’t provide levels that would be binding. The levels that we do provide are our best estimate of the levels that will correspond to the levels in the underlying assets, but it will be the underlying assets that one will need to focus on regarding the signs pointing to closing a given position or keeping it open. We might adjust the levels in the “additional instruments” without adjusting the levels in the “main instruments”, which will simply mean that we have improved our estimation of these levels, not that we changed our outlook on the markets. We are already working on a tool that would update these levels on a daily basis for the most popular ETFs, ETNs and individual mining stocks.
Our preferred ways to invest in and to trade gold along with the reasoning can be found in the how to buy gold section. Additionally, our preferred ETFs and ETNs can be found in our Gold & Silver ETF Ranking.
As always, we'll keep you - our subscribers - updated should our views on the market change. We will continue to send out Gold & Silver Trading Alerts on each trading day and we will send additional Alerts whenever appropriate.
The trading position presented above is the netted version of positions based on subjective signals (opinion) from your Editor, and the Tools and Indicators.
As a reminder, Gold & Silver Trading Alerts are posted before or on each trading day (we usually post them before the opening bell, but we don't promise doing that each day). If there's anything urgent, we will send you an additional small alert before posting the main one.
=====
Latest Free Trading Alerts:
On Monday, Libor hit a 7-year high. What does it mean for the Fed’s stance and the gold market?
S&P 500 index lost 0.5% yesterday, as it extended its short-term consolidation. Is this a medium-term topping pattern or just consolidation before another leg up? Is holding short position still justified?
Stock Trading Alert: New Downtrend Or Just More Consolidation Before Another Leg Up?
=====
Hand-picked precious-metals-related links:
Gold price drop triggers mining stocks bloodbath
China Cut Gold Imports From HK as Rising Prices Deter Buyers
Sibanye’s Profit Climbs Sixfold on Higher Gold Price, Weak Rand
This Australian man just found a massive 145-ounce gold nugget
=====
In other news:
Central bankers eye public spending to plug $1 trillion investment gap
Bond Traders Are Desperate for Direction From Yellen in Jackson Hole
There’s time for two Fed hikes this year — and everyone could benefit: Wittmann
Fed, Eager to Show It’s Listening, Welcomes Protesters
Inside the big banks' plan for new digital cash
=====
Thank you.
Sincerely,
Przemyslaw Radomski, CFA
Founder, Editor-in-chief, Gold & Silver Fund Manager
Gold & Silver Trading Alerts
Forex Trading Alerts
Oil Investment Updates
Oil Trading Alerts

