

Briefly: Short positions (full position) in gold, silver and mining stocks are justified from the risk/reward perspective.
Last week gold aimed to move higher and so did silver – both rallies were invalidated before the week was over and the weekly candlesticks feature reversals. However, there is much more to the silver market at this time than just the above-mentioned reversal.
Before discussing the situation in silver in greater detail, let’s take a look at gold (charts courtesy of http://stockcharts.com).
In Friday’s alert, we wrote the following:
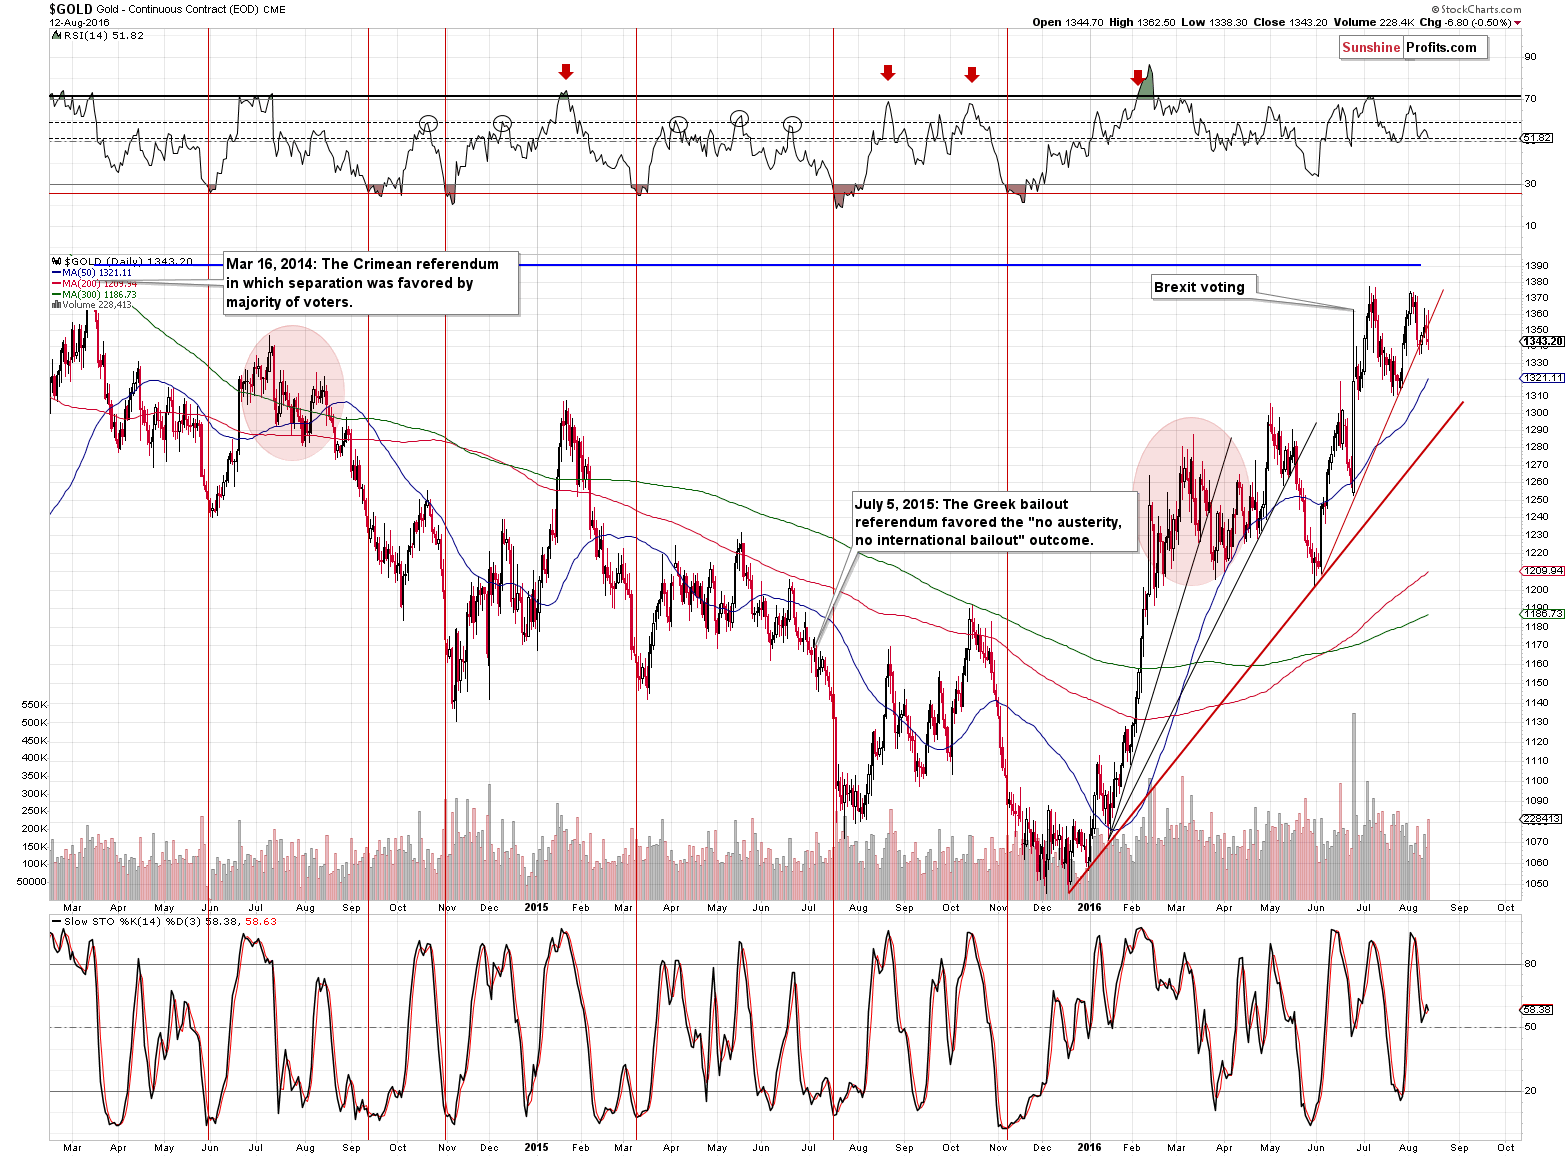
(…), we can clearly say that the breakdown below the rising support line was not invalidated. Actually, the breakdown was confirmed.
During the session, we saw another attempt to move higher, which – once again – failed and gold closed the week well below the rising support line, even if we take into account the Stockcharts’ data (other sources suggest that gold’s Friday’s closing price was $1,335.70) – the implications are clearly bearish, especially that gold declined on increased volume.
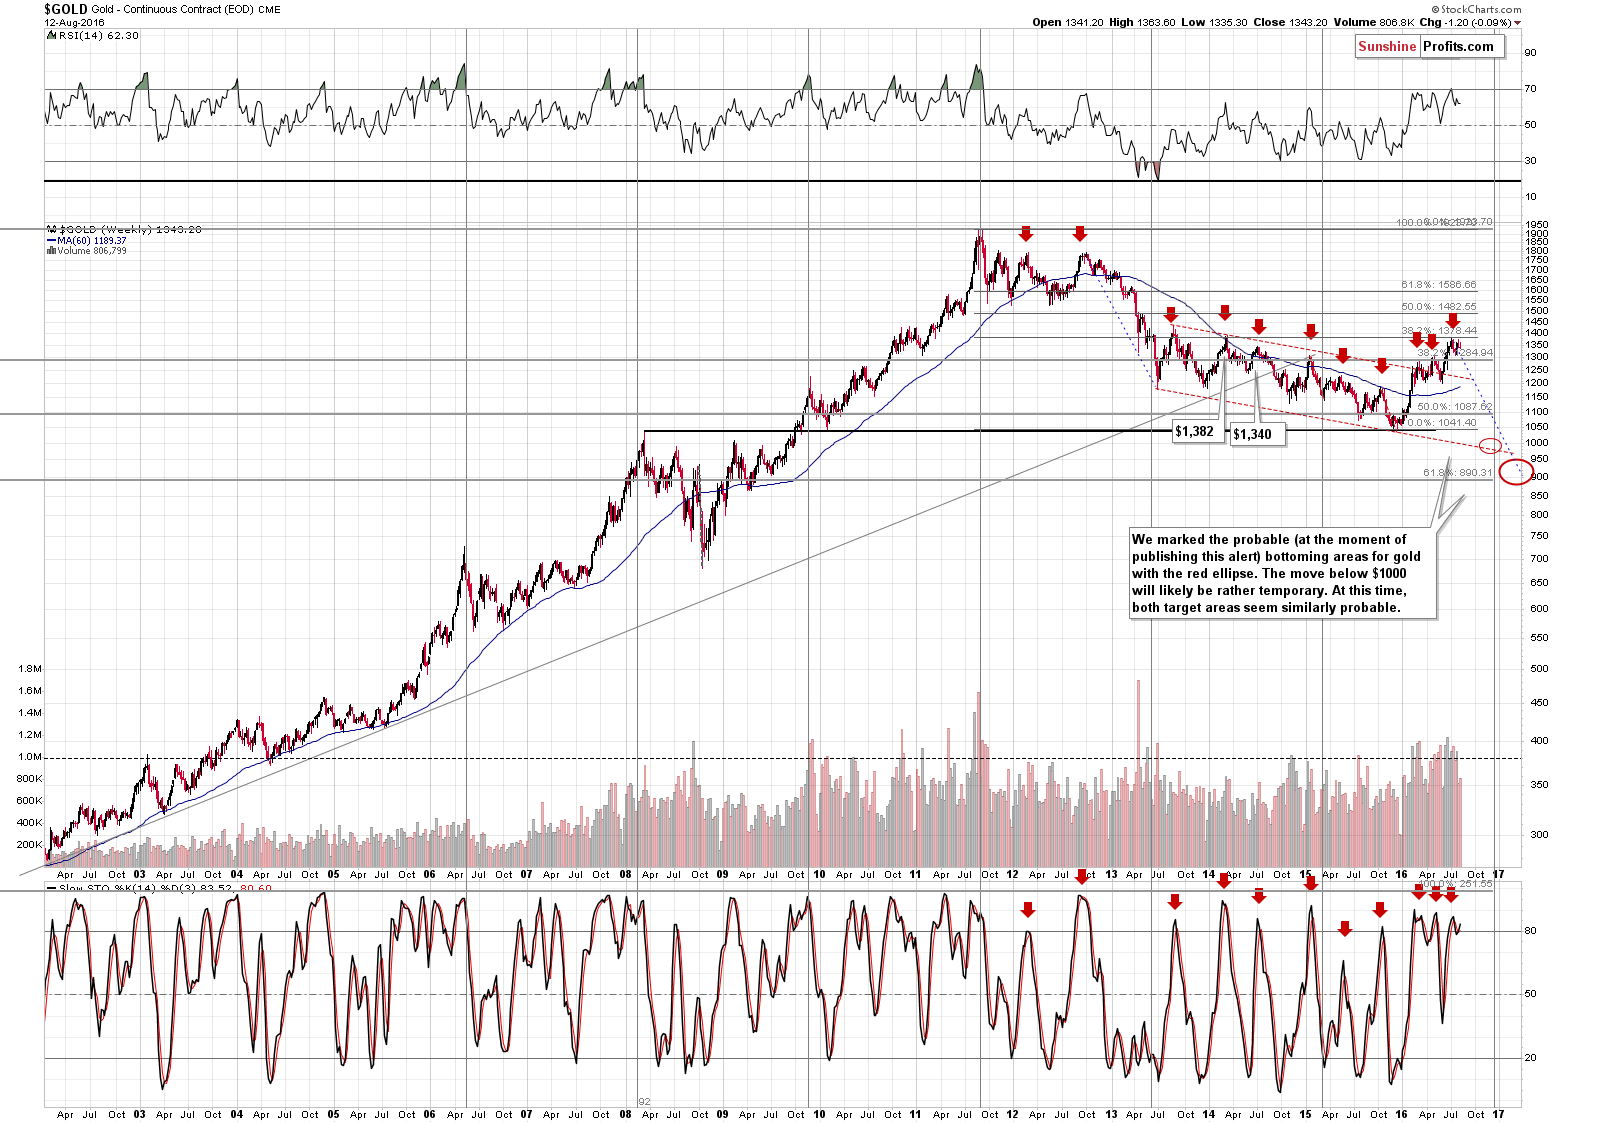
The important thing on the weekly chart is the closing price and the weekly change – gold declined a bit after an attempt to move higher last week. This created a bearish reversal weekly candlestick, which makes a decline from here even more likely.
From the non-USD perspective, gold seems to have reversed after reaching the rising resistance line a few weeks ago. Last week’s reversal was visible also from this perspective and the implications are bearish.
However, the thing that we would like to discuss more thoroughly is the volume (the ratio of volumes). It was huge. The previous few times when the volume was similarly significant, we saw lower prices in the following weeks: in mid-2013 and mid-2014. There was a short-term decline after a volume spike in mid-2015. We are more or less in the middle of 2016 and we have just seen the spike in volume once again. The implications are bearish.
Moving on to silver, let’s start with the long-term chart.
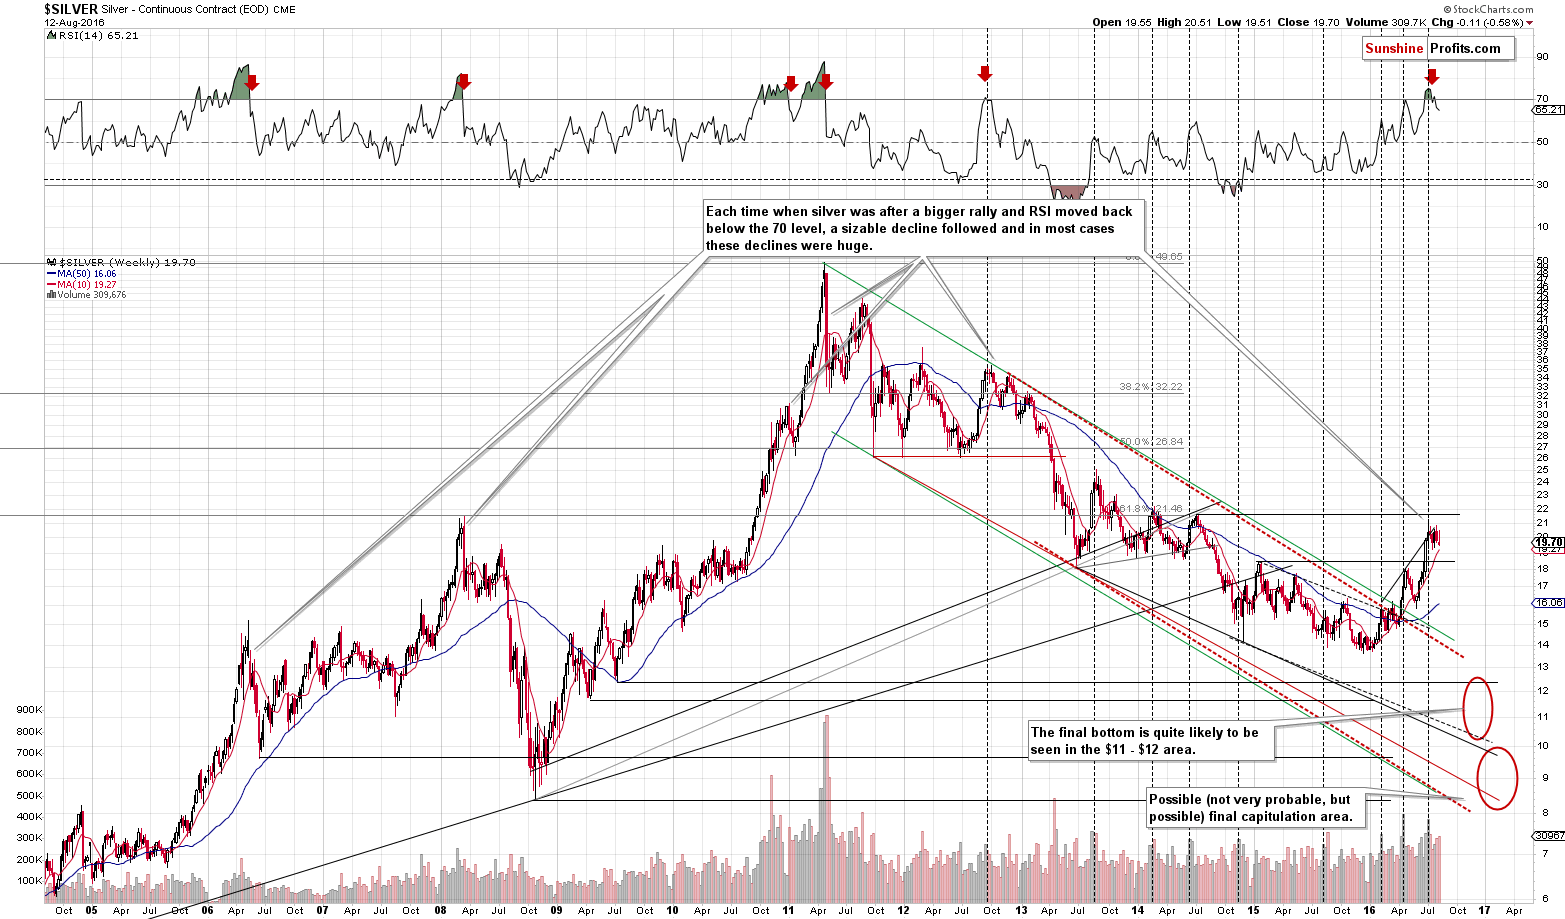
Just like gold did, silver formed a weekly reversal and ultimately declined. The RSI indicator continues to have bearish implications and overall nothing changed as far as outlook based on the above chart is concerned.
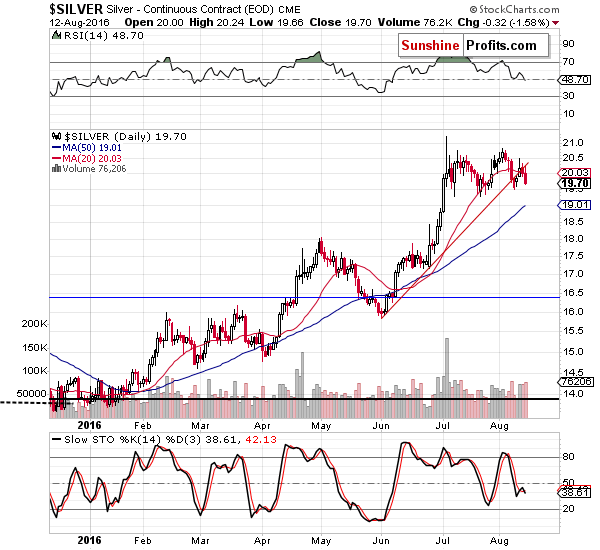
On the short-term chart, however, we see that silver broke and closed the week below the 20-day moving average and the rising support line. This is a bearish development, especially that it took place on significant volume.
The 2 things that are rarely commented on and that would like to featured today are silver’s relationship with currencies.
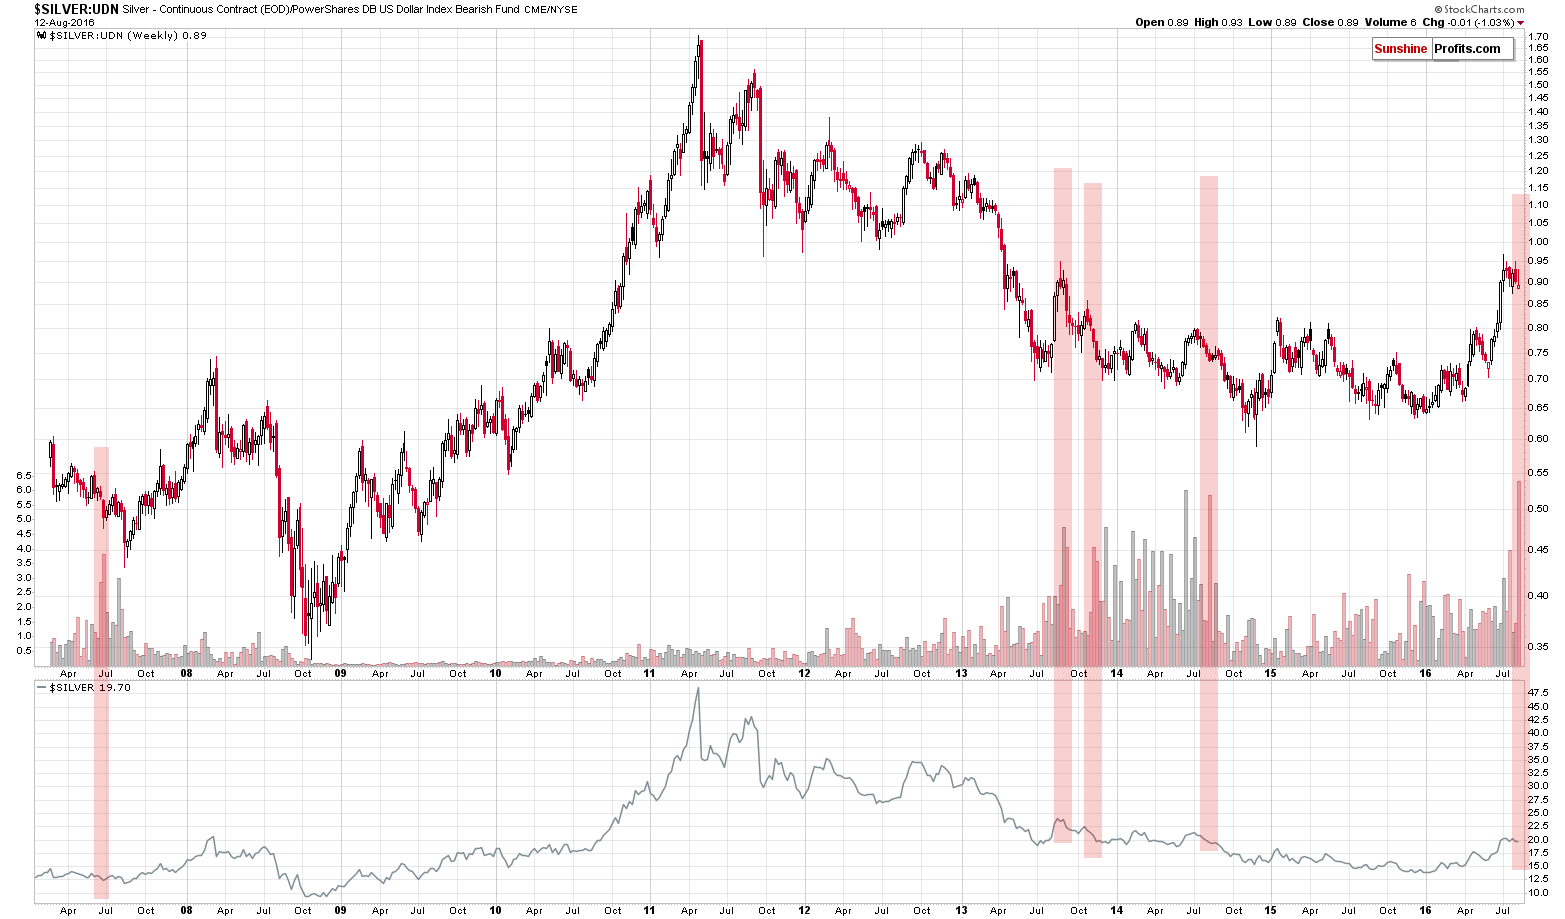
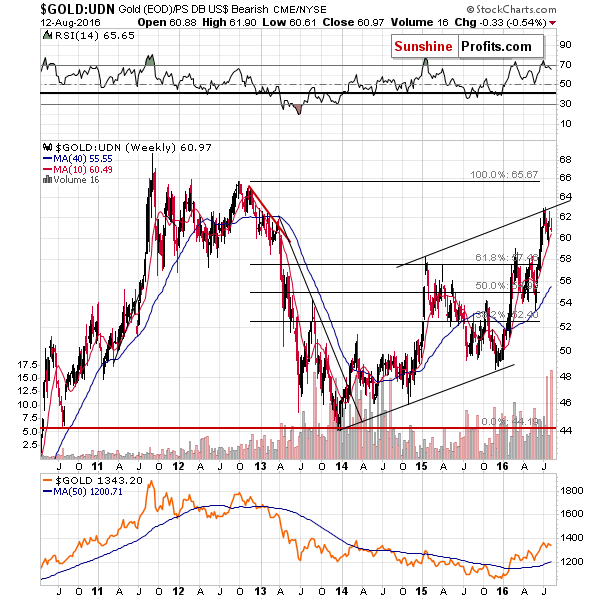
Let’s start with the non-USD silver chart. When discussing prices in terms of currencies other than the US dollar, we usually focus on gold, but this kind of analysis is not limited to it. The above chart features silver in terms of such other currencies.
What’s interesting on the above chart? 2 things. One thing is the invalidation of silver’s brief move above the 2013 high. Naturally, the implications thereof are bearish. The second thing is the exceptionally high reading in weekly volume that we saw last week (precisely: the ratio of volumes: silver vs. the UDN ETF). We marked similar situations in the past with red rectangles. In all previous cases (since 2007 – we don’t have the UDN data before that time) silver declined in the short term and in most cases (the most recent ones) silver declined very significantly in the following weeks. The implications of the above chart are clearly bearish.

We were asked to comment on the link between silver and the ratio of the South African rand and the USD Index. There is indeed a quite strong medium-term correlation between the two, as you can see on the above chart. In particular, since mid-2008 the tops and bottoms were quite in tune with each other. At times they formed at the same time and at times they were a few weeks apart from each other, but more or less both markets moved in the same direction in the short term and medium term on multiple occasions. In particular, the alignment was quite clear so far this year.
How can this help us determine what’s likely ahead for silver? Well, the ratio is about to encounter a very strong, long-term resistance line and the implications thereof are strongly bearish. If the link between the two is to be upheld, we can expect it to correspond to a decline in the price of the white metal.
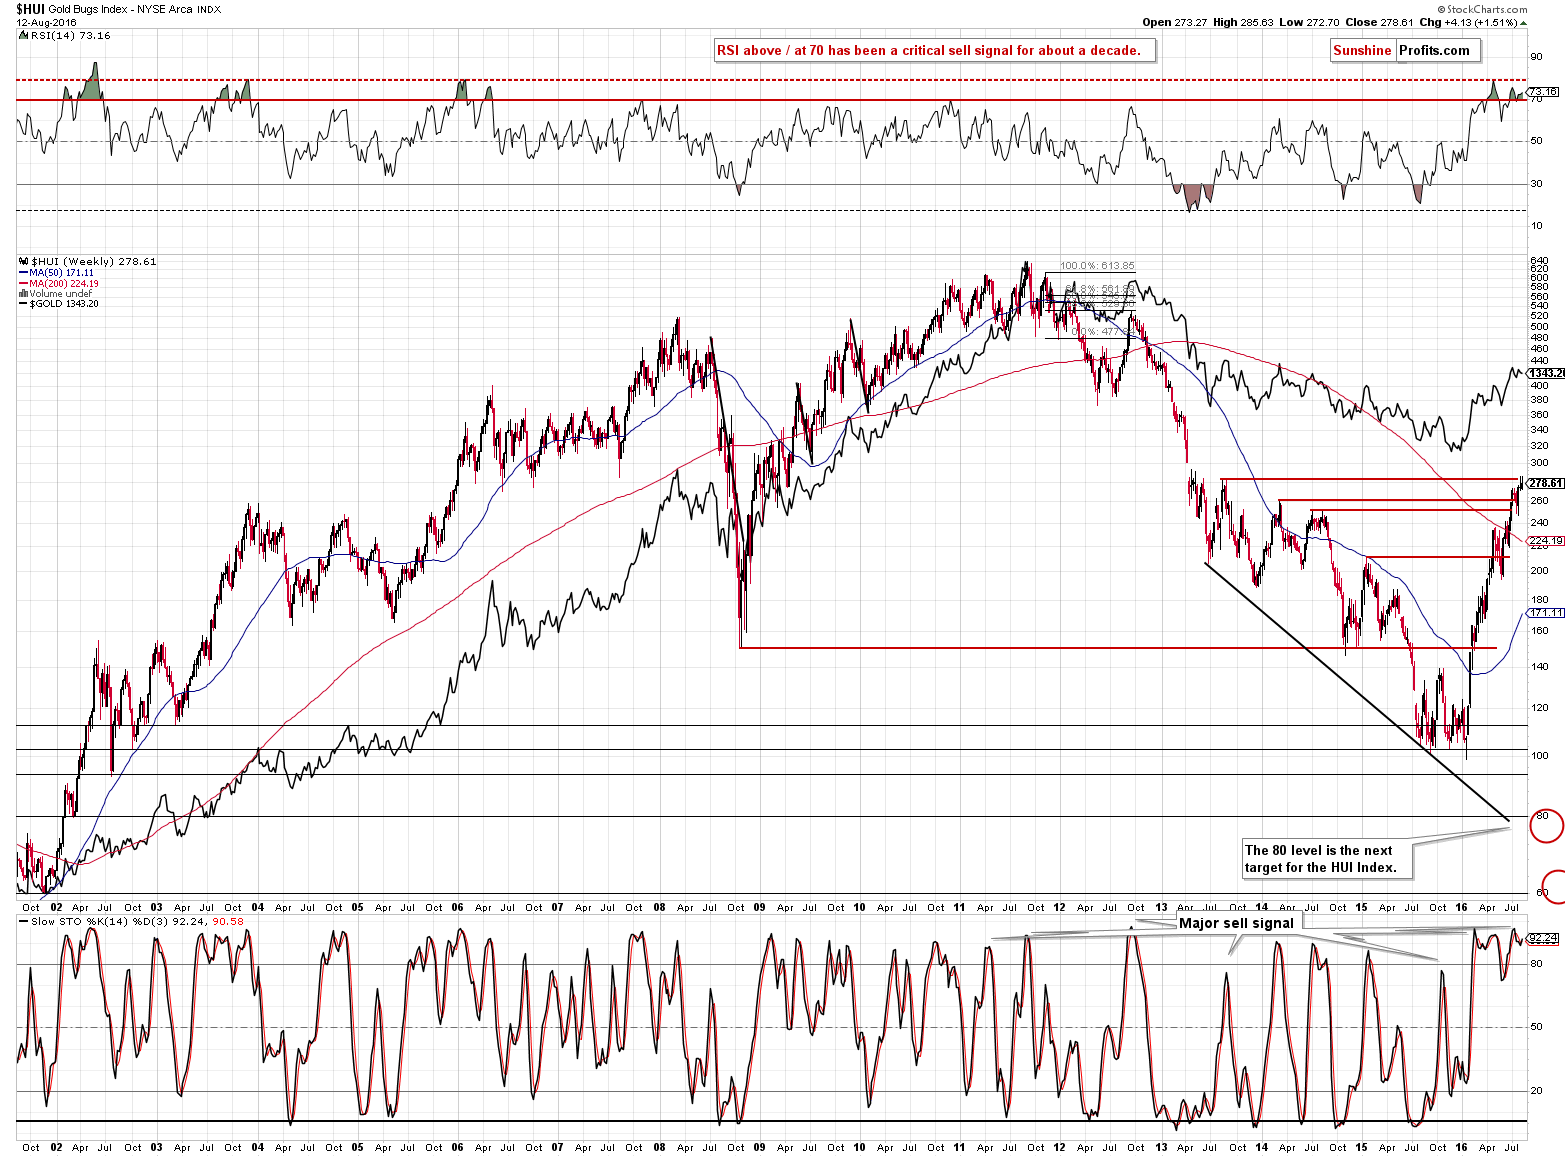
Last week, gold stocks moved higher and erased almost all of last week’s rally. They ultimately closed the week a bit higher, but the reversal itself has bearish implications.
As far as the short-term chart is concerned, we wrote the following on Friday:
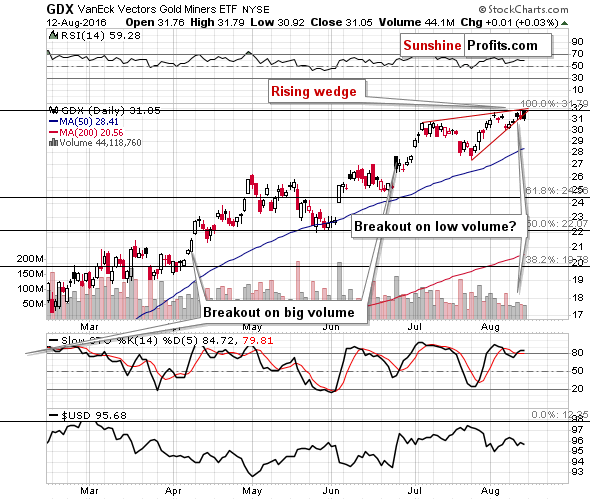
In the case of the mining stocks, we also saw a daily reversal, but the volume was not huge, so it’s not a major bearish confirmation yet. Still, miners are in a rising wedge pattern that is about to end, and this is generally a bearish reversal pattern. Naturally, the implications thereof are bearish.
Friday’s session provided us with a breakdown below the rising wedge pattern. The breakdown is not huge, so it could still be reversed, but still it was present and it was seen despite a move lower in the USD Index. This is a strong suggestion that the breakdown will be confirmed and that miners are going to slide in the near future.
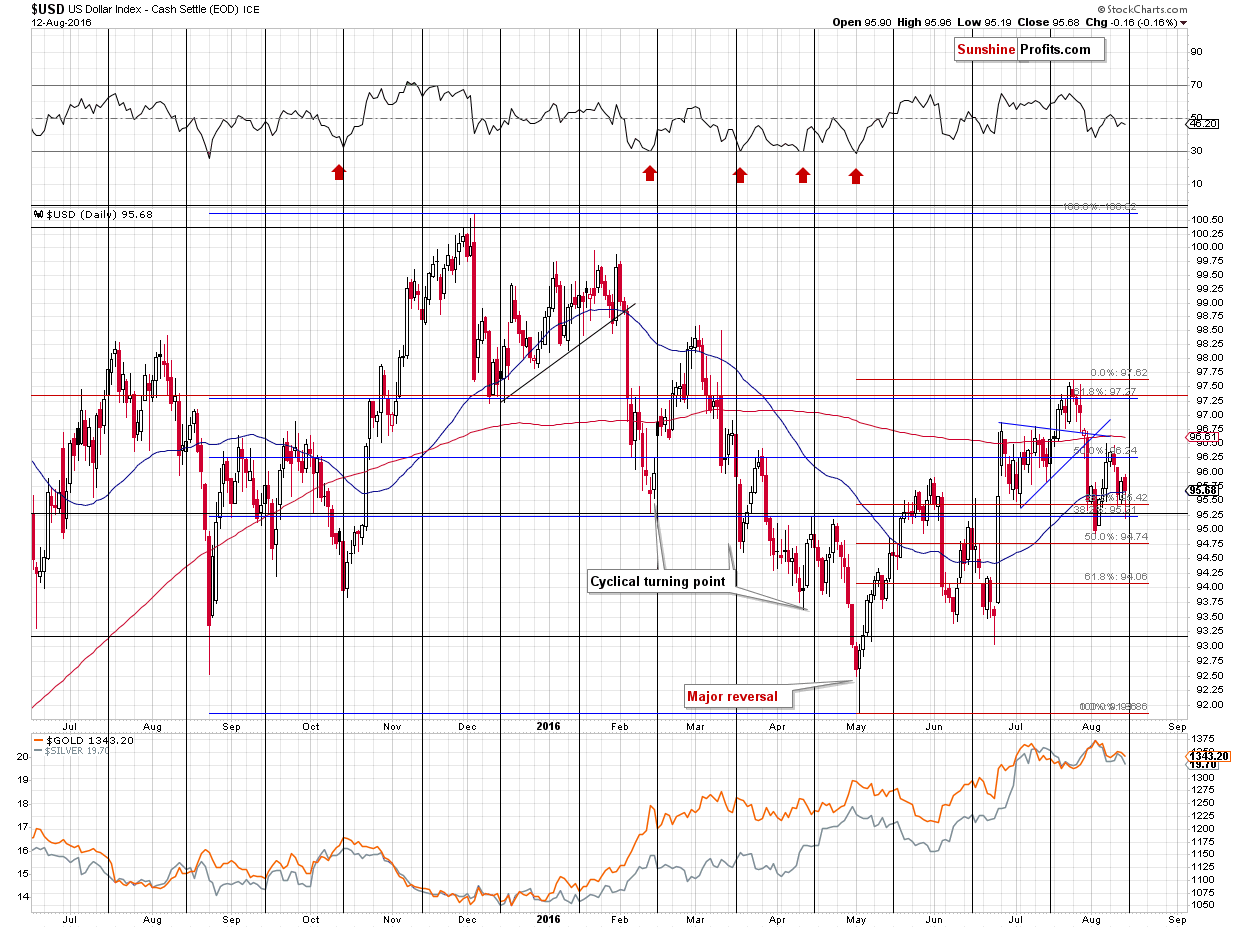
While we’re at it, the USD Index (you’ll find more thorough discussion of the individual currency pairs in our Forex Trading Alerts) declined on Friday, but it erased a large part of the decline before the session was over. The local bottom in the USD Index could be in as the breakdown below the 50-day moving average and the July lows was invalidated. The implications for the precious metals market are bearish.
Summing up, the analogy to the 1983 decline remains in place and so do many bearish signals discussed last week, and in the last few days we saw additional developments that confirm the bearish outlook. Silver seen from the non-USD perspective and its volume suggest much lower prices as do other signals (i.a. the breakdown below the rising wedge pattern in case of mining stocks). Overall, the outlook remains bearish.
As always, we will keep you – our subscribers – updated.
To summarize:
Trading capital (supplementary part of the portfolio; our opinion): Short positions (full position) in gold, silver and mining stocks are justified from the risk/reward perspective with the following entry prices, stop-loss orders and initial target price levels:
- Gold: initial target price: $1,006; stop-loss: $1,423, initial target price for the DGLD ETN: $74.37; stop-loss for the DGLD ETN $34.91
- Silver: initial target price: $13.12; stop-loss: $21.63, initial target price for the DSLV ETN: $39.78; stop-loss for the DSLV ETN $14.34
- Mining stocks (price levels for the GDX ETF): initial target price: $9.34; stop-loss: $33.17, initial target price for the DUST ETF: $16.38; stop-loss for the DUST ETF $3.77
In case one wants to bet on junior mining stocks' prices (we do not suggest doing so – we think senior mining stocks are more predictable in the case of short-term trades – if one wants to do it anyway, we provide the details), here are the stop-loss details and initial target prices:
- GDXJ ETF: initial target price: $14.13; stop-loss: $54.29
- JDST ETF: initial target price: $14.39; stop-loss: $3.22
Long-term capital (core part of the portfolio; our opinion): No positions
Insurance capital (core part of the portfolio; our opinion): Full position
Plus, you might want to read why our stop-loss orders are usually relatively far from the current price.
Please note that a full position doesn’t mean using all of the capital for a given trade. You will find details on our thoughts on gold portfolio structuring in the Key Insights section on our website.
As a reminder – “initial target price” means exactly that – an “initial” one, it’s not a price level at which we suggest closing positions. If this becomes the case (like it did in the previous trade) we will refer to these levels as levels of exit orders (exactly as we’ve done previously). Stop-loss levels, however, are naturally not “initial”, but something that, in our opinion, might be entered as an order.
Since it is impossible to synchronize target prices and stop-loss levels for all the ETFs and ETNs with the main markets that we provide these levels for (gold, silver and mining stocks – the GDX ETF), the stop-loss levels and target prices for other ETNs and ETF (among other: UGLD, DGLD, USLV, DSLV, NUGT, DUST, JNUG, JDST) are provided as supplementary, and not as “final”. This means that if a stop-loss or a target level is reached for any of the “additional instruments” (DGLD for instance), but not for the “main instrument” (gold in this case), we will view positions in both gold and DGLD as still open and the stop-loss for DGLD would have to be moved lower. On the other hand, if gold moves to a stop-loss level but DGLD doesn’t, then we will view both positions (in gold and DGLD) as closed. In other words, since it’s not possible to be 100% certain that each related instrument moves to a given level when the underlying instrument does, we can’t provide levels that would be binding. The levels that we do provide are our best estimate of the levels that will correspond to the levels in the underlying assets, but it will be the underlying assets that one will need to focus on regarding the signs pointing to closing a given position or keeping it open. We might adjust the levels in the “additional instruments” without adjusting the levels in the “main instruments”, which will simply mean that we have improved our estimation of these levels, not that we changed our outlook on the markets. We are already working on a tool that would update these levels on a daily basis for the most popular ETFs, ETNs and individual mining stocks.
Our preferred ways to invest in and to trade gold along with the reasoning can be found in the how to buy gold section. Additionally, our preferred ETFs and ETNs can be found in our Gold & Silver ETF Ranking.
As always, we'll keep you - our subscribers - updated should our views on the market change. We will continue to send out Gold & Silver Trading Alerts on each trading day and we will send additional Alerts whenever appropriate.
The trading position presented above is the netted version of positions based on subjective signals (opinion) from your Editor, and the Tools and Indicators.
As a reminder, Gold & Silver Trading Alerts are posted before or on each trading day (we usually post them before the opening bell, but we don't promise doing that each day). If there's anything urgent, we will send you an additional small alert before posting the main one.
=====
Latest Free Trading Alerts:
Crude oil declined on Wednesday only to shoot up with vengeance yesterday, exceeding the previous August highs. Still, crude oil declined a bit before the session was over, so many investors are wondering if the rally is already over – is this the case?
Oil Trading Alert: Is the Rally Over?
=====
Hand-picked precious-metals-related links:
Gold Losing Appeal for Investors Retreating From Rally Bet
Gold firm as U.S. data lowers rate hike prospects
Gold Speculators lowered bullish net positions for 4th out of last 5 weeks
Newcrest Full-Year Profit Falls 24% on Lower Gold Prices
=====
In other news:
El-Erian: 2 things struck me most about Europe's new growth numbers
Japan's economy is barely growing
Asian Stocks Near One-Year High as Crude Oil Rises; Yuan Weakens
IMF Wants Japan to Boost Wages Using Nixon Strategy in Reverse
=====
Thank you.
Sincerely,
Przemyslaw Radomski, CFA
Founder, Editor-in-chief, Gold & Silver Fund Manager
Gold & Silver Trading Alerts
Forex Trading Alerts
Oil Investment Updates
Oil Trading Alerts

