

Briefly: In our opinion, speculative short positions (full) in gold, silver and mining stocks are justified from the risk/reward point of view.
Despite a rally early last week, gold actually ended the week a bit lower than the previous one. Mining stocks moved higher a bit and the biggest gains were seen in silver – the white metal rose 78 cents last week. Let’s once again discuss what happened, what’s likely to happen and how far silver is likely to rally.
Let’s start with gold (charts courtesy of http://stockcharts.com).
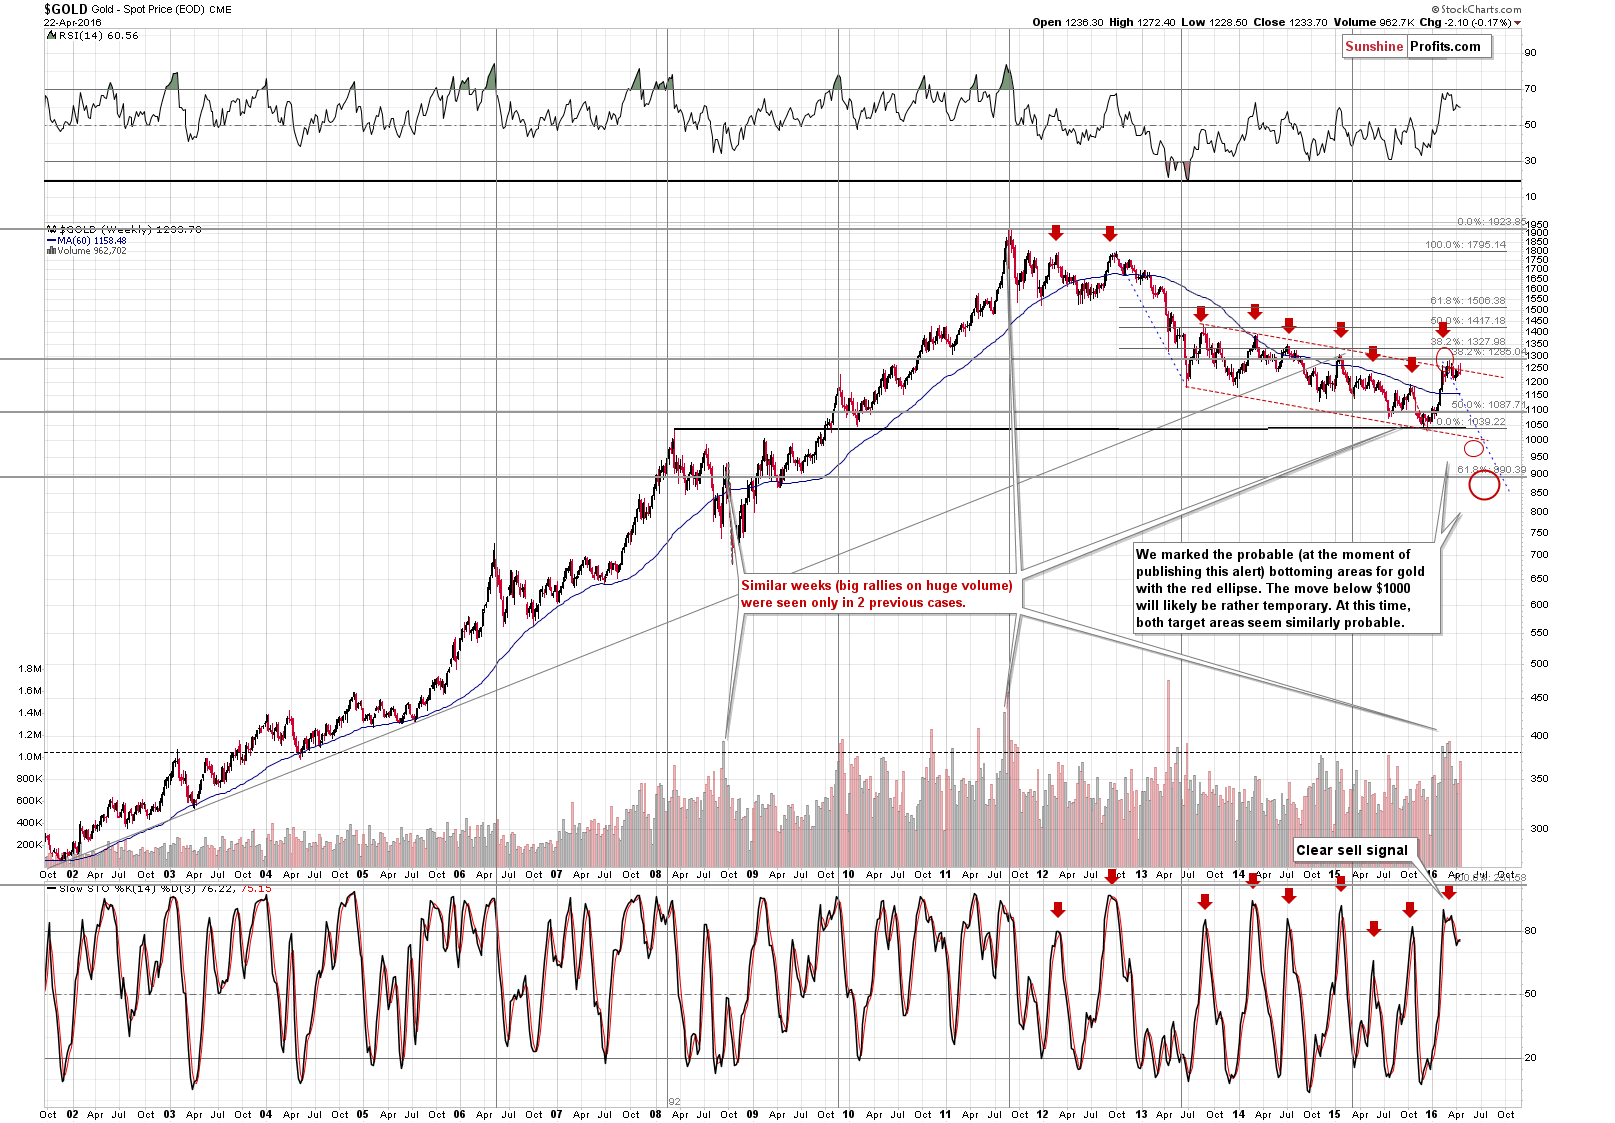
Gold once again tried to move above the declining trend channel, but once again failed to really do so. Since gold remains within the declining trend channel, the outlook remains bearish from both the medium- and short-term point of view. Please note that this doesn’t mean that another – similar to the one we saw last week – counter-trend move will not be seen. It could but, whether this is the case or not, it’s likely that the next big move will be to the downside.
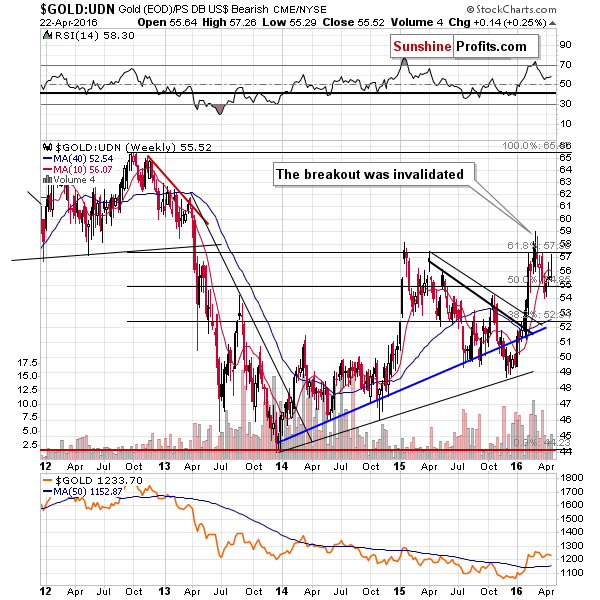
From the non-USD perspective, gold reversed after moving back to the 61.8% Fibonacci retracement and closed the week once again below the 10-week moving average. It appears that it was just a correction within a decline that started after gold invalidated the breakout above the 2015 high. The outlook remains bearish.
In Friday’s alert, we wrote the following:
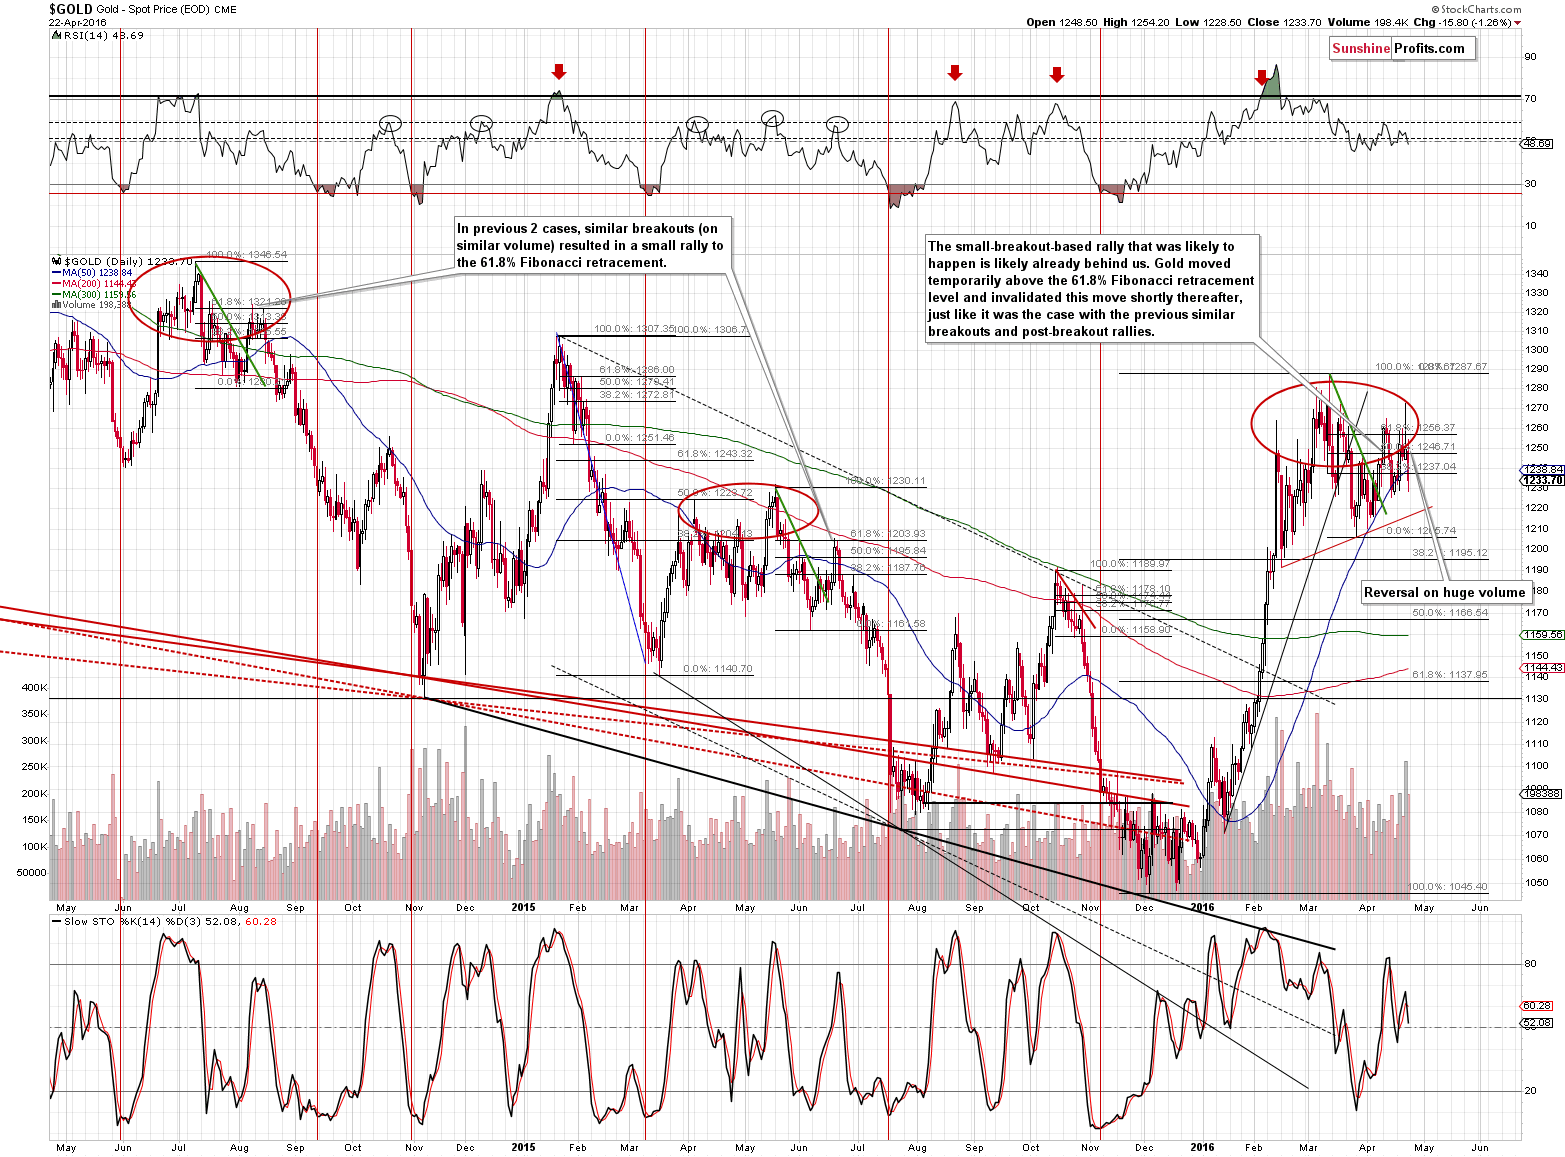
From the short-term point of view, not much changed either. Gold moved to the 61.8% Fibonacci retracement level and declined after reaching it. There was no meaningful breakout.
Despite yesterday’s pre-market rally, the above remains up-to-date as gold closed below the 61.8% Fibonacci retracement once again yesterday. Without a breakout, the decline remains in place.
Moreover, the size of the reversal and the size of the volume that accompanied it is a very clear bearish sign for the following days.
The above resulted in a quite visible decline, just like it was supposed to. The outlook remains bearish.
As far as silver is concerned, we saw a big reversal after the white metal touched its May 2015 high. This makes the reversal very believable and it is very likely that silver will slide in the coming days. Still, we can’t rule out another move to the mentioned resistance – the May 2015 high ($17.77).
The volume that accompanied silver’s move higher and the reversal was high, but as we wrote last Monday, silver’s large-volume rally is not necessarily a bullish sign:
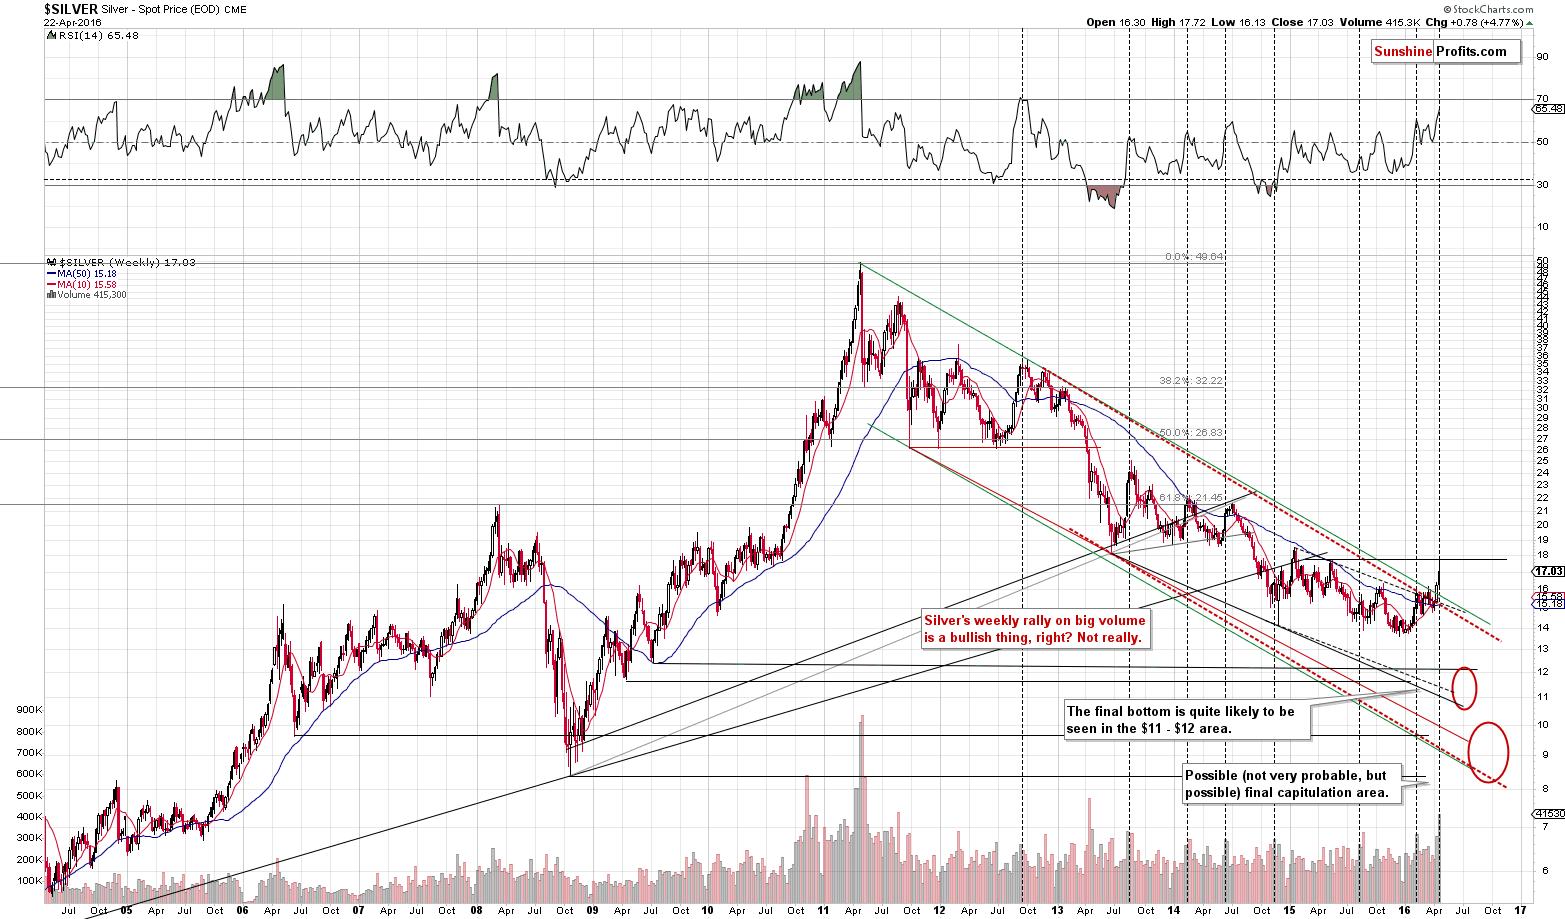
The long-term silver chart also suggests that a move lower is likely just ahead. Silver moved higher last week and the corresponding weekly volume was significant. This seems like a bullish sign… Until one checks what happened in the previous cases when silver rallied on similarly “strong” volume. We marked these situations with vertical, black, dashed lines. As you can see, silver declined at least some in practically all cases, and in most cases, it declined significantly. Consequently, taking the above signal at face value could be very misleading. The history shows that the implications of silver’s weekly rally on big volume are actually bearish.
Moreover, some may say that silver broke above the declining, long-term resistance line and closed the week above it and they may view such a breakout as bullish. Once again, we would like to remind about the fact that silver tens to “fake out” just before moving in the opposite direction. Consequently, we are not viewing this breakout as bullish. It can even be viewed as a bearish sign.
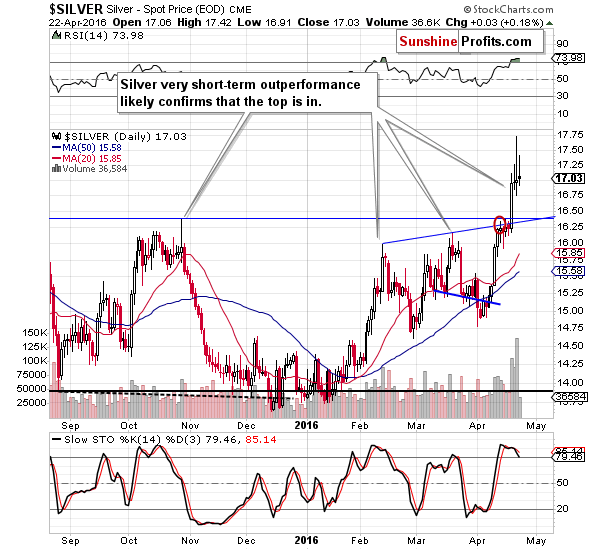
On a short-term basis, silver tried to move much higher for the last 3 days of the previous week without success – each time silver declined back to where it had been before the session was over. A few reversals in a row suggest that the silver market really isn’t likely to move higher – the resistance is too significant.
So, the outlook is not that bullish for the medium term. However, as we’ve emphasized many times in the past, the long-term outlook for silver is very favorable and we expect the white metal to move well above its $50 high.
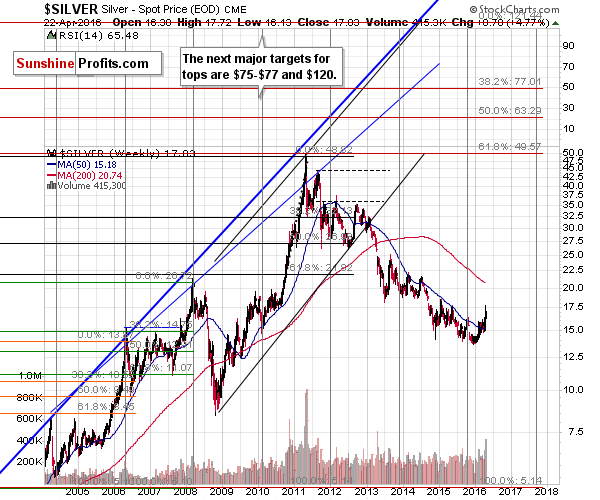
How high will silver go once the 2011 top is taken out? In order to determine that, we checked the relationship between the previous tops – after breaking below the previous high, silver moved to the Fibonacci extension that was based on the previous highs. Each color represents calculations for a different top based on previous tops.
So, if this tendency holds (and so far there is no reason for us to believe otherwise), we can expect silver to form the next top (not necessarily the final one) at $63, $77 and then $121. These levels are very far from where silver is today, but so was $50 when silver was trading below $10 in 2008 and it took only 3 years for silver to move to that high.
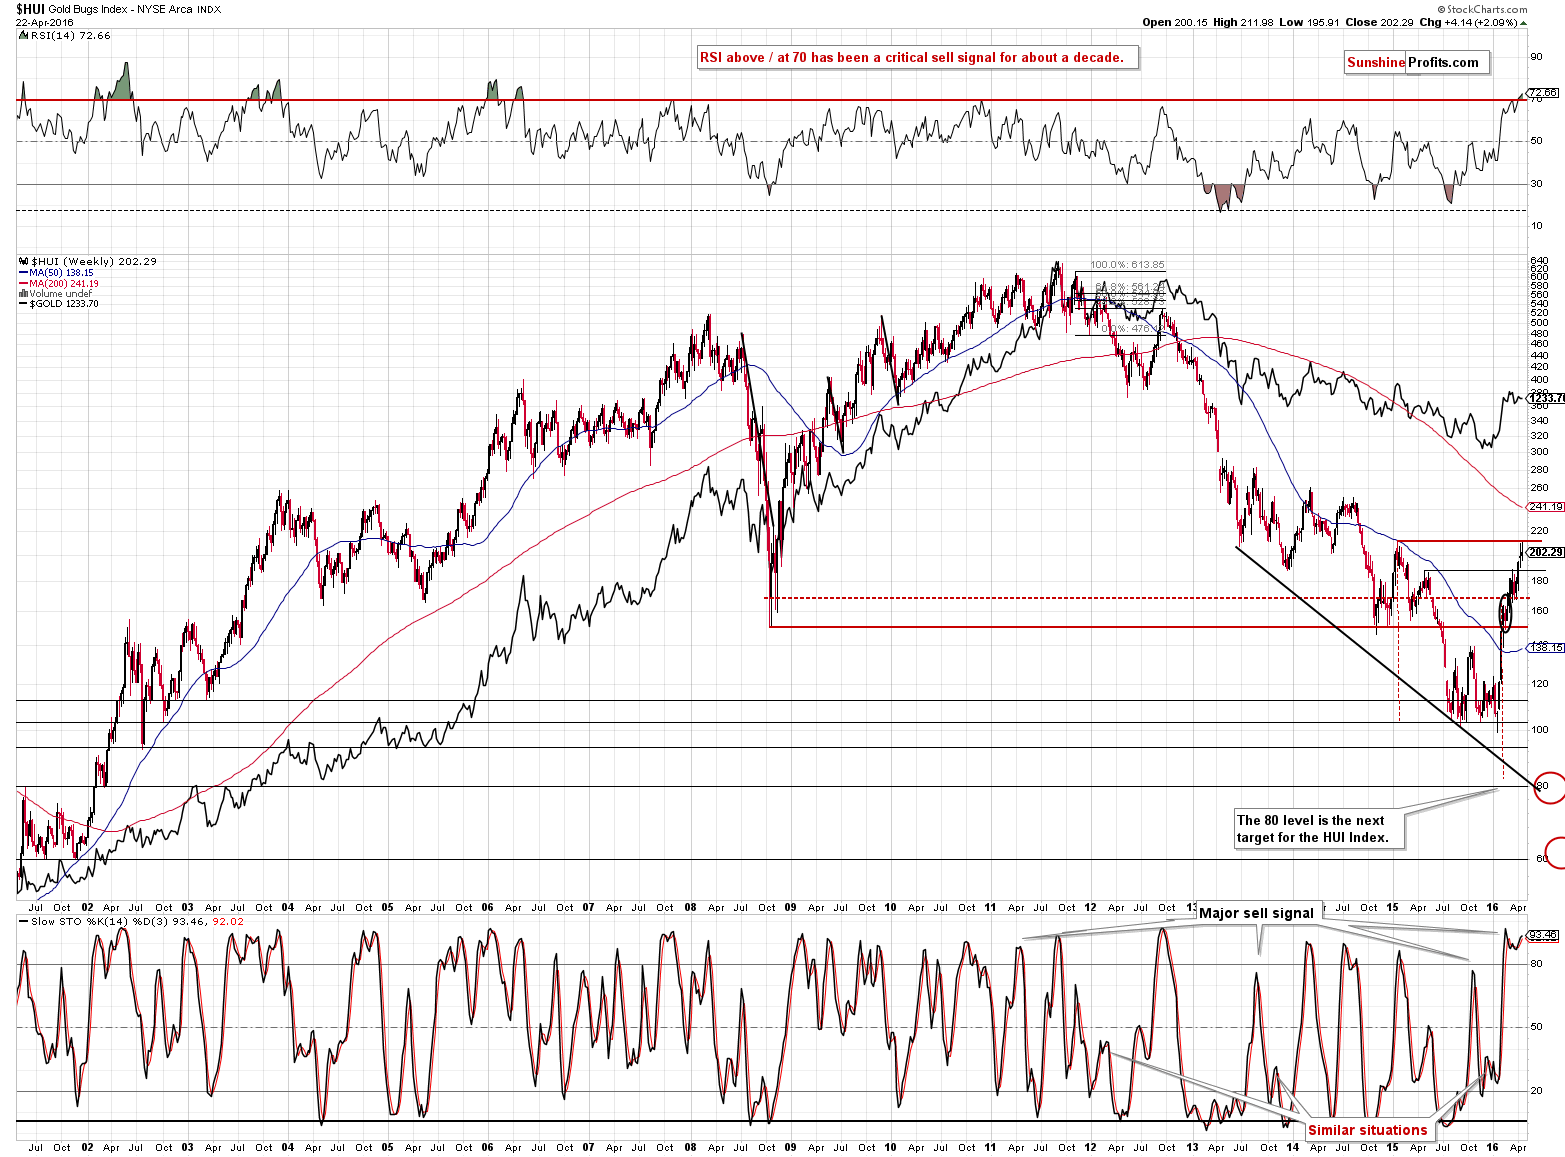
Moving on to mining stocks, we see that the 2015 high in the HUI Index (proxy for gold stocks) remains unbroken despite another attempt to move above it. Consequently, what we wrote last Monday remains up-to-date:
The top is likely in. It is not only the significance of the resistance level that was reached that makes it likely – it’s also confirmed by the RSI indicator, which moved to the 70 level and in the last 10 years or so this sign has always (!) corresponded to important tops.
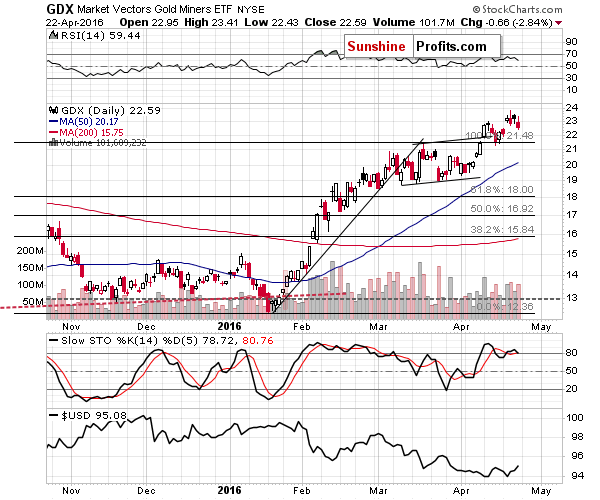
The short-term mining stock chart shows that miners declined on Friday on volume that was bigger than what we had seen during Thursday’s small move higher. This price-volume link has bearish implications, especially that we saw similar patterns in the past 4 days, not only 2.
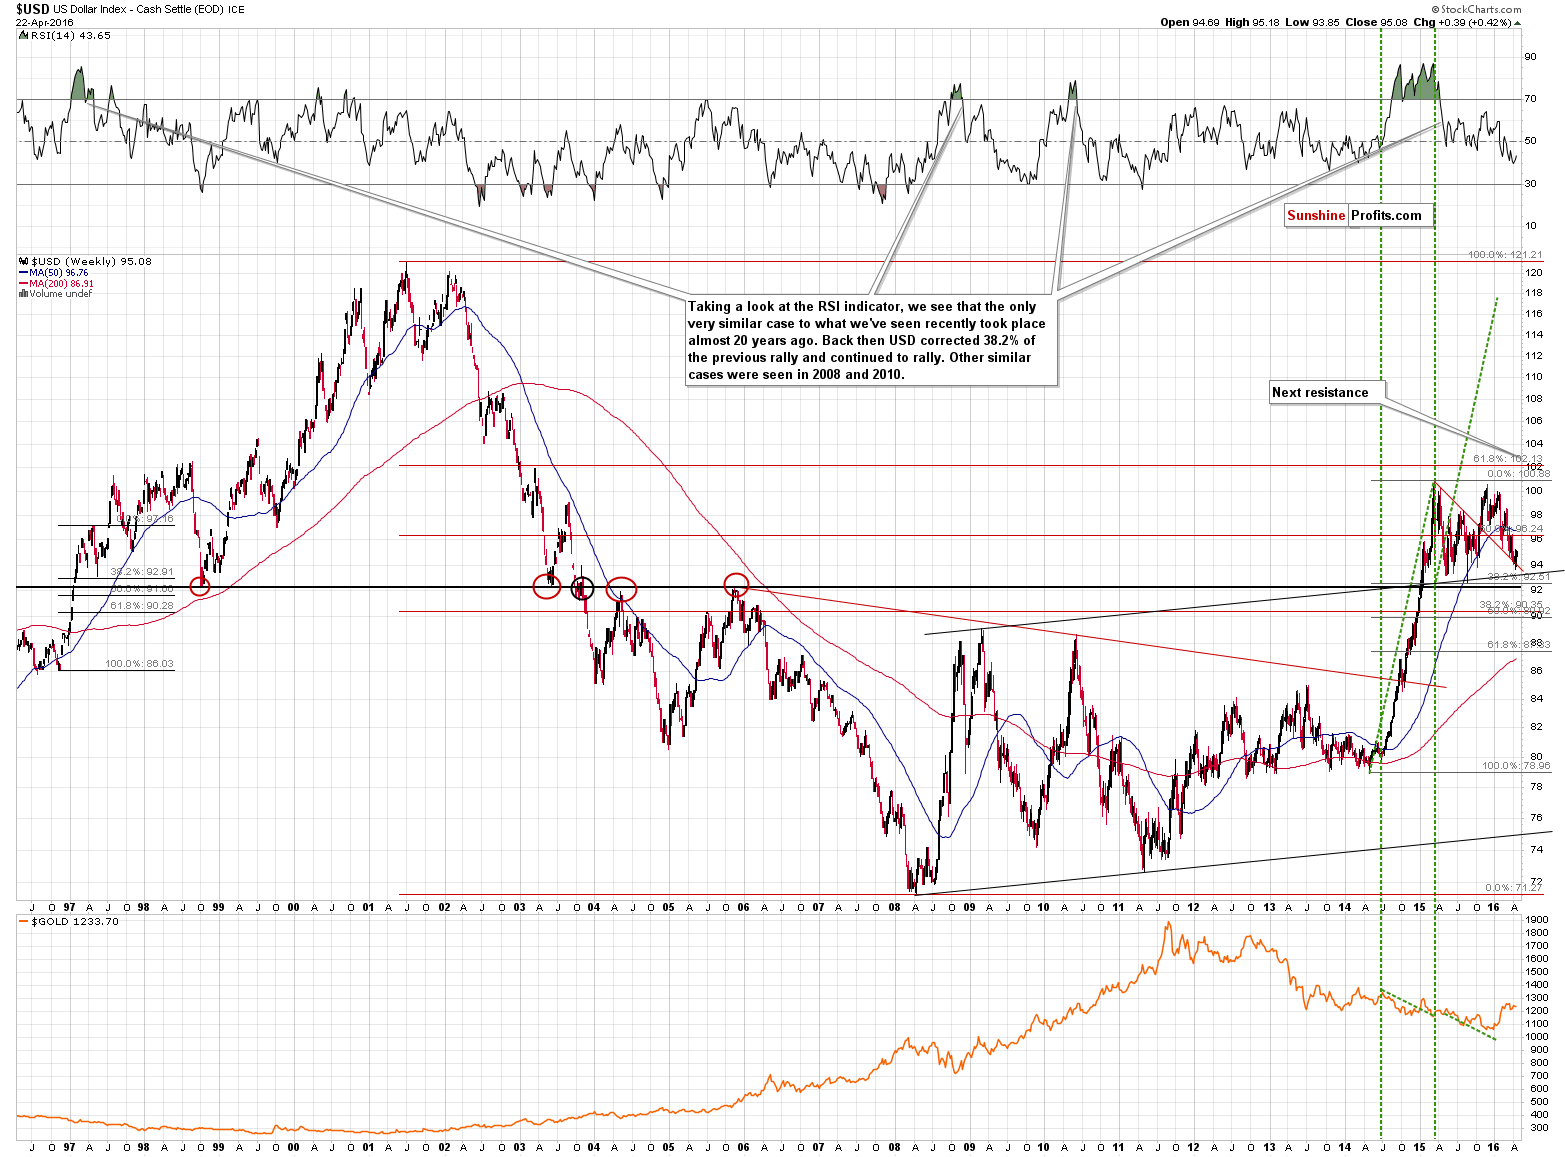
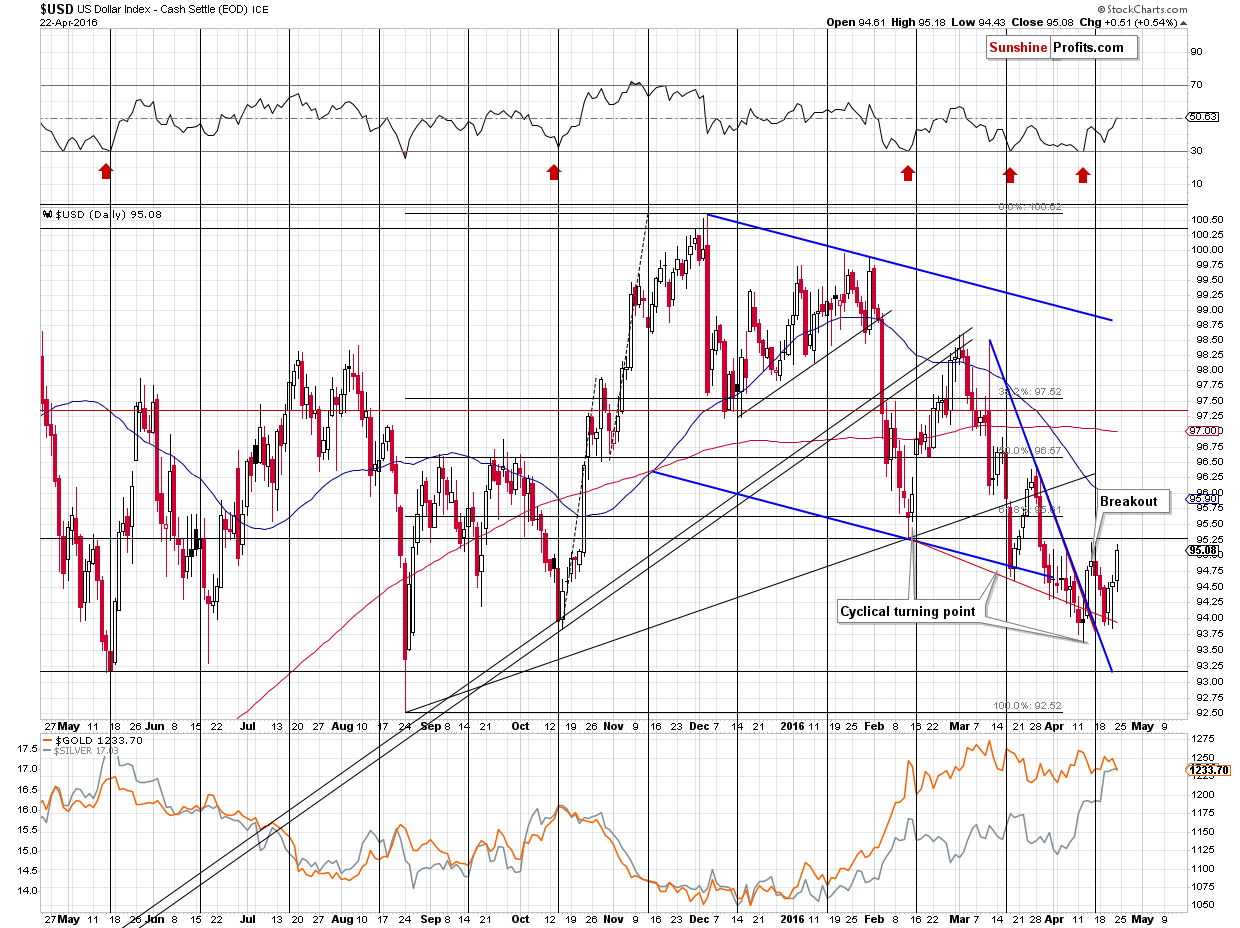
Meanwhile, our analysis of the USD Index remains up-to-date:
What was the likely reason behind the PM’s rally? The decline in the USD Index. The important thing is that despite this decline, the USD didn’t invalidate the previous breakout and that it didn’t move below the previous low. The outlook is still more bullish than it was about a week ago and the implications for the precious metals market continue to be bearish.
The USD moved higher once again on Friday, so the outlook remains bullish, especially that – as you can see on the long-term chart – the USD just bounced off the important declining red support line.
Summing up, silver is likely to move much higher in the coming years and so do gold and mining stocks, however, it seems likely that we will see another big decline before seeing much higher prices. Last week’s reversals and silver, gold, mining stocks and the USD Index suggest that the decline is already underway, even though we can’t rule out another temporary move higher.
Consequently, we think that a short position (full) in gold, silver and mining stocks is justified from the risk to reward point of view. It’s rather unclear, but it seems that the decline should start within the next several days and the decline could remain in place for a few months (no market moves in a straight line and there will be corrections, though).
As always, we will keep you – our subscribers – updated.
To summarize:
Trading capital (our opinion): Short positions (full) in gold, silver and mining stocks are justified from the risk/reward perspective with the following stop-loss orders and initial target price levels:
- Gold: initial target price: $973; stop-loss: $1,304, initial target price for the DGLD ETN: $89.05; stop-loss for the DGLD ETN $47.15
- Silver: initial target price: $12.13; stop-loss: $18.05, initial target price for the DSLV ETN: $61.16; stop-loss for DSLV ETN $26.80
- Mining stocks (price levels for the GDX ETF): initial target price: $9.34; stop-loss: $24.07, initial target price for the DUST ETF: $5.72; stop-loss for the DUST ETF $1.74
In case one wants to bet on junior mining stocks' prices (we do not suggest doing so – we think senior mining stocks are more predictable in the case of short-term trades – if one wants to do it anyway, we provide the details), here are the stop-loss details and initial target prices:
- GDXJ ETF: initial target price: $14.13; stop-loss: $36.37
- JDST ETF: initial target price: $8.86; stop-loss: $2.27
Long-term capital (our opinion): No positions
Insurance capital (our opinion): Full position
Plus, you might want to read why our stop-loss orders are usually relatively far from the current price.
Please note that a full position doesn’t mean using all of the capital for a given trade. You will find details on our thoughts on gold portfolio structuring in the Key Insights section on our website.
As a reminder – “initial target price” means exactly that – an “initial” one, it’s not a price level at which we suggest closing positions. If this becomes the case (like it did in the previous trade) we will refer to these levels as levels of exit orders (exactly as we’ve done previously). Stop-loss levels, however, are naturally not “initial”, but something that, in our opinion, might be entered as an order.
Since it is impossible to synchronize target prices and stop-loss levels for all the ETFs and ETNs with the main markets that we provide these levels for (gold, silver and mining stocks – the GDX ETF), the stop-loss levels and target prices for other ETNs and ETF (among other: UGLD, DGLD, USLV, DSLV, NUGT, DUST, JNUG, JDST) are provided as supplementary, and not as “final”. This means that if a stop-loss or a target level is reached for any of the “additional instruments” (DGLD for instance), but not for the “main instrument” (gold in this case), we will view positions in both gold and DGLD as still open and the stop-loss for DGLD would have to be moved lower. On the other hand, if gold moves to a stop-loss level but DGLD doesn’t, then we will view both positions (in gold and DGLD) as closed. In other words, since it’s not possible to be 100% certain that each related instrument moves to a given level when the underlying instrument does, we can’t provide levels that would be binding. The levels that we do provide are our best estimate of the levels that will correspond to the levels in the underlying assets, but it will be the underlying assets that one will need to focus on regarding the sings pointing to closing a given position or keeping it open. We might adjust the levels in the “additional instruments” without adjusting the levels in the “main instruments”, which will simply mean that we have improved our estimation of these levels, not that we changed our outlook on the markets. We are already working on a tool that would update these levels on a daily basis for the most popular ETFs, ETNs and individual mining stocks.
Our preferred ways to invest in and to trade gold along with the reasoning can be found in the how to buy gold section. Additionally, our preferred ETFs and ETNs can be found in our Gold & Silver ETF Ranking.
As always, we'll keep you - our subscribers - updated should our views on the market change. We will continue to send out Gold & Silver Trading Alerts on each trading day and we will send additional Alerts whenever appropriate.
The trading position presented above is the netted version of positions based on subjective signals (opinion) from your Editor, and the Tools and Indicators.
As a reminder, Gold & Silver Trading Alerts are posted before or on each trading day (we usually post them before the opening bell, but we don't promise doing that each day). If there's anything urgent, we will send you an additional small alert before posting the main one.
=====
Latest Free Trading Alerts:
Last week, the European Central Bank released its most recent monetary policy statement. What does it imply for the U.S. dollar and the gold market?
S&P 500 index remains relatively close to its last year's medium-term highs. Will it extend its over two-month long uptrend? Investors await more quarterly corporate earnings, economic data releases.
Stock Trading Alert: S&P 500 Below 2,100 Mark - Uptrend Reversal Or Just Correction?
=====
Hand-picked precious-metals-related links:
Gold Holds Decline as Traders Eye Fed, BOJ Meetings This Week
ScotiaMoccata: Commitments of Traders (CFTC)
Supply demand fundamentals gradually tightening for Platinum group metals
=====
In other news:
Global stocks, dollar stumble ahead of Fed, BOJ meetings
Yellen's Scope for Summer Rate Hike Widens as ECB Signals a Hold
Bond Inflation-Expectations Index Sets 9-Month High Before Fed
The Euro's Next Existential Crisis
DoubleLine's Gundlach says negative interest rates are a 'horror'
It's Dangerous Out There in the Bond Market
5 Things Most People Don’t Understand About the National Debt
Danger Signs in the World's Top Housing Market
CAT chairman pours cold water on mining rally
=====
Thank you.
Sincerely,
Przemyslaw Radomski, CFA
Founder, Editor-in-chief, Gold & Silver Fund Manager
Gold & Silver Trading Alerts
Forex Trading Alerts
Oil Investment Updates
Oil Trading Alerts

