

Briefly: In our opinion, small (half of the regular size) speculative short positions in gold, silver and mining stocks are justified from the risk/reward point of view.
Gold, silver and mining stocks soared once again yesterday, but we saw some kind of reversal in them and it was particularly visible in mining stocks. Does this signal a reversal?
Not all factors are in perfect alignment yet, but that might be the situation. In fact, the only thing that is missing is – as we described in yesterday’s second alert – the downside target being reached in the case of the USD Index. However, after re-examining the situation it seems that this may not be as important a factor. The reason is that during yesterday’s session the precious metals sector soared without the USD’s decline and then – later in the session – metals and miners moved lower despite a move lower in the USD Index as well. This change in the PMs-USD link is not yet confirmed, but today’s pre-market action suggests that metals and miners might indeed be able to decline on their own.
This, plus multiple other signals suggests that re-opening short positions (with half of the regular capital used for opening a position – at least for now) is justified from the risk to reward perspective. Let’s take a look at the charts (charts courtesy of http://stockcharts.com).
As far as gold is concerned, our previous comments regarding gold’s long-term chart remain up-to-date:
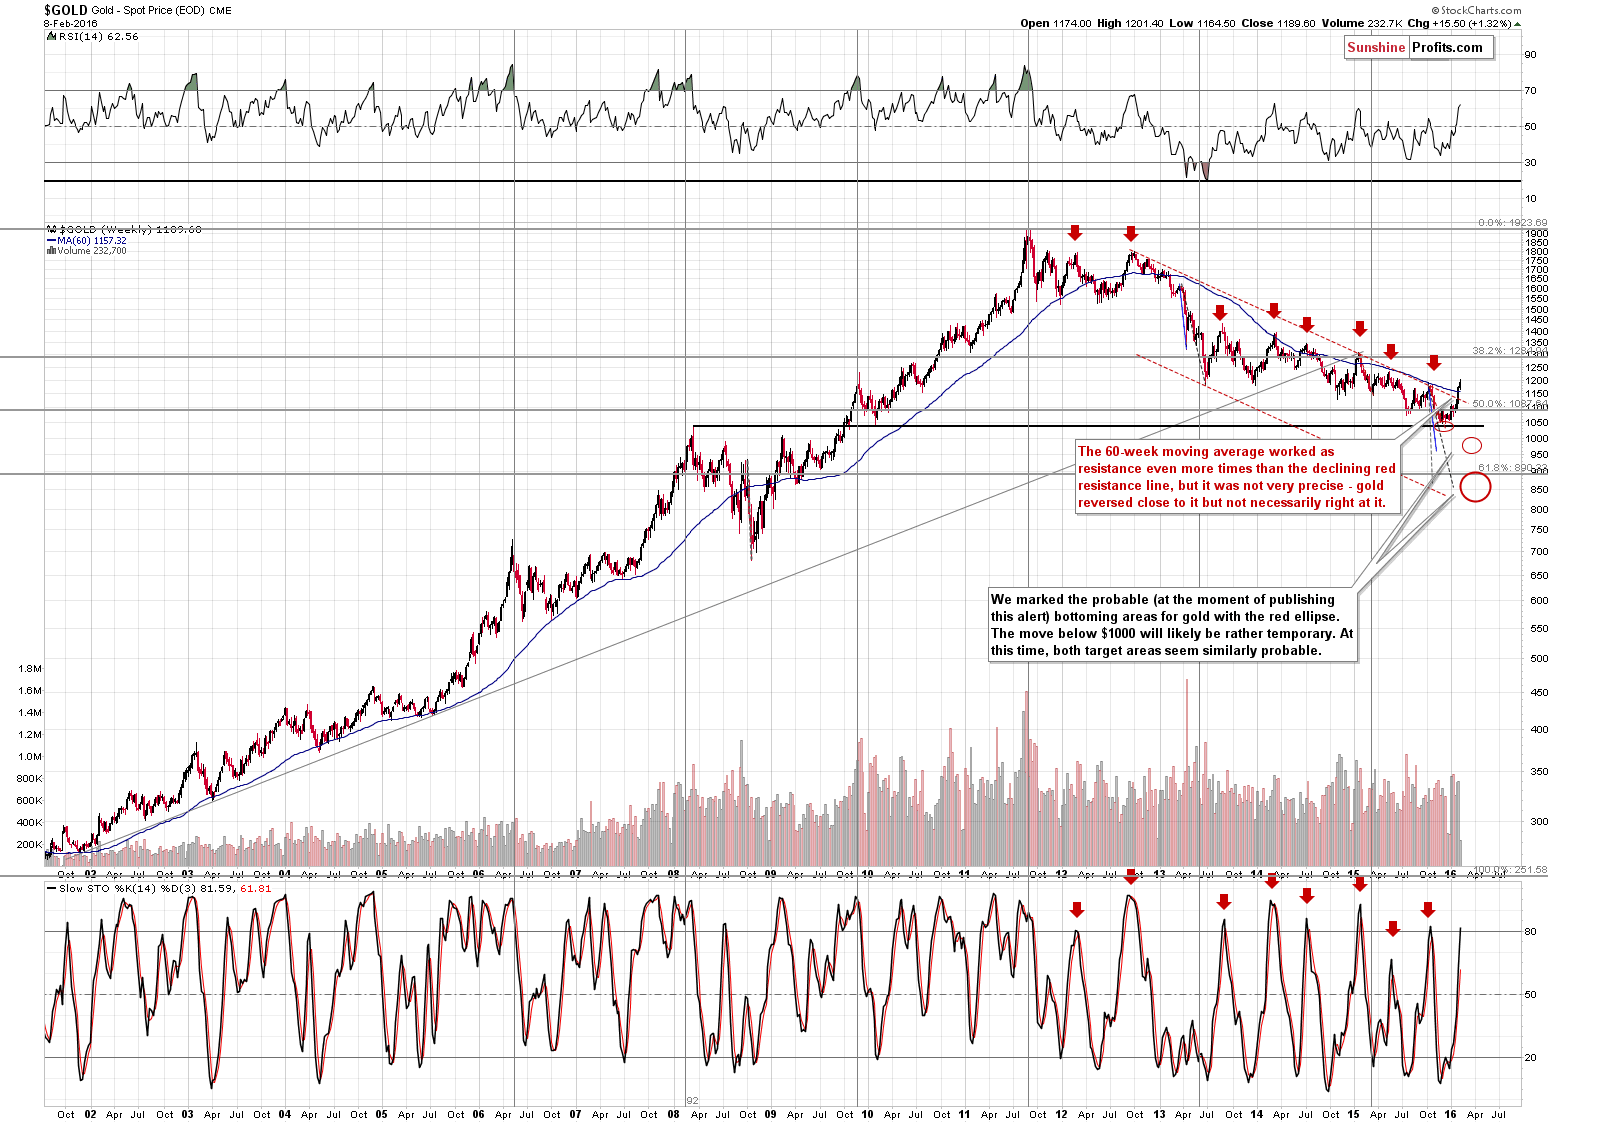
Gold moved to (and even above it on Friday) its 60-week moving average, which served as important resistance even more times than the declining red resistance line, so the medium-term outlook is still bearish. The problem with this line is that it stopped the previous rallies on an approximate basis – gold didn’t usually reverse right at it, but close to it. Consequently, the above chart doesn’t imply an immediate turnaround – it suggests that one will be seen relatively soon and that gold is not likely to move far (from the long-term point of view).
Gold moved visibly above the 60-week moving average – more or less as high as was the case in early 2015, when gold topped about $100 higher. This was the biggest move above this moving average, so it seems that the room for further rallies from here is also limited. Naturally, the above assumes that gold remains in a medium-term downtrend, which is most likely the case since we haven’t seen enough confirmations that the bottom is indeed in.
The RSI indicator also suggests a turnaround.
In yesterday’s alert we wrote the following:
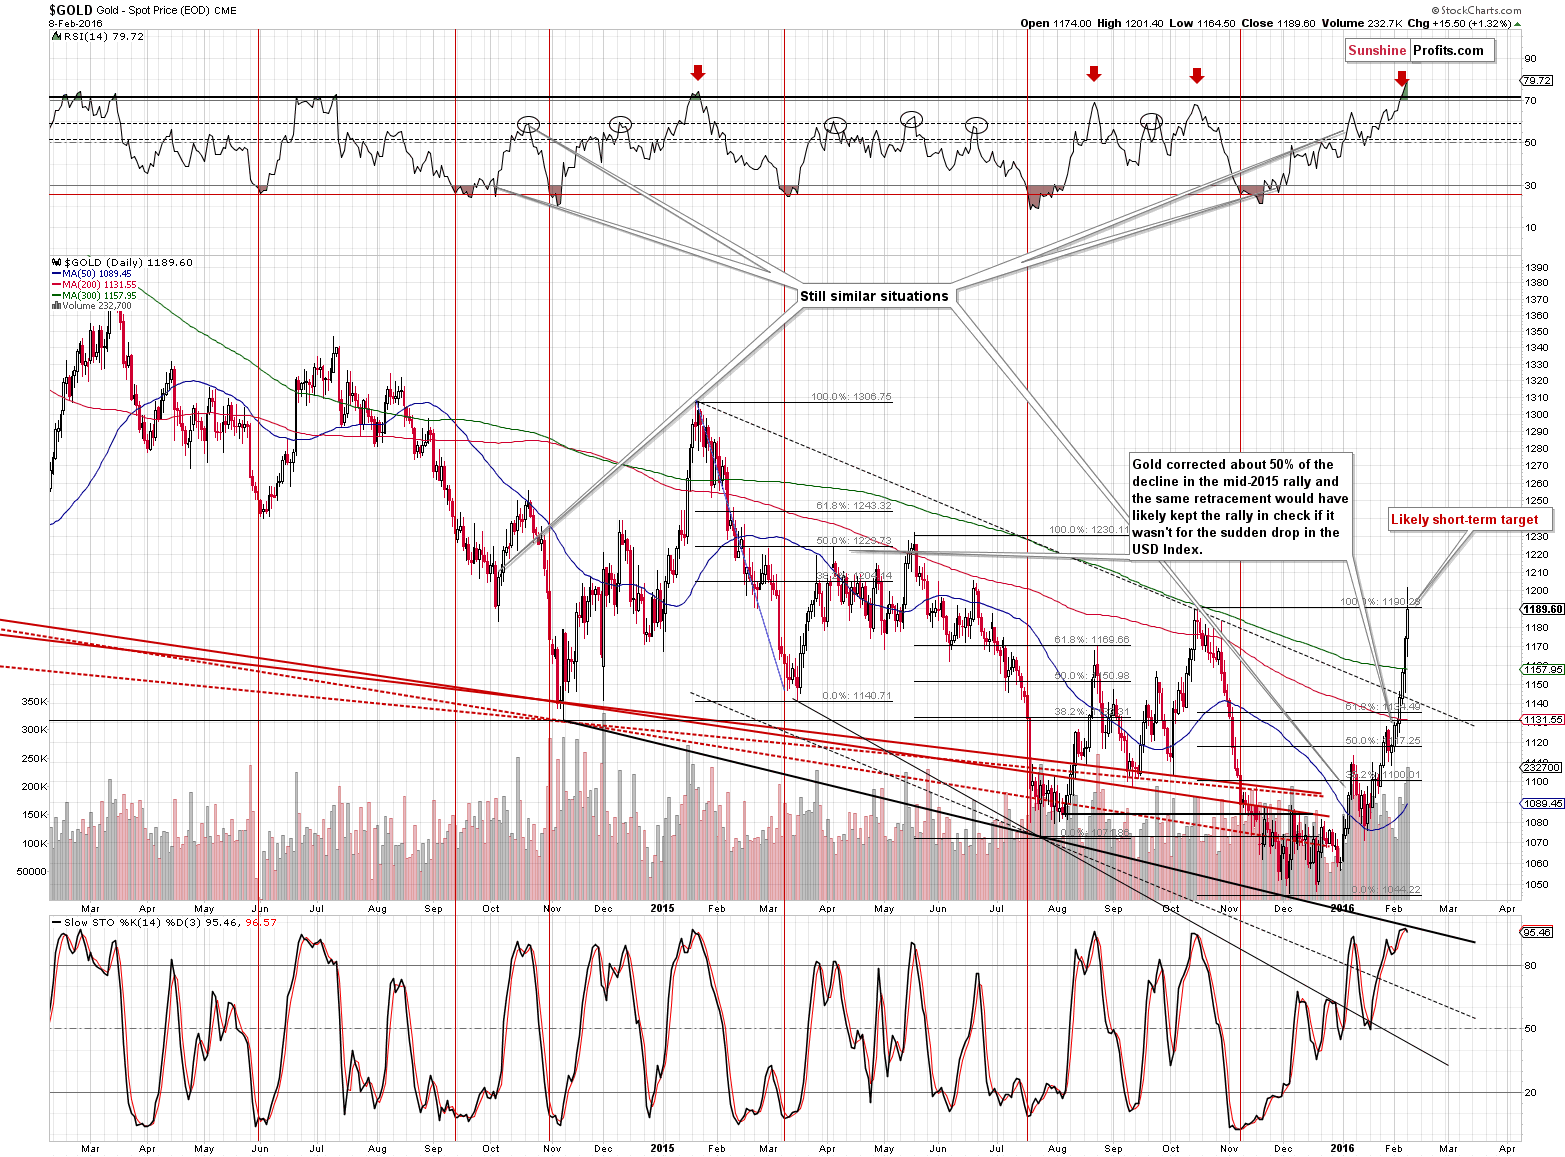
Gold moved higher after the breakout (despite an intra-day move lower, which only served as a verification of the breakout) and it seems that it will move even higher as no major resistance level was reached on Friday. The RSI remains extremely overbought, suggesting that the turnaround will be seen shortly, but gold itself didn’t move to a resistance level just yet. The next target for gold is created by the October 2015 high ($1,190) and the $1,200 level, being a round number, is a quite likely resistance as well. All in all, it seems that gold’s rally will be stopped about $15 - $25 higher, which is in tune with what we wrote while describing gold’s long-term chart.
Both targets were reached yesterday – on an intraday basis, gold moved a bit above $1,200 and it closed 40 cents below $1,190. The top is either in or very close to being in.
In yesterday’s alert we wrote the following on silver:
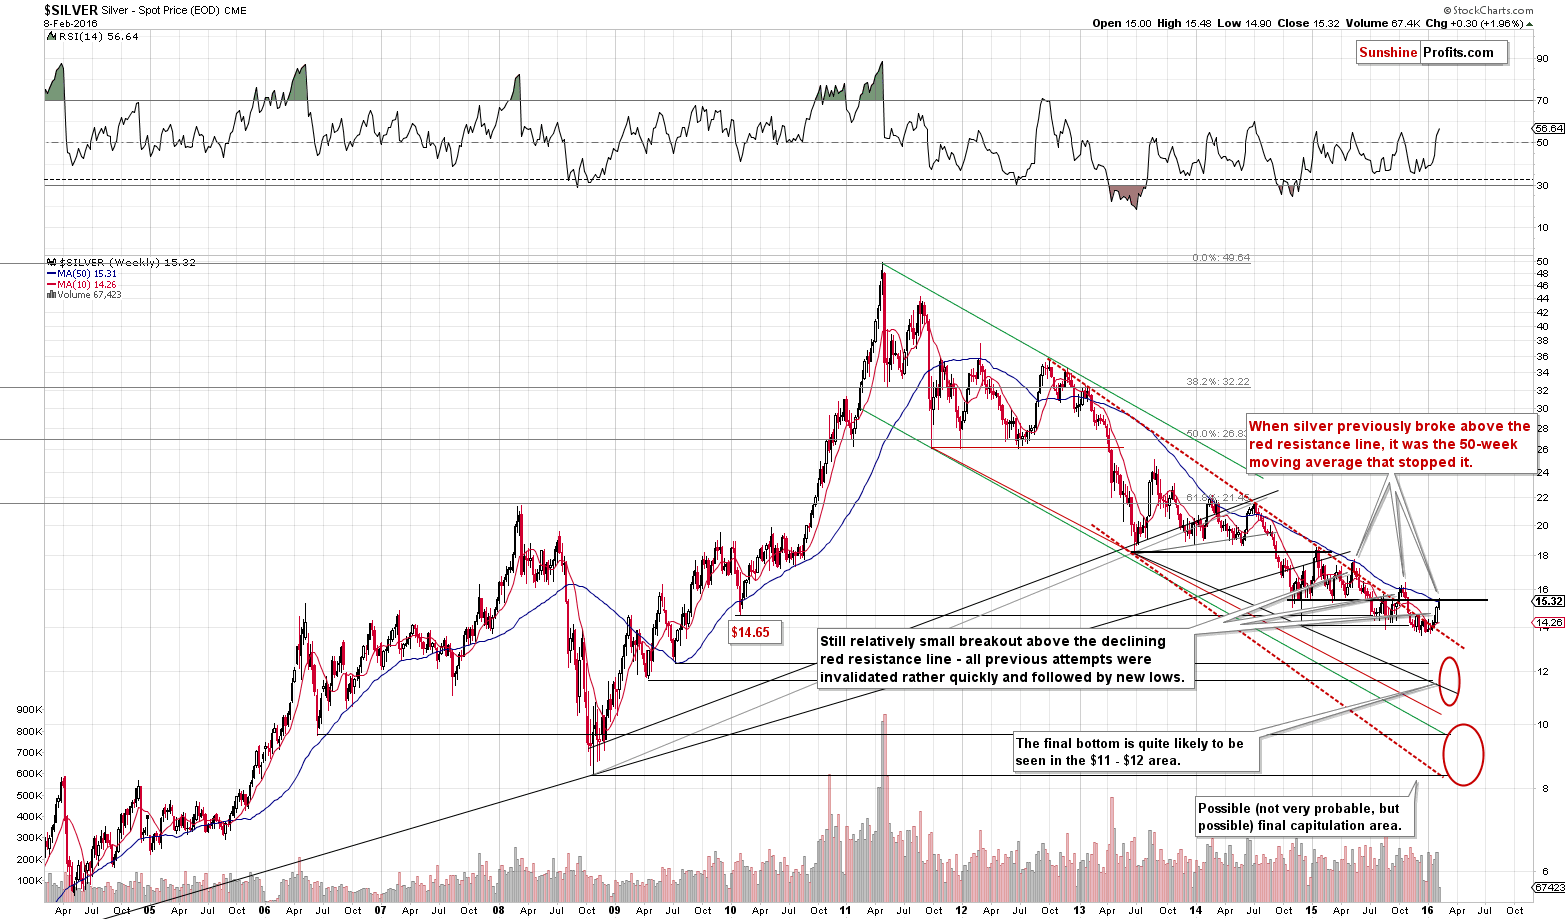
It’s too early to say anything bullish about silver at this time also because the previous breakouts above the declining red resistance were followed by invalidations. In these previous cases, silver moved to the 50-week moving average before reversing. This line coincides with the late-2014 lows, which make it a quite likely target level and a strong resistance. This moving average is currently at $15.34, so silver’s upside potential is rather limited.
Silver moved temporarily above the mentioned level (to $15.48) and it declined and closed below it (at $15.32) shortly thereafter. Consequently, the top may already be in.
As far as gold stocks are concerned, we previously wrote the following:
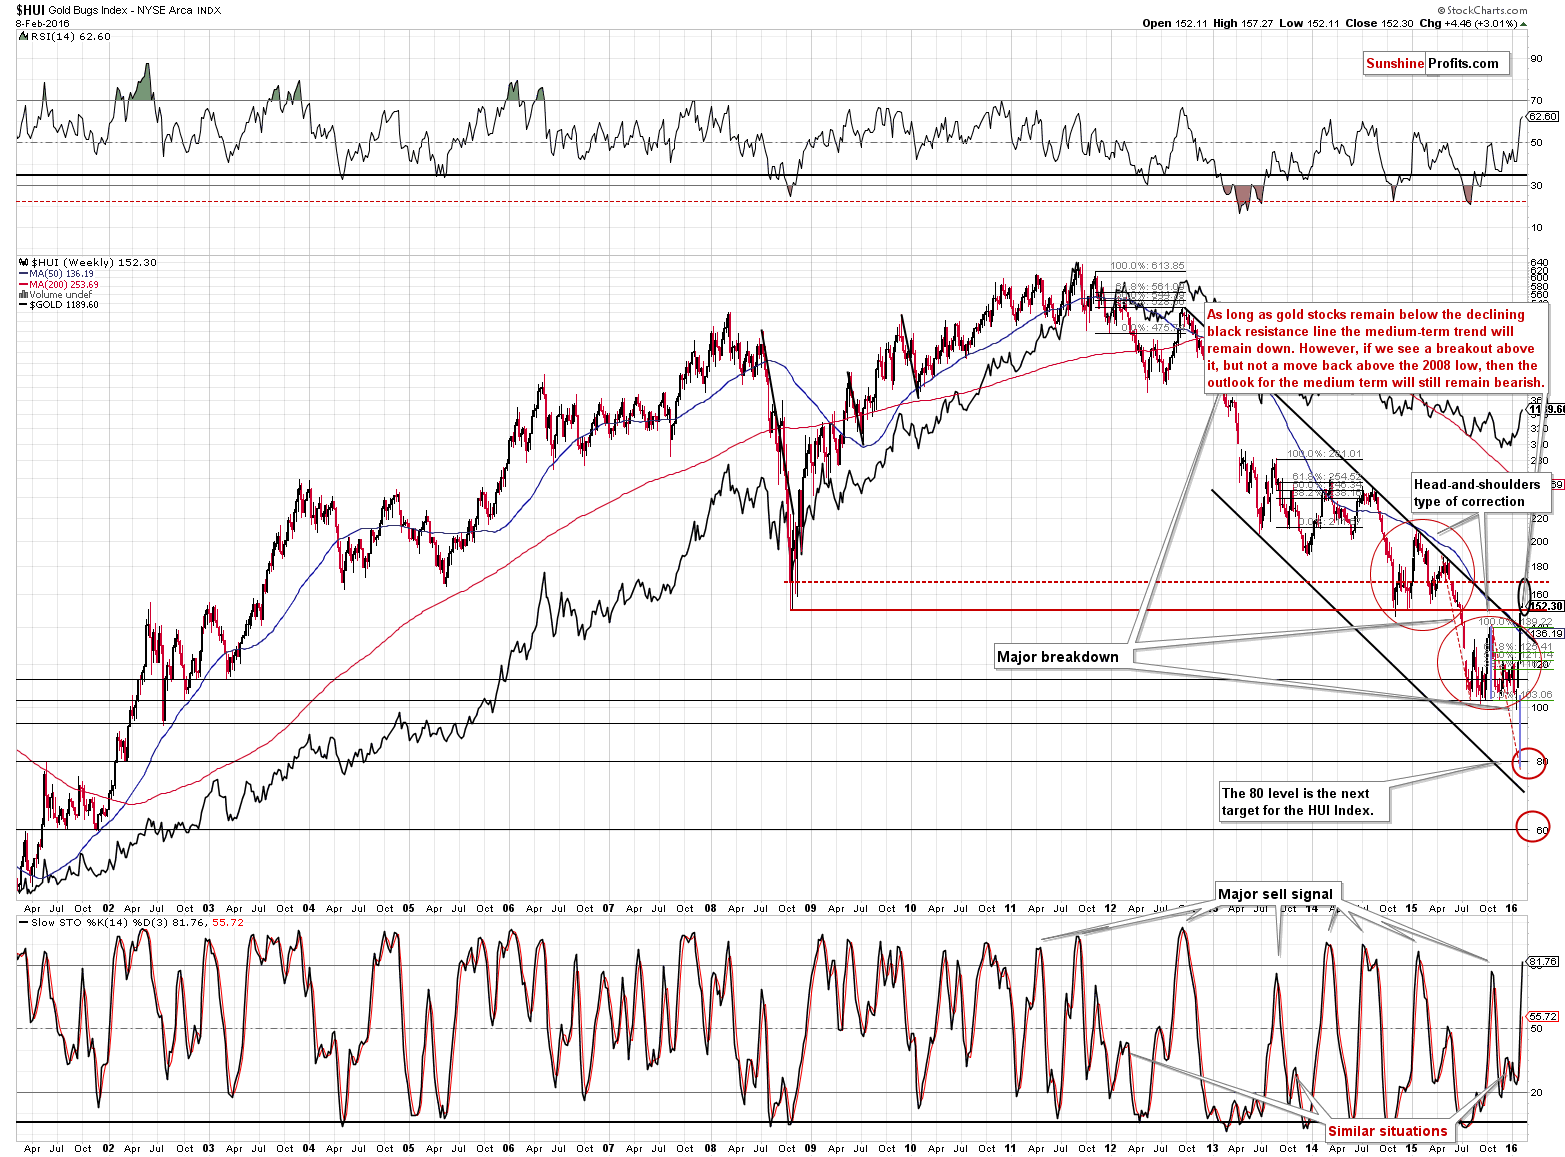
(…) the 2008 low became the next target and likely resistance line. In intra-day terms the resistance is at 150 but in case of weekly closes the resistance is close to 170, so any price between these levels is a likely target. The early 2015 low is a bit below 160, so it’s more likely that the final top will be seen below 160, than above it, but it’s rather unclear at this time.
The HUI Index rallied to 157.27 and then declined 5 index points, thus forming a quite visible reversal. It seems that mining stocks are suggesting that this rally may be over very soon or that it is already over.
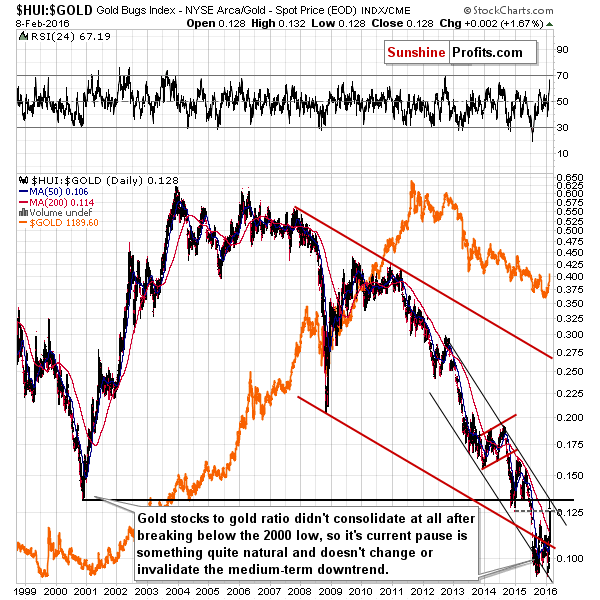
As far as the gold stocks to gold ratio is concerned, we wrote the following yesterday:
The performance of gold stocks relative to gold remains below its 2000 low as well. The recent move higher is significant on a short-term basis, but it is actually a verification of the previous breakdown – a move back to the broken level. The above chart features a support at the 2000 low, but also lower, at the 2015 low. Consequently, based on the gold stocks to gold relation, we could see an additional rally before a decline or we could see a turnaround right away.
The 2000 bottom was just reached and we can say the same about the declining resistance line. This is a strong indication that the top is already in or very close (in terms of price).
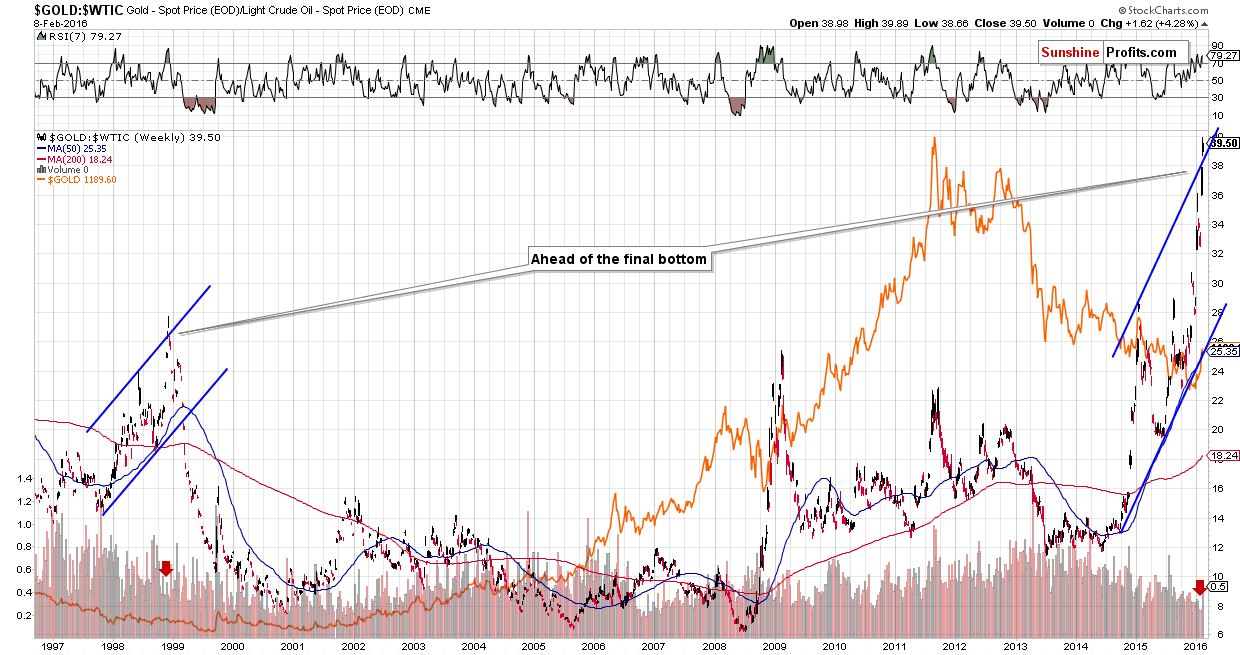
Finally, we would like to once again discuss the gold to oil ratio. In yesterday’s alert we wrote the following about the above:
It moved to a resistance level based on the rising trend channel. This is a sign of a top on its own, but the additional bearish factor here is that we saw a similar type of action (big zigzag) a few months before the 1999 bottom. Back then gold moved slightly above the resistance line for one week and then the ratio – and gold – declined once again.
The above is particularly interesting because the outlook for crude oil is negative (as we explained in the recent Oil Trading Alerts and the Oil Investment Update that was posted on Friday) and if both oil, and the gold to oil ratio move lower, then it means that gold is likely to decline particularly significantly.
The gold to oil ratio has once again moved sharply higher and is now above the upper border of the trading channel. Back in 1998 this marked the exact top. The implications are bearish.
Summing up, multiple resistance levels and targets were reached based on yesterday’s session and the link between gold and the USD weakened visibly in the final part of yesterday’s session and in today’s pre-market trading. Consequently, it seems that re-opening short positions in gold, silver and mining stocks is now justified from the risk/reward perspective. Once metals and miners prove their ability to decline despite lack of rally in the USD or if we see a bottom in the USD, we will likely double the size of the position, but it is not the case at this time.
As always, we will keep you – our subscribers – updated.
To summarize:
Trading capital (our opinion): Short positions (half) in gold, silver and mining stocks are justified from the risk/reward perspective with the following stop-loss orders and initial target price levels:
- Gold: initial target price: $973; stop-loss: $1,242, initial target price for the DGLD ETN: $100.97; stop-loss for the DGLD ETN $56.67
- Silver: initial target price: $12.13; stop-loss: $15.82, initial target price for the DSLV ETN: $80.81; stop-loss for DSLV ETN $44.87
- Mining stocks (price levels for the GDX ETF): initial target price: $10.23; stop-loss: $18.91, initial target price for the DUST ETF: $15.05; stop-loss for the DUST ETF $5.05
In case one wants to bet on junior mining stocks' prices (we do not suggest doing so – we think senior mining stocks are more predictable in the case of short-term trades – if one wants to do it anyway, we provide the details), here are the stop-loss details and initial target prices:
- GDXJ ETF: initial target price: $15.23; stop-loss: $24.33
- JDST ETF: initial target price: $31.29; stop-loss: $12.39
Long-term capital (our opinion): No positions
Insurance capital (our opinion): Full position
Plus, you might want to read why our stop-loss orders are usually relatively far from the current price.
Please note that a full position doesn’t mean using all of the capital for a given trade. You will find details on our thoughts on gold portfolio structuring in the Key Insights section on our website.
As a reminder – “initial target price” means exactly that – an “initial” one, it’s not a price level at which we suggest closing positions. If this becomes the case (like it did in the previous trade) we will refer to these levels as levels of exit orders (exactly as we’ve done previously). Stop-loss levels, however, are naturally not “initial”, but something that, in our opinion, might be entered as an order.
Since it is impossible to synchronize target prices and stop-loss levels for all the ETFs and ETNs with the main markets that we provide these levels for (gold, silver and mining stocks – the GDX ETF), the stop-loss levels and target prices for other ETNs and ETF (among other: UGLD, DGLD, USLV, DSLV, NUGT, DUST, JNUG, JDST) are provided as supplementary, and not as “final”. This means that if a stop-loss or a target level is reached for any of the “additional instruments” (DGLD for instance), but not for the “main instrument” (gold in this case), we will view positions in both gold and DGLD as still open and the stop-loss for DGLD would have to be moved lower. On the other hand, if gold moves to a stop-loss level but DGLD doesn’t, then we will view both positions (in gold and DGLD) as closed. In other words, since it’s not possible to be 100% certain that each related instrument moves to a given level when the underlying instrument does, we can’t provide levels that would be binding. The levels that we do provide are our best estimate of the levels that will correspond to the levels in the underlying assets, but it will be the underlying assets that one will need to focus on regarding the sings pointing to closing a given position or keeping it open. We might adjust the levels in the “additional instruments” without adjusting the levels in the “main instruments”, which will simply mean that we have improved our estimation of these levels, not that we changed our outlook on the markets. We are already working on a tool that would update these levels on a daily basis for the most popular ETFs, ETNs and individual mining stocks.
Our preferred ways to invest in and to trade gold along with the reasoning can be found in the how to buy gold section. Additionally, our preferred ETFs and ETNs can be found in our Gold & Silver ETF Ranking.
As always, we'll keep you - our subscribers - updated should our views on the market change. We will continue to send out Gold & Silver Trading Alerts on each trading day and we will send additional Alerts whenever appropriate.
The trading position presented above is the netted version of positions based on subjective signals (opinion) from your Editor, and the Tools and Indicators.
As a reminder, Gold & Silver Trading Alerts are posted before or on each trading day (we usually post them before the opening bell, but we don't promise doing that each day). If there's anything urgent, we will send you an additional small alert before posting the main one.
=====
Latest Free Trading Alerts:
More and more people are worried about a recession in 2016. Several investment banks have raised the likelihood of a U.S. or global recession in recent weeks. Even George Soros has recently warned of an impending financial markets crisis. Is the next recession coming? What does it imply for the gold market?
Is a Recession Looming? Will It Boost Gold?
=====
Hand-picked precious-metals-related links:
Goldman No Believer in Gold Rally as Fed to Hike Three Times
Gold price bumps along the bottom: BAML
Anglo Platinum sees supply cliff as mines investment dries up
Randgold raises dividend despite profit slump
=====
In other news:
Global stocks hit the rocks after Asian markets slump
Emerging-Market Stocks, Currencies Drop as Investors Seek Havens
Global Bond Rally Near `Panic' Level With Japan Yield Below Zero
Japan stocks plunge as investors seek refuge in bonds
Bonds Follow Bank of Japan Into Negative Territory
Five reasons behind US bank stocks sell-off
IEA Raises Estimate of Surplus Oil Supply on Higher OPEC Output
=====
Thank you.
Sincerely,
Przemyslaw Radomski, CFA
Founder, Editor-in-chief
Gold & Silver Trading Alerts
Forex Trading Alerts
Oil Investment Updates
Oil Trading Alerts

