

Briefly: In our opinion, no speculative positions in gold, silver and mining stocks are justified from the risk/reward point of view. We plan to open short positions relatively soon (within a week, possibly this week).
Gold, silver and mining stocks rallied significantly this week and many investors claim that the final bottom is already behind us and that much higher prices are to be expected shortly. Is this really the case or will we see a reversal any day now?
In our opinion, the latter is much more likely. We summarized yesterday’s alert by writing the following:
The most important thing is that we haven’t seen enough confirmations that the final bottom is already in. This means that the final bottom is most likely ahead and thus that we are likely to see prices below the previous lows. Consequently, whatever move happens to the upside in the meantime, it’s likely to be erased, just like the current rally. Whatever profits that have not been made yet through short positions are likely to be made likely quite soon.
The above remains up-to-date – the next big (bigger than the current move higher) move is likely to be to the downside. The key question is if the reversal happens shortly or after an additional rally. Let’s take a look at the charts to find the answer (charts courtesy of http://stockcharts.com). This time we’ll start with the USD Index, since it is the likely reason behind this week’s rally.
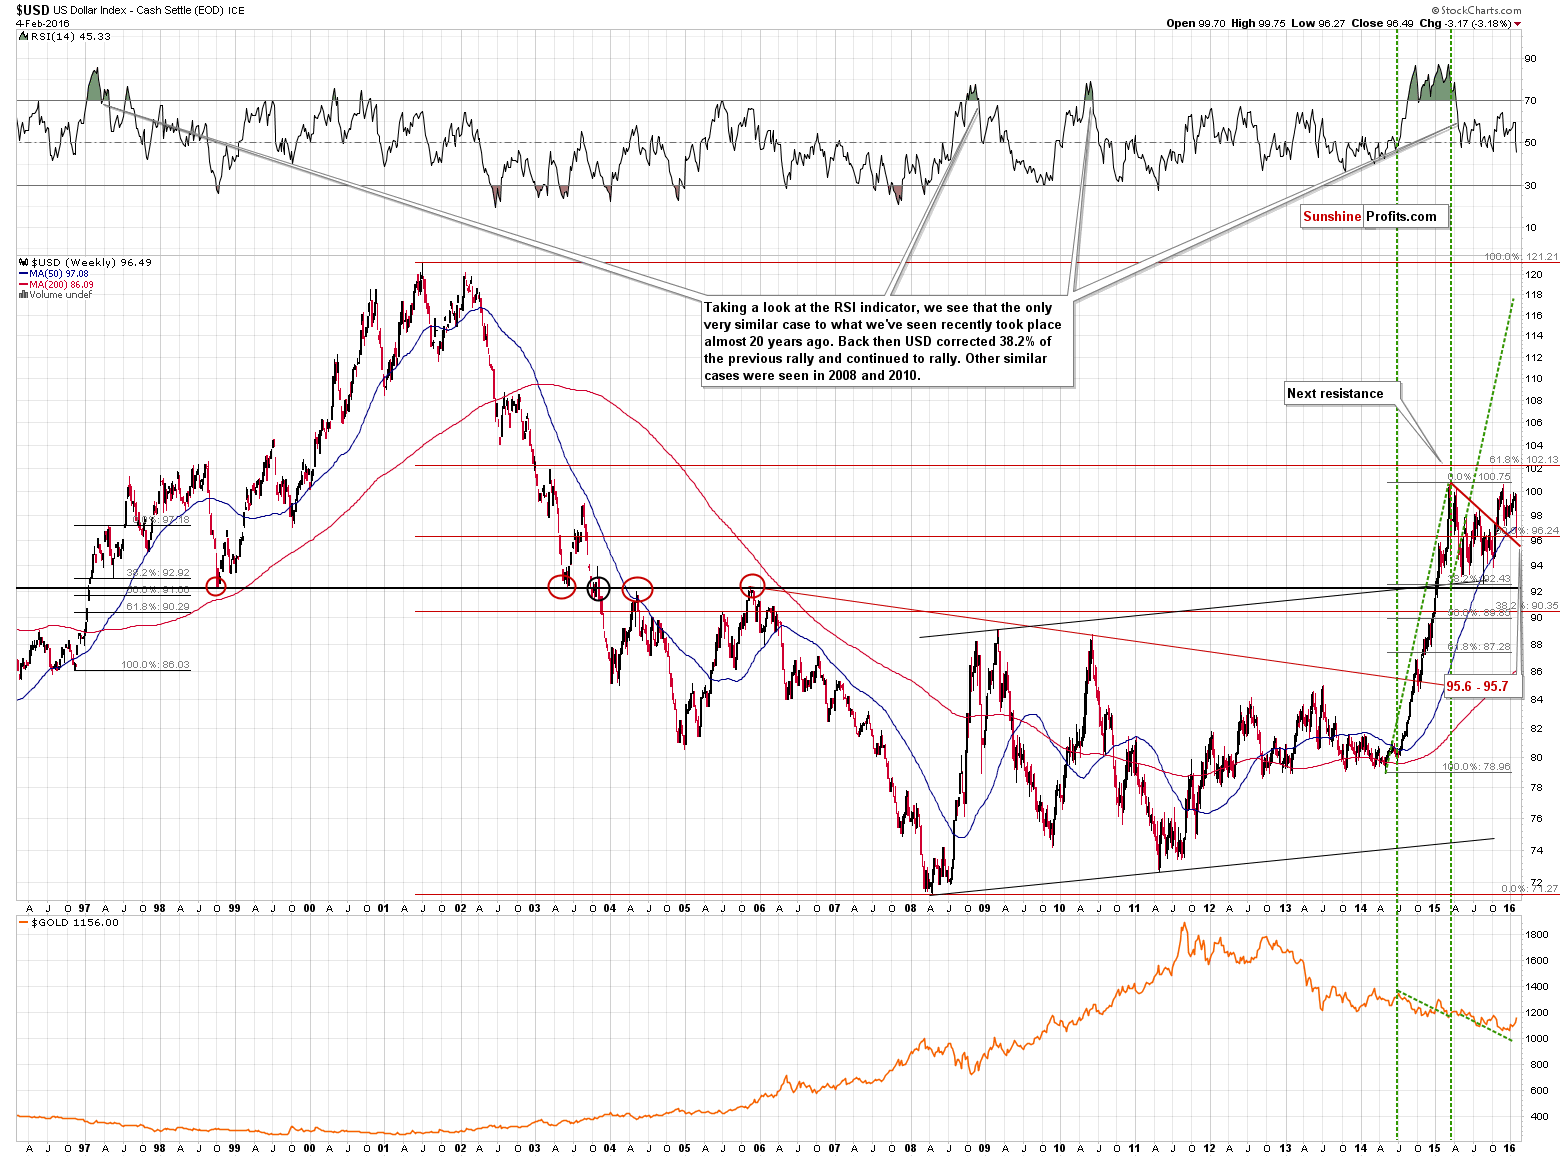
The above very long-term chart shows that the recent decline doesn’t change very much. It’s just a post-breakout correction. The USD Index broke above the declining red resistance line and rallied to 100 several weeks ago. It is now correcting this move. The likely target based on the above is the red line – which would now be verified as support. The line is currently at 95.7 but before it is reached it might move (being a declining line) to 95.6. That’s much lower than where the USD is today, but given the momentum that we’ve seen this week, we could see this level reached in just one session.
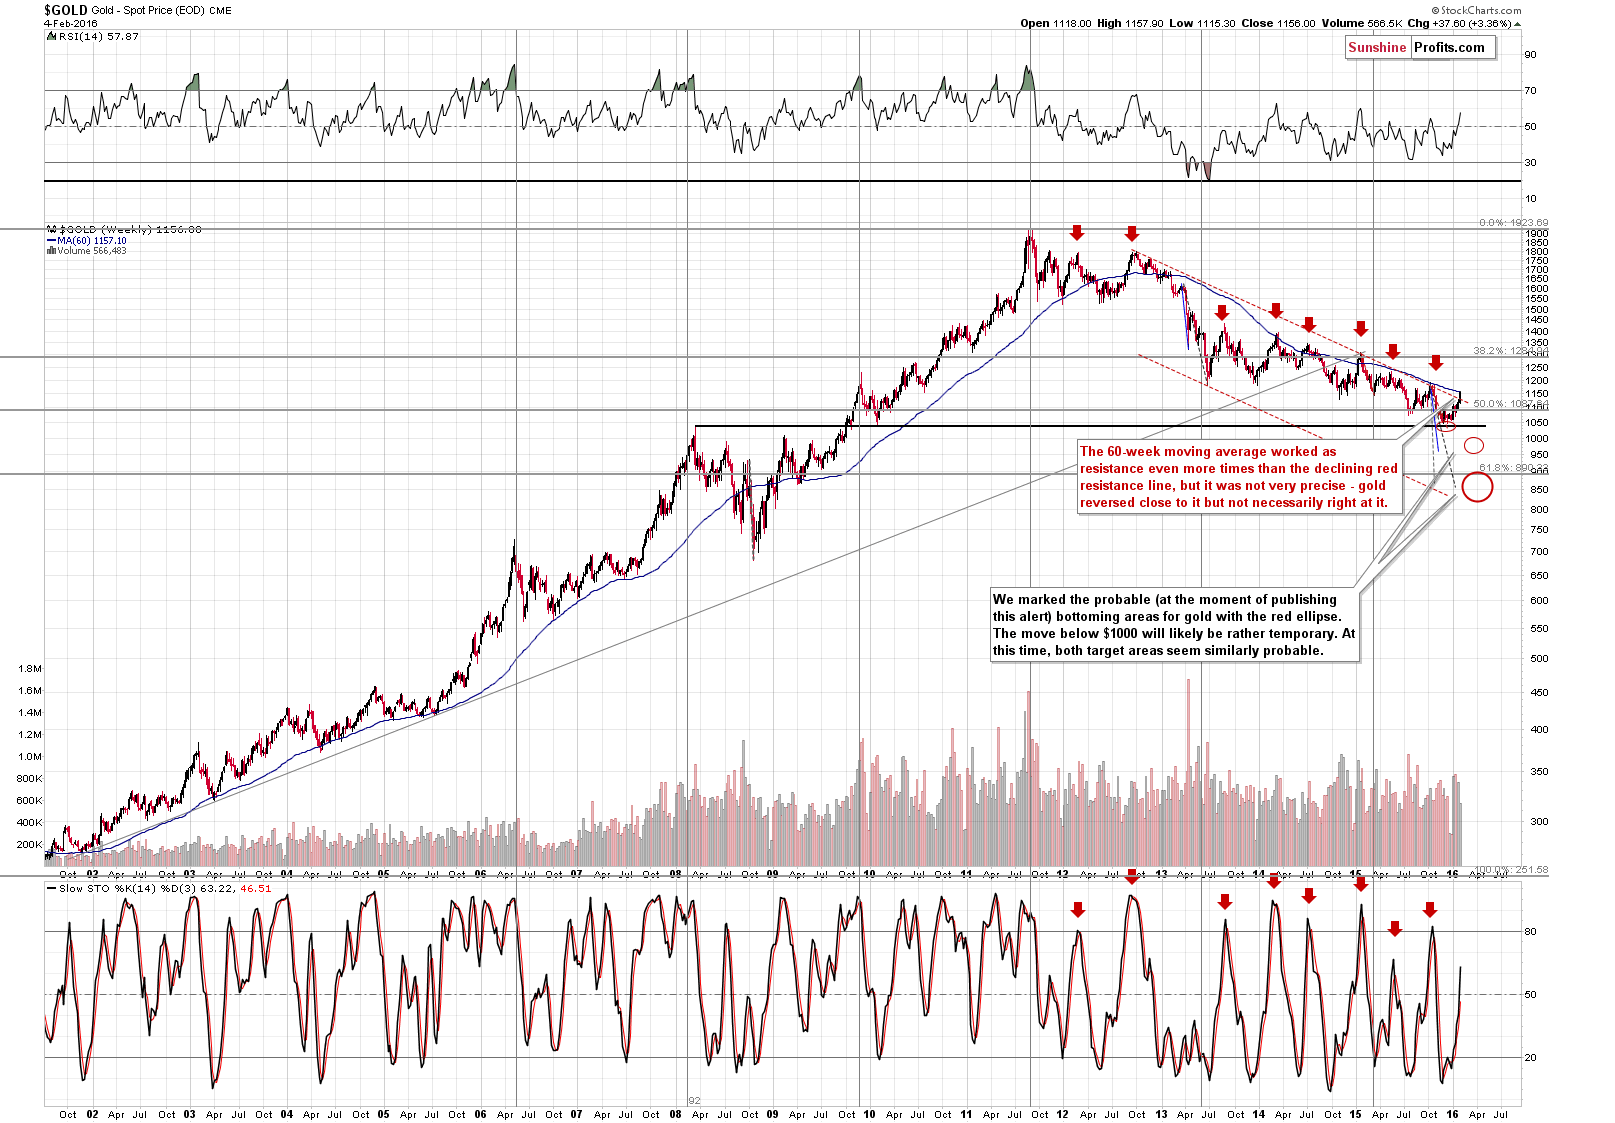
Gold moved to its 60-week moving average, which served as important resistance even more times than the declining red resistance line, so the medium-term outlook is still bearish. The problem with this line is that it stopped the previous rallies on an approximate basis – gold didn’t usually reverse right at it, but close to it. Consequently, the above chart doesn’t imply an immediate turnaround – it suggests that one will be seen relatively soon and that gold is not likely to move far (from the long-term point of view).
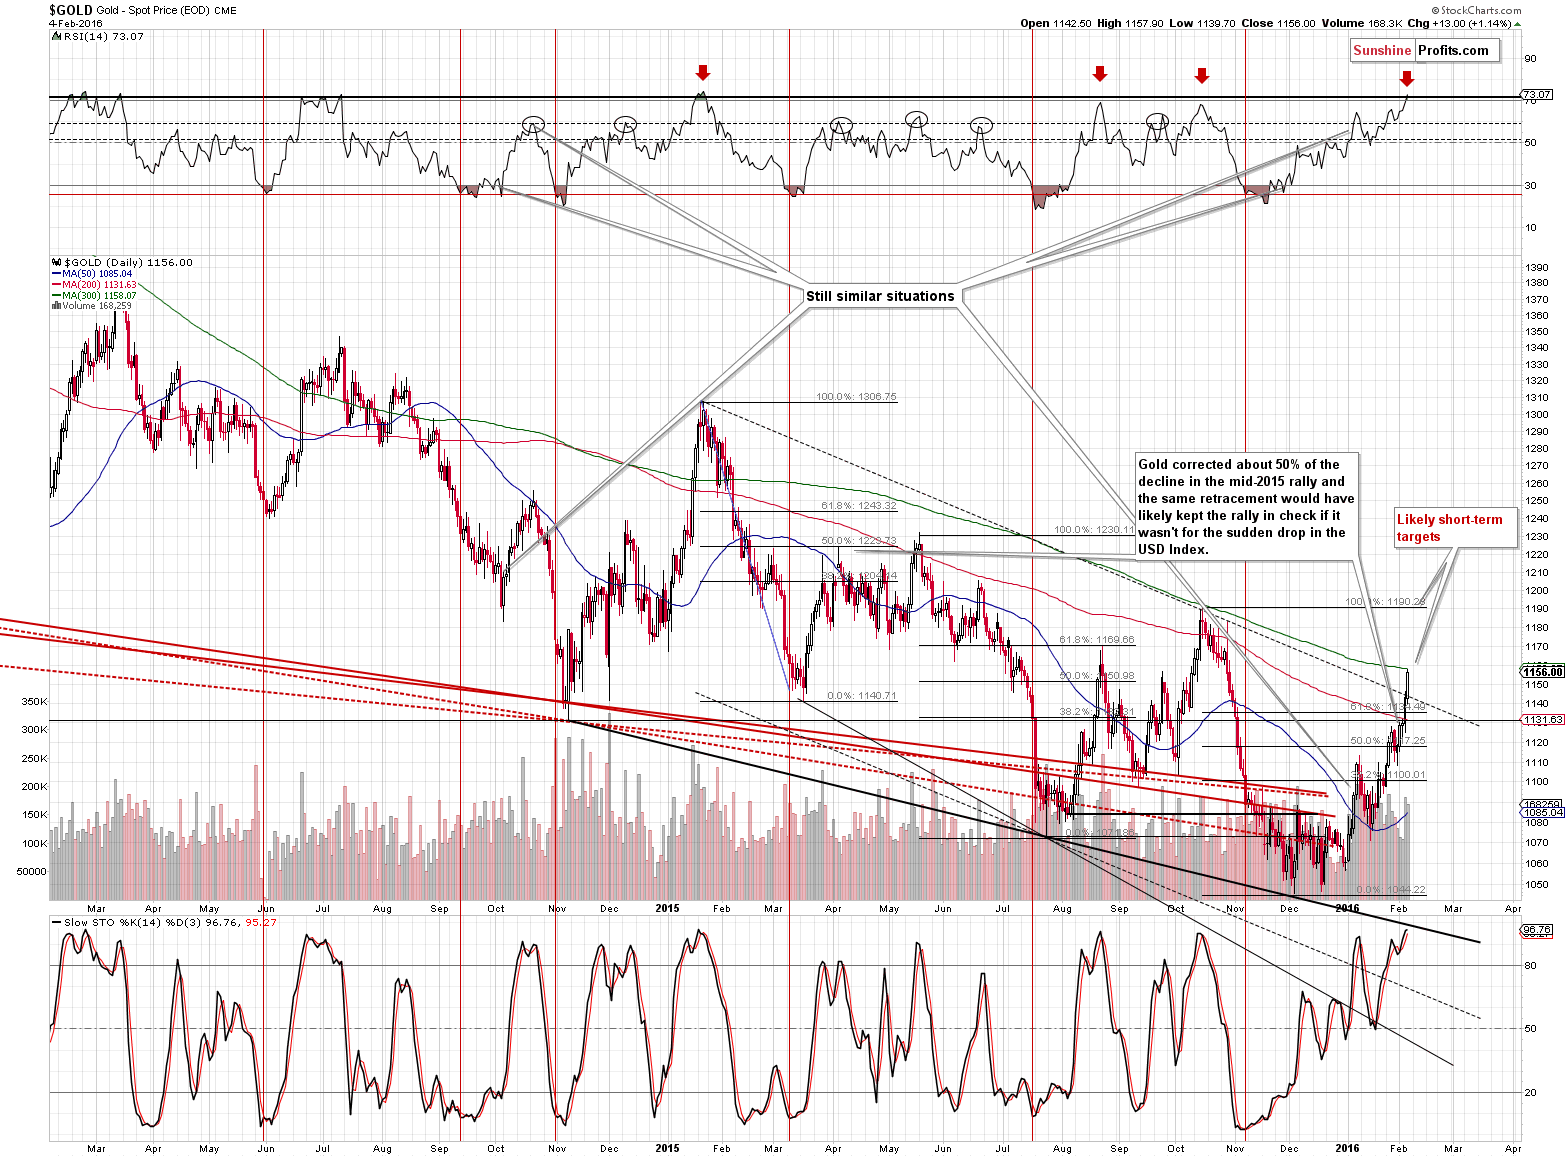
From the short-term point of view, we have just seen a breakout above the declining resistance line – the breakout is not confirmed, but still, the situation improved based on it. The RSI indicator is at the 70 level, which is a sell signal, but in light of the recent breakout we need to consider whether this signal is already very important or does it suggest that a turnaround can be seen in a few days. Back in January 2015 RSI was also above 70, but gold rallied for a few more days before turning south again. Consequently, it seems that a turnaround is close, but it’s not certain that it’s here just yet.
In yesterday’s alert we commented on silver in the following way:
Silver rallied sharply yesterday, but those who have been following our analyses and the precious metals market for long know that silver’s breakouts and outperformance is often a sign of a coming decline. The size of the volume and the size of the rally make yesterday’s session similar to what happened in late October 2015 and overall it seems too early to say that silver’s move higher really had bullish implications. Please note that if the post-October-2015 slide repeats, silver will erase all the recent rallies relatively quickly and then move to new lows.
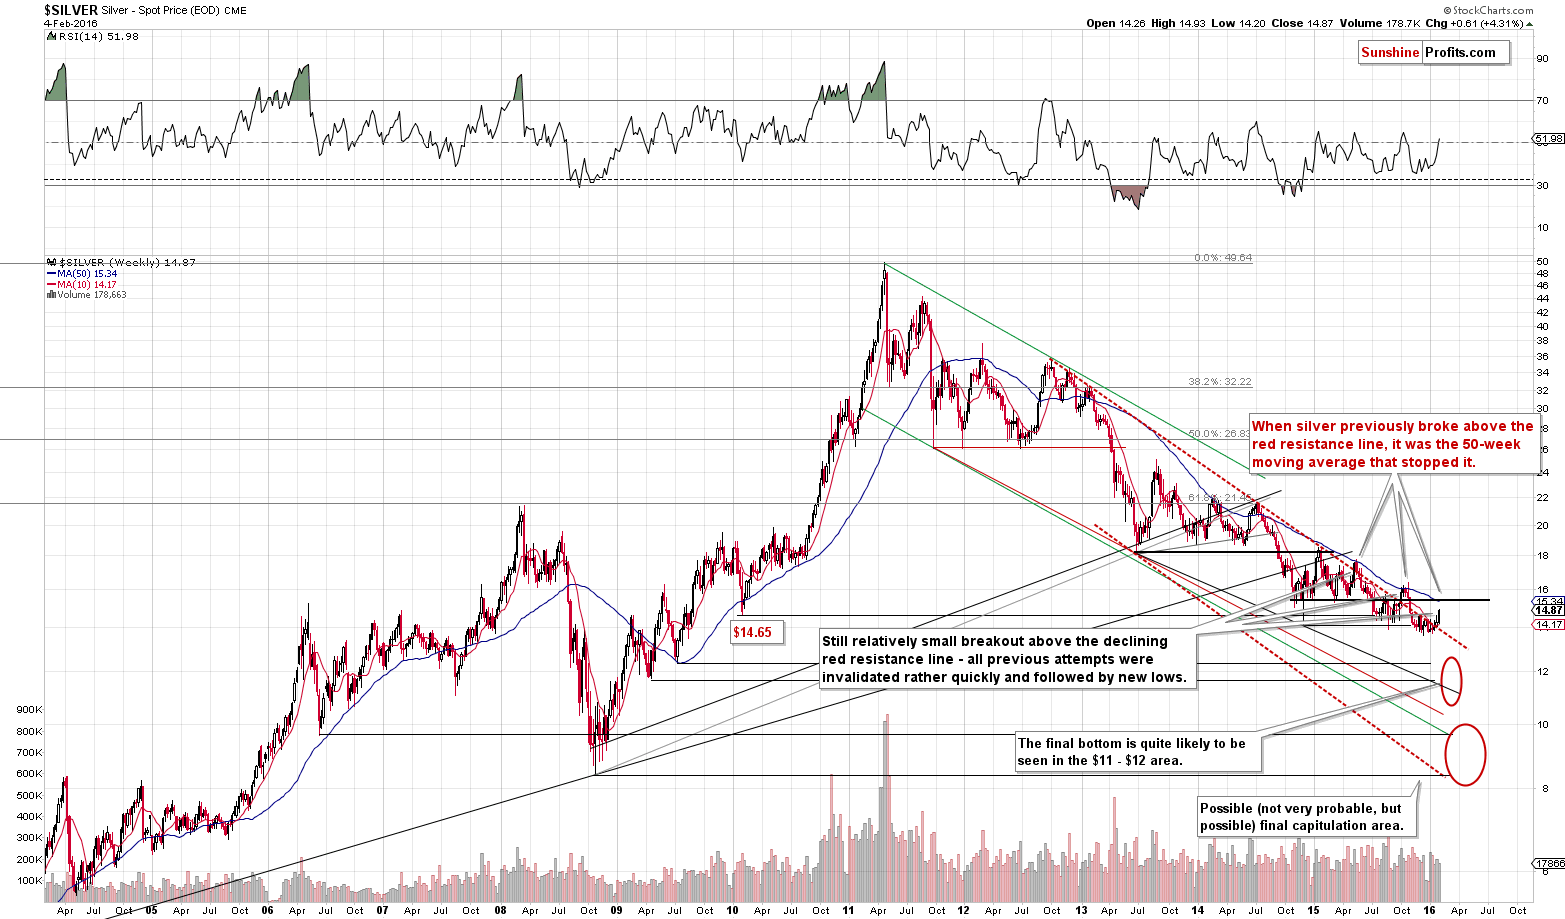
The above remains up-to-date. It’s too early to say anything bullish about silver at this time also because the previous breakouts above the declining red resistance were followed by invalidations. In these previous cases, silver moved to the 50-week moving average before reversing. This line coincides with the late-2014 lows, which make it a quite likely target level and a strong resistance. This moving average is currently at $15.34, so silver’s upside potential is rather limited.
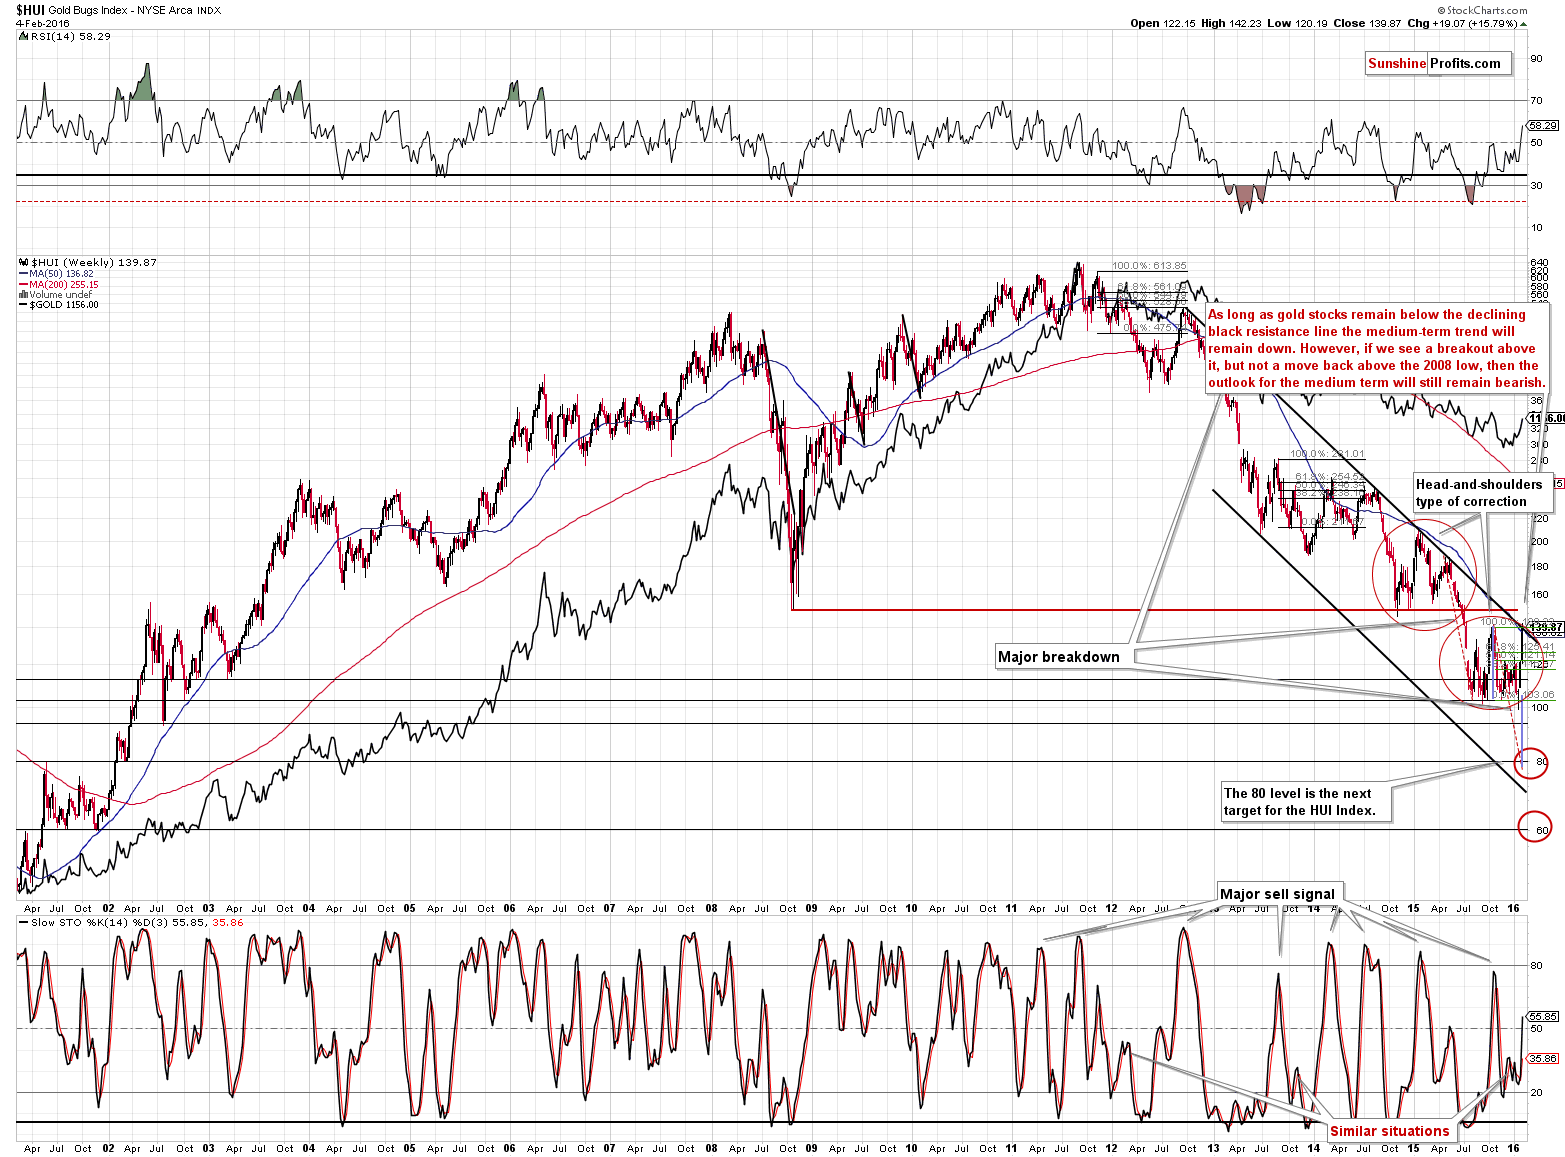
The HUI Index moved right to the long-term declining resistance line. This line stopped last year’s rallies and it’s very likely to stop the current one as well. This is a strong signal that the decline will resume right away. However, if that doesn’t happen and gold stocks move even higher, it will not be very bullish as long as miners remain below the 2008 low. In fact, in case of a breakout above the declining resistance line, the 2008 low would become the likely target.
In case of the gold stocks to the general stock market ratio we have already seen a breakout and a move to an important low. Consequently, the rally could already be over, but if not, there is another likely target level at the upper declining resistance line.
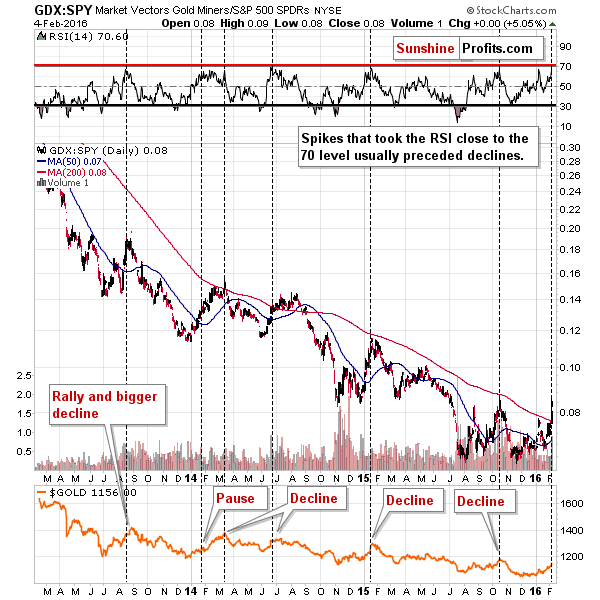
Looking at a similar relationship (only using other proxies for miners and stocks) we have a sell signal because the RSI indicator moved to the 70 level and this is something that we’ve seen at previous local tops. Still, there were cases when gold moved just a bit higher after this signal and then declined.
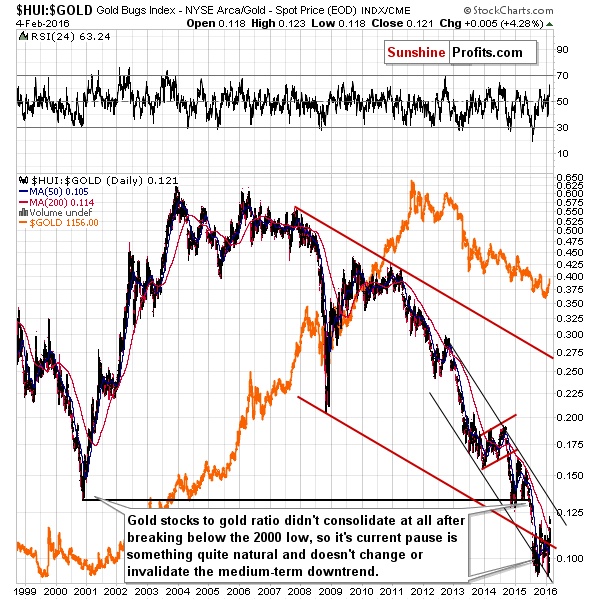
The gold stocks to gold ratio suggests that we might see higher prices in the short term as the ratio hasn’t moved to an important resistance level just yet. In this case, the 2000 bottom and the declining resistance line seem to be the likely targets.
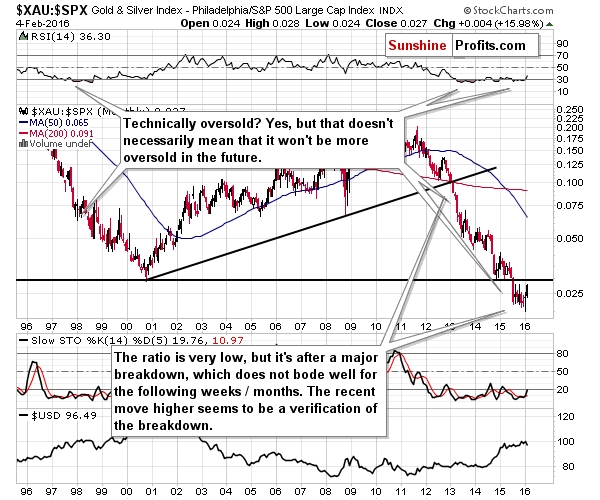
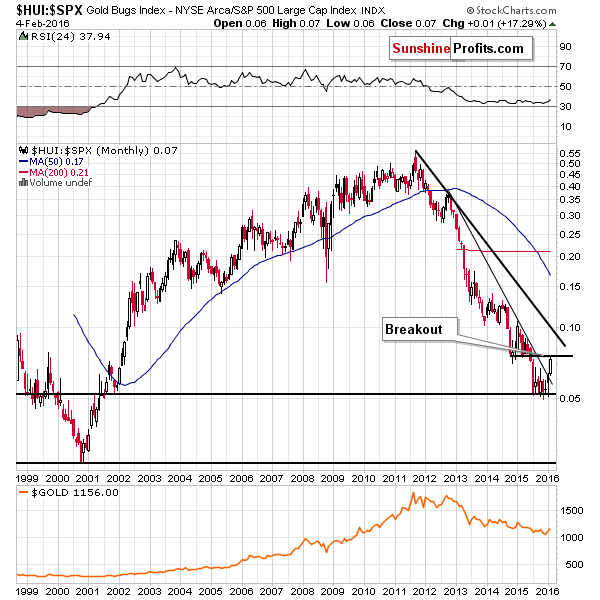
Finally, the XAU to S&P 500 ratio shows that we are just a little before the top as the ratio is very close to its 2000 low (which now serves as strong resistance and the likely target).
Summing up, a lot changed this week and we are in a situation where the medium-term outlook still remains down, but at the same time it’s unclear whether a local top is already in. There are some signs that suggest that this is the case (e.g. medium-term resistance line in the HUI Index), but there are some reasons (breakouts in ratios, breakout in gold and silver) to believe that we will see an additional move higher before the next major plunge takes place. Consequently, we are not re-opening the short positions just yet – we plan to open them at higher prices, however, is we see major signs of a reversal, we might re-open them sooner. Regarding today's early price action, gold seems to be verifying the breakout above the declining resistance line, without breakout's invalidation we will not have major bearish implications of this move.
As always, we will keep you – our subscribers – updated.
To summarize:
Trading capital (our opinion): No positions
Long-term capital (our opinion): No positions
Insurance capital (our opinion): Full position
Plus, you might want to read why our stop-loss orders are usually relatively far from the current price.
Please note that a full position doesn’t mean using all of the capital for a given trade. You will find details on our thoughts on gold portfolio structuring in the Key Insights section on our website.
As a reminder – “initial target price” means exactly that – an “initial” one, it’s not a price level at which we suggest closing positions. If this becomes the case (like it did in the previous trade) we will refer to these levels as levels of exit orders (exactly as we’ve done previously). Stop-loss levels, however, are naturally not “initial”, but something that, in our opinion, might be entered as an order.
Since it is impossible to synchronize target prices and stop-loss levels for all the ETFs and ETNs with the main markets that we provide these levels for (gold, silver and mining stocks – the GDX ETF), the stop-loss levels and target prices for other ETNs and ETF (among other: UGLD, DGLD, USLV, DSLV, NUGT, DUST, JNUG, JDST) are provided as supplementary, and not as “final”. This means that if a stop-loss or a target level is reached for any of the “additional instruments” (DGLD for instance), but not for the “main instrument” (gold in this case), we will view positions in both gold and DGLD as still open and the stop-loss for DGLD would have to be moved lower. On the other hand, if gold moves to a stop-loss level but DGLD doesn’t, then we will view both positions (in gold and DGLD) as closed. In other words, since it’s not possible to be 100% certain that each related instrument moves to a given level when the underlying instrument does, we can’t provide levels that would be binding. The levels that we do provide are our best estimate of the levels that will correspond to the levels in the underlying assets, but it will be the underlying assets that one will need to focus on regarding the sings pointing to closing a given position or keeping it open. We might adjust the levels in the “additional instruments” without adjusting the levels in the “main instruments”, which will simply mean that we have improved our estimation of these levels, not that we changed our outlook on the markets. We are already working on a tool that would update these levels on a daily basis for the most popular ETFs, ETNs and individual mining stocks.
Our preferred ways to invest in and to trade gold along with the reasoning can be found in the how to buy gold section. Additionally, our preferred ETFs and ETNs can be found in our Gold & Silver ETF Ranking.
As always, we'll keep you - our subscribers - updated should our views on the market change. We will continue to send out Gold & Silver Trading Alerts on each trading day and we will send additional Alerts whenever appropriate.
The trading position presented above is the netted version of positions based on subjective signals (opinion) from your Editor, and the Tools and Indicators.
As a reminder, Gold & Silver Trading Alerts are posted before or on each trading day (we usually post them before the opening bell, but we don't promise doing that each day). If there's anything urgent, we will send you an additional small alert before posting the main one.
=====
Latest Free Trading Alerts:
A global debt time bomb is ticking. What does it mean for the global economy and the gold market?
Many gold investors believe that the gold market is systematically manipulated. We invite you to read our today’s article and find out whether it is true. This analysis should help investors better understand the gold market and its true drivers, and draw investment conclusions.
Is the Gold Price Manipulated? Part I
=====
Hand-picked precious-metals-related links:
Gold Ascends as Feeble Dollar, Rate Bets Swell Flows Into ETPs
Senior gold producer Goldcorp takes large stake in Nevada's Gold Standard Ventures
Harmony Gold plans to clear debt this year
=====
In other news:
IMF honing tools to rescue EMs from China spillover, MD Lagarde says
Obama to propose $10-a-barrel oil tax to fund rail and highway projects
You won't see $70 oil until 2018: Morgan Stanley
=====
Thank you.
Sincerely,
Przemyslaw Radomski, CFA
Founder, Editor-in-chief
Gold & Silver Trading Alerts
Forex Trading Alerts
Oil Investment Updates
Oil Trading Alerts

