

Briefly: In our opinion, no speculative positions in gold, silver and mining stocks are currently justified from the risk to reward perspective. We expect to be back on the short side of the precious metals market in the following days or weeks.
Quite a lot happened in the precious metals market and in the USD Index yesterday and in today’s pre-market trading, but has as much changed? What can we infer from gold’s breakout above its 38.2% Fibonacci retracement?
In short, not much changed from the medium-term point of view and the outlook remains bearish, but due to Trump’s surprisingly non-informative speech, the short-term outlook became more bullish. Less clarity means more uncertainty and this took gold higher and could take it even higher, but only in the short term. The market was prepared to slide, but the above seems to have changed the situation and we need to adjust our positions accordingly. Can one ride out any temporary upswings? Naturally, but it seems that closing the current positions (closing the profitable position in silver and the unprofitable positions in gold and mining stocks) and re-entering the short position at higher prices is a better approach. This is a pause after a series of profitable trades and we expect the pause to be over soon and followed by another profitable trade.
What kind of performance in the precious metals market can we expect? Probably something similar to what we saw in late October 2016 and early November 2016. Miners are already underperforming and they are not likely to rally far. However, the problem is that if the speech added uncertainty, we could get another “final stage of the upswing” movement, which suggests silver’s outperformance in the very near future. Once we see it and miners continue to lag (and at the same time support / resistance levels are hit), we’ll be happy to re-enter the short positions.
Still, there are quite a few reasons due to which the turnaround could even happen later today or tomorrow. Let’s take a look at the charts (charts courtesy of http://stockcharts.com).
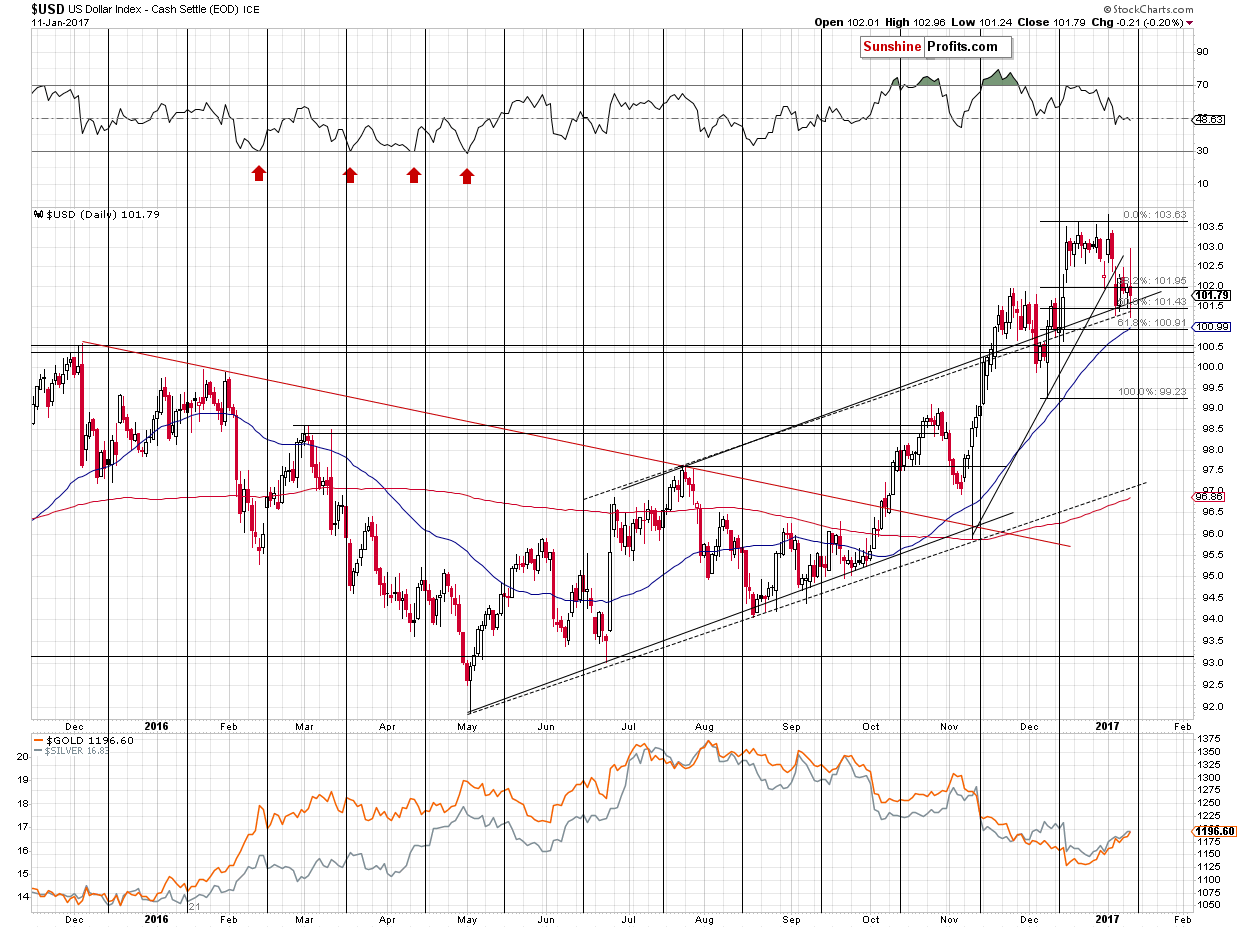
Starting with the USD Index, we see that it declined a bit yesterday after an attempt to move higher (and a temporary move lower as well). Overall, it ended just a little below Tuesday’s close. This could be significant as mining stocks haven’t replied to this by moving higher (the general stock market has), which is bearish.
Additionally, please note that the cyclical turning point in the USD Index is just around the corner and since the previous short-term move was down, the implications are bullish. Moreover, please note that the last 2 very short-term upswings started right before the turning points.
Given today’s pre-market move to 100.81 (a bit below the 61.8% Fibonacci retracement and the 50-day moving average) it could be the case that the decline is already over.
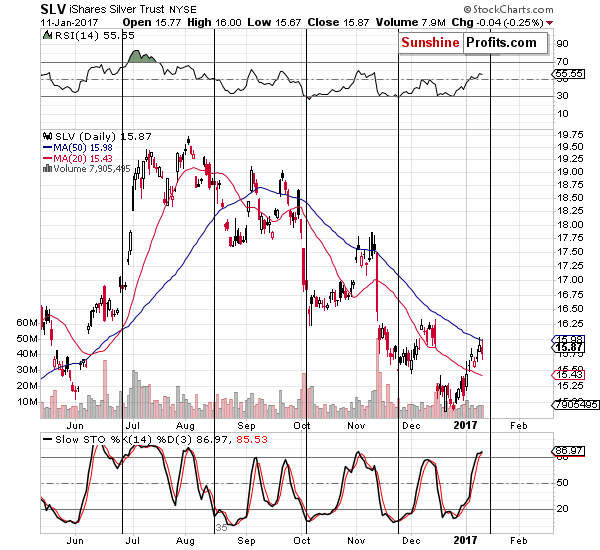
The USD Index is not the only market with a looming turning point – we can say the same thing about silver. In case of gold’s sister metal, the most recent short-term move was definitely up, so the implications are bearish. Silver is now close to the 50-day moving average and right before the turning point – that’s the combination that we saw right before the biggest price slides of 2016 (about 2 and 4 months ago). Naturally, the implications are bearish.
Still, silver is also known to outperform significantly right before slides, so we could see a daily or a few-day long rally just before silver takes another dive. This scenario was not likely before Trump’s surprising speech, but it is now too likely to be ignored.
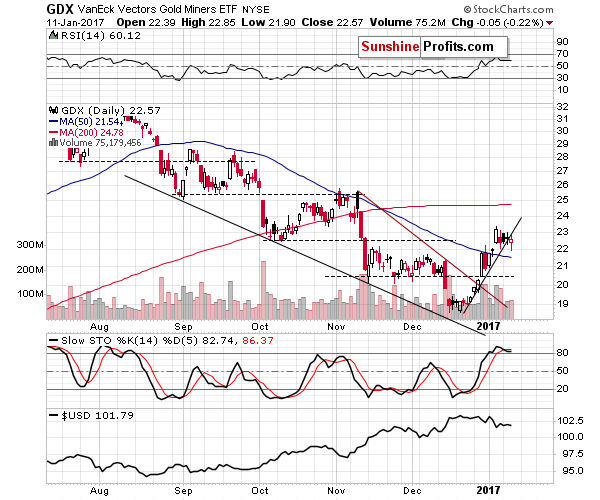
The above GDX ETF chart provides us with 3 bearish indications: the sell signal in the Stochastic indicator, the breakdown below the rising, very short-term support line and the daily decline itself (given a move lower in the USD Index, miners should have moved higher, but they didn’t).
Given gold’s move higher in today’s pre-market trading, it’s likely that miners will also move higher, but we don’t expect to see strong performance here. Just like we wrote earlier today, it seems that a repeat of what we saw in late October 2016 and early November 2016 is more likely – a move higher, but a limited one that confirms the bearish case.
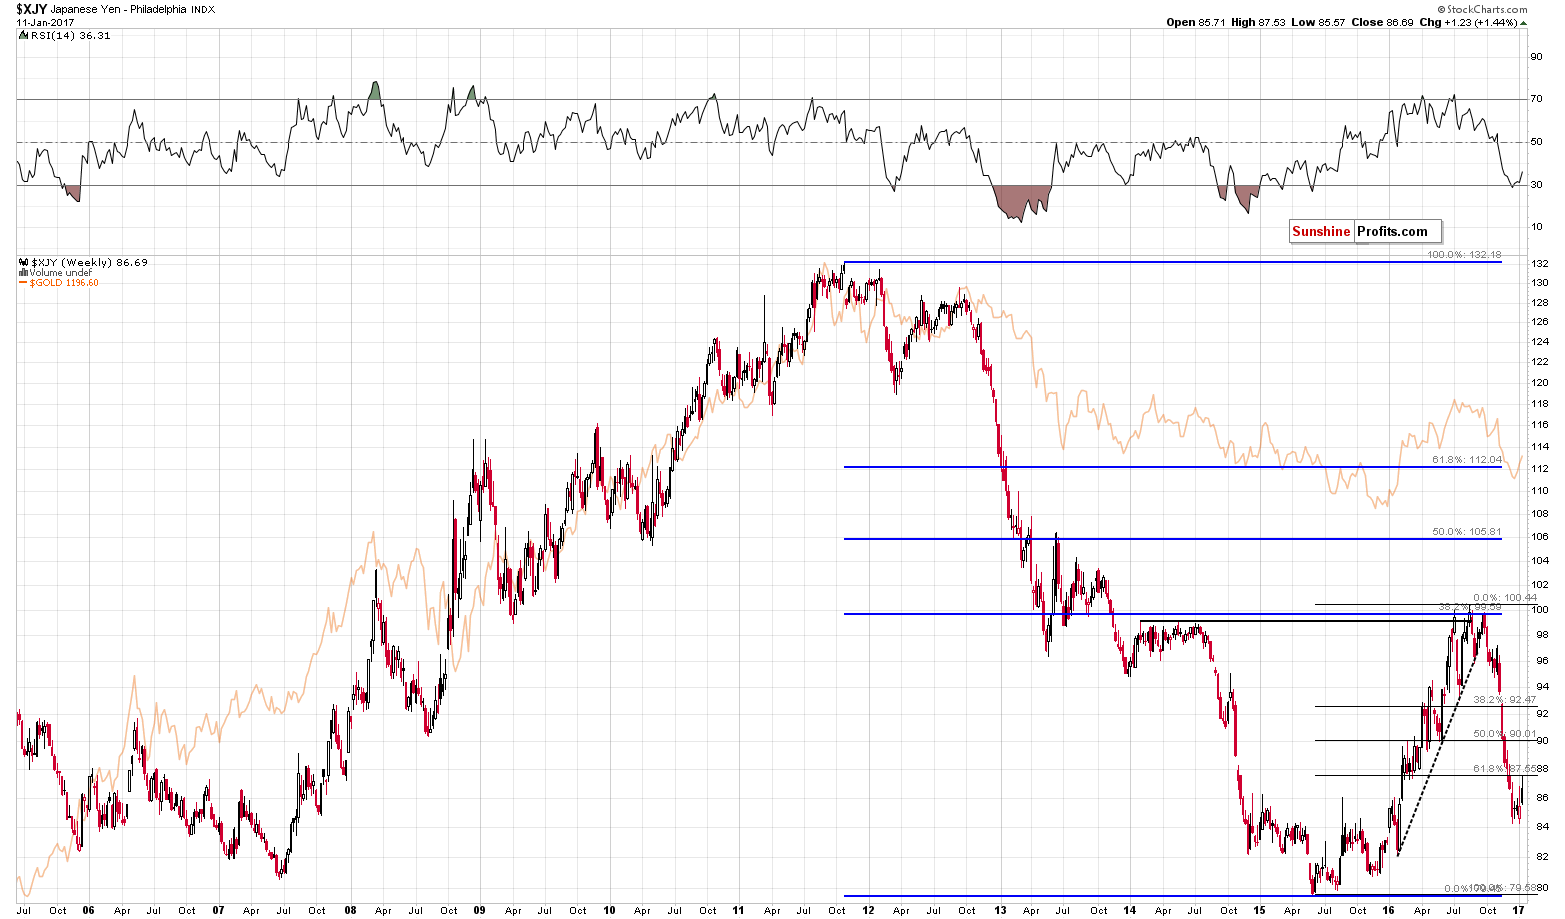
The Japanese yen moved to the previously broken 61.8% Fibonacci retracement and declined again. It appears that the yen was simply verifying the breakdown rather than starting a new rally. With the verification behind us, the next slide becomes even more probable. Why is this significant for the precious metals market? Because gold and yen moved in a very similar way in the past days, months and years. With a deteriorating short-term outlook for yen, we have bearish implications for the precious metals market.
What about gold? It moved visibly above $1,200, moving above the 38.2% Fibonacci retracement level based on the Nov.-Dec. 2016 decline (in terms of daily closing prices), which also suggests that the rally could continue to at least the 50% retracement ($1,218) or the 61.8% retracement ($1,239.46). Why is the 38.2% retracement and the breakout significant? Because it worked multiple times, including the key one – it was this retracement (based on the 2011-2015 decline) that stopped the corrective upswing of 2016. If this strong resistance wasn’t table to hold gold’s rally, it might be the case that gold has to rally a bit more before the rally burns itself out and the main trend (down) resumes. Monitoring the market for confirmations will be critical in the coming hours and days – we’ll keep you informed.
Summing up, the bearish medium-term outlook remains in place, but the situation just became more bullish for the very short term due to Trump’s speech (and the market’s reaction – including today’s pre-market movement) that left investors with uncertainty. Even though a short-term decline was very likely (you will find details in the previous alerts), the situation changed and it seems that the chance of an additional short-term upswing just became bigger. Since the medium-term outlook didn’t change, it seems that temporarily closing the speculative short position in the precious metals sector and waiting for a better risk to reward ratio to re-open it is justified at this time.
As always, we will keep you – our subscribers – informed.
To summarize:
Trading capital (supplementary part of the portfolio; our opinion): No positions (in other words: cash or positions based on other Trading Alerts)
Long-term capital (core part of the portfolio; our opinion): No positions (in other words: cash)
Insurance capital (core part of the portfolio; our opinion): Full position
Please note that the in the trading section we describe the situation for the day that the alert is posted. In other words, it we are writing about a speculative position, it means that it is up-to-date on the day it was posted. We are also featuring the initial target prices, so that you can decide whether keeping a position on a given day is something that is in tune with your approach (some moves are too small for medium-term traders and some might appear too big for day-traders).
Plus, you might want to read why our stop-loss orders are usually relatively far from the current price.
Please note that a full position doesn’t mean using all of the capital for a given trade. You will find details on our thoughts on gold portfolio structuring in the Key Insights section on our website.
As a reminder – “initial target price” means exactly that – an “initial” one, it’s not a price level at which we suggest closing positions. If this becomes the case (like it did in the previous trade) we will refer to these levels as levels of exit orders (exactly as we’ve done previously). Stop-loss levels, however, are naturally not “initial”, but something that, in our opinion, might be entered as an order.
Since it is impossible to synchronize target prices and stop-loss levels for all the ETFs and ETNs with the main markets that we provide these levels for (gold, silver and mining stocks – the GDX ETF), the stop-loss levels and target prices for other ETNs and ETF (among other: UGLD, DGLD, USLV, DSLV, NUGT, DUST, JNUG, JDST) are provided as supplementary, and not as “final”. This means that if a stop-loss or a target level is reached for any of the “additional instruments” (DGLD for instance), but not for the “main instrument” (gold in this case), we will view positions in both gold and DGLD as still open and the stop-loss for DGLD would have to be moved lower. On the other hand, if gold moves to a stop-loss level but DGLD doesn’t, then we will view both positions (in gold and DGLD) as closed. In other words, since it’s not possible to be 100% certain that each related instrument moves to a given level when the underlying instrument does, we can’t provide levels that would be binding. The levels that we do provide are our best estimate of the levels that will correspond to the levels in the underlying assets, but it will be the underlying assets that one will need to focus on regarding the signs pointing to closing a given position or keeping it open. We might adjust the levels in the “additional instruments” without adjusting the levels in the “main instruments”, which will simply mean that we have improved our estimation of these levels, not that we changed our outlook on the markets. We are already working on a tool that would update these levels on a daily basis for the most popular ETFs, ETNs and individual mining stocks.
Our preferred ways to invest in and to trade gold along with the reasoning can be found in the how to buy gold section. Additionally, our preferred ETFs and ETNs can be found in our Gold & Silver ETF Ranking.
As always, we'll keep you - our subscribers - updated should our views on the market change. We will continue to send out Gold & Silver Trading Alerts on each trading day and we will send additional Alerts whenever appropriate.
The trading position presented above is the netted version of positions based on subjective signals (opinion) from your Editor, and the Tools and Indicators.
As a reminder, Gold & Silver Trading Alerts are posted before or on each trading day (we usually post them before the opening bell, but we don't promise doing that each day). If there's anything urgent, we will send you an additional small alert before posting the main one.
=====
Latest Free Trading Alerts:
Yesterday, Trump held a long-awaited press conference. What does it imply for the gold market?
Trump’s Press Conference Pushes Gold above $1,200
S&P 500 index continued to trade within a short-term consolidation on Wednesday, as it remained close to its Friday's record high of 2,282.10. Will the uptrend continue? Or is this some topping pattern before downward reversal? Is holding short position still justified?
Stock Trading Alert: S&P 500 Trades Close To Record High - Topping Pattern Or Just Consolidation?
=====
Hand-picked precious-metals-related links:
Gold Surges Above $1,200 as Details-Shy Trump Weighing on Dollar
=====
In other news:
Trump policy vacuum sucks dollar lower
S&P 500 Clings to Biggest Post-Election Rally Since JFK
Mark Carney signals Bank of England may raise forecast for UK economy
Oil rises on OPEC output cuts, China demand forecast
OPEC Boss Says Producers Will Decide in May If More Oil Cuts Needed
China is freaking out bitcoin traders
=====
Thank you.
Sincerely,
Przemyslaw Radomski, CFA
Founder, Editor-in-chief, Gold & Silver Fund Manager
Gold & Silver Trading Alerts
Forex Trading Alerts
Oil Investment Updates
Oil Trading Alerts

