
- Euro & USD Indices
- General Stock Market
- Crude Oil
- Correlation Matrix
- Gold
- Silver
- Platinum
- Mining Stocks
- Letters from Subscribers
- Gold and US Dollar correlation
- Why not wait for a sustained move over 1700
- Scrap gold recycling down almost 50%. COMEX default?
- Junior miners: IAU
- A big drop to 1500 and junior miners
- Summary
Today it’s difficult to imagine the scene knowing what we know about the price of gold. It was September 26, 1999 and representatives of the leading central banks of the Western world met over lunch in Washington DC. They were worried about gold-- very worried. The vaults of their central banks held tons of shiny bullion and it looked like the price could plummet.
The meeting took place almost exactly 28 years after Richard Nixon in 1981 essentially defaulted on America’s explicit promise of dollar convertibility to gold. The market had been plagued by persistent rumors of official sector sales. Only a few months earlier the British government announced plans to sell more than half of its gold reserves sparking a fierce international debate on the role of gold as a reserve asset. All that gold flooding the market at once would depress prices. And to make matters worse, instead of selling the gold discreetly, as did other central banks in the past and announcing it only after the fact, Gordon Brown, then British Chancellor, made a big commotion giving the market notice that it was soon to be flooded. He sold the gold in a well-publicized auction. It was as if he was doing everything possible to make sure he got the lowest possible price for Britain’s gold, which in fact he did. Gordon’s Folly, as it is called today, is regarded as one of the British Treasury's worst financial mistakes. Britain’s gold went for a bargain price of $256 and $296 an ounce, a 20-year-low, right before gold began its spectacular rise to its current levels. At the time the agreement was signed there was also the prospect of significant sales by the Swiss and the possibility of on-going sales by Austria, the Netherlands and the IMF.
Soon after Brown’s announcement, Alan Greenspan, then Chairman of the Federal Reserve, said to the House Banking Committee: Gold still represents the ultimate form of payment in the world. Germany in 1944 could buy materials during the war only with gold. Fiat money in extremis is accepted by nobody. Gold is always accepted.
Those attending the meeting had a more recent example of the urgent necessity to have gold reserves. A year earlier, in January of 1998, South Korea began a campaign asking its citizens to turn in their gold voluntarily to help the financially strapped country meet its obligations. Within the first two days of the program, over 100,000 South Koreans donated more than 20 tons of gold worth over $100 million.
And so, on that Sunday afternoon in Washington, 15 central banks signed an agreement that collectively limited their ability to sell more than 400 tons of gold a year for the next five years putting a cap on European sales. This, in effect, gave protection to the price by giving broad certainty that tons of gold would not flood the market. If sales would take place, they would be orderly and controlled with no more than 400 tons in any given year.
The central bankers also issued a statement saying that “Gold will remain an important element of global monetary reserves.” The agreement has been renewed twice, now has 18 signatories and runs until September 2014.
All this seems strange to us today because the tables have turned. Central banks aren’t looking to sell their gold. They are fiercely holding on to their gold reserves, repatriating them and buying more. None are selling. New Zealand probably regrets its decision in 1988 to sell off all its gold reserves. We know that Britain regrets “Gordon’s Folly.” Germany just recently announced that it will repatriate part of its gold reserves from New York and Paris back to Germany. Among those buying gold is Britain, trying to replenish its reserves which have fallen to historically low levels, according to George Osborne, the current British Chancellor.
I can confirm our gold holdings have risen in value to £11 billion. This does not include the 400 or so tons of gold sold a decade ago for £2 billion, and which would now be worth six times that at over £13 billion pounds, he said in a speech this past spring, throwing a barb at Gordon Brown for having lost the British people some 11 billion pounds worth of gold.
The massive increase in the global money supply due to quantitative easing has been driving central banks to diversify their foreign reserves from fiat currencies to gold. Emerging countries want to catch up.
In the years prior to the economic meltdown of 2008, about 10% to 15% of the annual supply in the gold market came from central bank sales. Today, the exact opposite is true. Central banks are buying close to 15% of annual supply. That makes a 30% impact on the gold market from sellers to buyers. Central banks collectively bought 77.3 metric tons of gold in 2010, and 456.8 tons in 2011. The total purchases of gold from the central banks in 2012 amounted to 534.6 tons, about 17% higher than in 2011. All this means a swing of close to 1,000 tons from years when banks were net sellers.
Emerging market economies have far less of the yellow metal than the nations of Europe or the United States. This gap has prompted aggressive gold buying by Mexico, Brazil, Russia, India, Thailand, Kazakhstan, Turkey, Belarus, the Philippines, Tajikistan, Argentina and South Korea. Turkey has even gone so far as to demand an increase in the proportion of gold held by its commercial banks as part of their reserves. They are all diversifying away from sovereign debt.
Some nations keep their gold transactions a secret. China has not released any data on its official holdings since 2009 when it reported 1,054.1 metric tons, or about 1.7 % of its reserves. Just for comparison, the U.S., Germany, France and Italy have over 70% of their forex reserves in gold. It is widely believed that China is increasing its purchases of gold by buying up all its own mine production. This is no small matter. China has become the world's largest gold producer, overtaking South Africa in 2007. It produces about 300 tons per year. It would not surprise us if China were to announce soon that it has doubled its gold reserves to somewhere north of 2,000 tons.
We believe that these aggressive purchases by the world’s central banks will continue into 2013 providing a floor to the price of gold.
To see how gold is performing this week, let's begin the technical part with the analysis of the Euro Index. We will start with the short-term chart (charts courtesy by http://stockcharts.com)
Euro & USD Indices
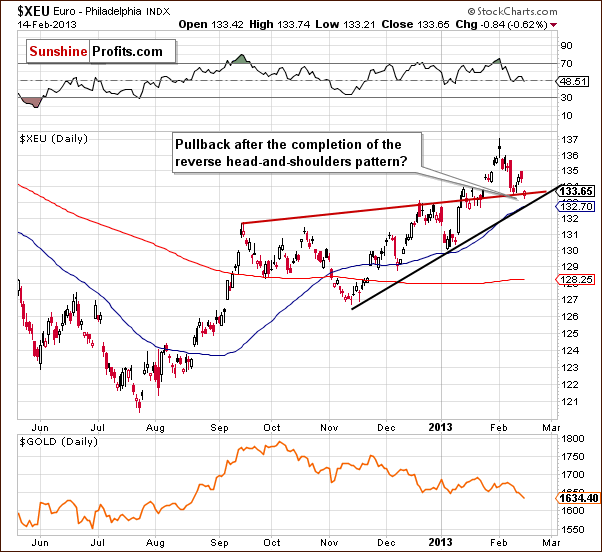
We begin our currency section with the short-term Euro Index chart. We see that the index declined on Thursday and also earlier this month. These declines appear to be a verification of the reverse head-and-shoulders pattern and the implications remain bullish at this time.
The same can be said about the implications of the short-term trend – the currency remains above the short-term support line.
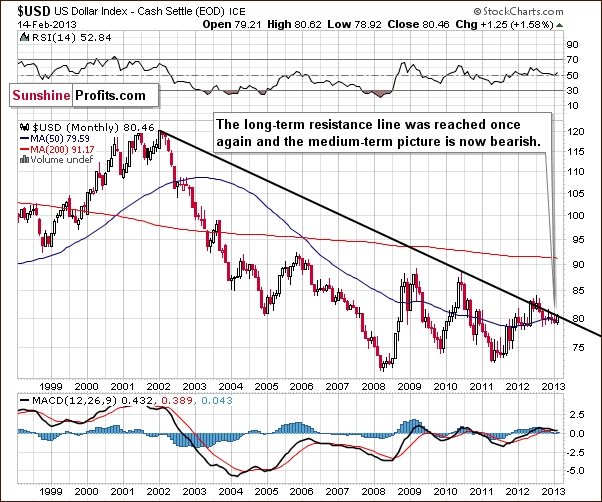
Turning now to the very long-term USD Index chart, nothing really changed this week and the situation remains bearish. Comments made in last week’s Premium Update remain up-to-date:
(…) the long-term trend for the USD Index remains down … [recent rallies] did not take the index level above the long-term resistance line, so the outlook here from the long-term perspective remains bearish.
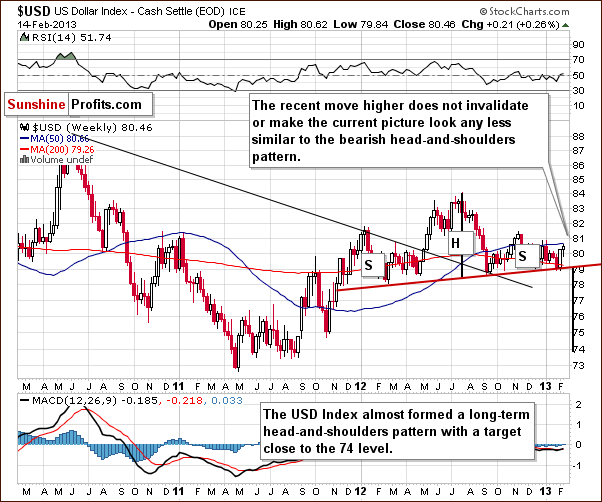
In the medium-term USD Index chart, we see that significant declines followed the 2012 top. Since then, a prolonged consolidation period has been seen and the period of declines ahead after such a lengthy consolidation could very well continue and complete the head-and-shoulders pattern in the coming weeks. This would have very negative consequences for the dollar.
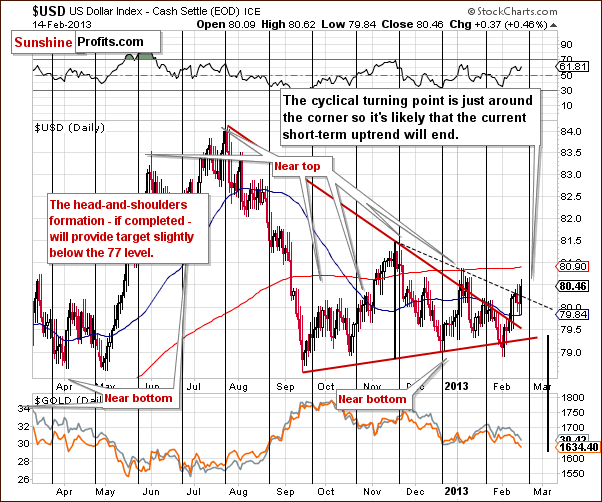
Many investors may now be asking themselves, “Will a breakdown be seen anytime soon?” In the short-term USD Index chart, the fact is that we see that a cyclical turning point is coming very soon. With the preceding move to the upside, we could very well see the long awaited medium-term decline begin. With each consecutive attempt to break down below the support line (neck level of the head-and-shoulders pattern), the odds of success increase slightly. It once again seems that a successful breakdown will be seen soon, and the head-and-shoulders pattern will be completed.
Summing up, the overall situation remains bearish for the USD Index even though the index has rallied a bit this month. The weeks ahead will likely see the index level move to the downside.
General Stock Market
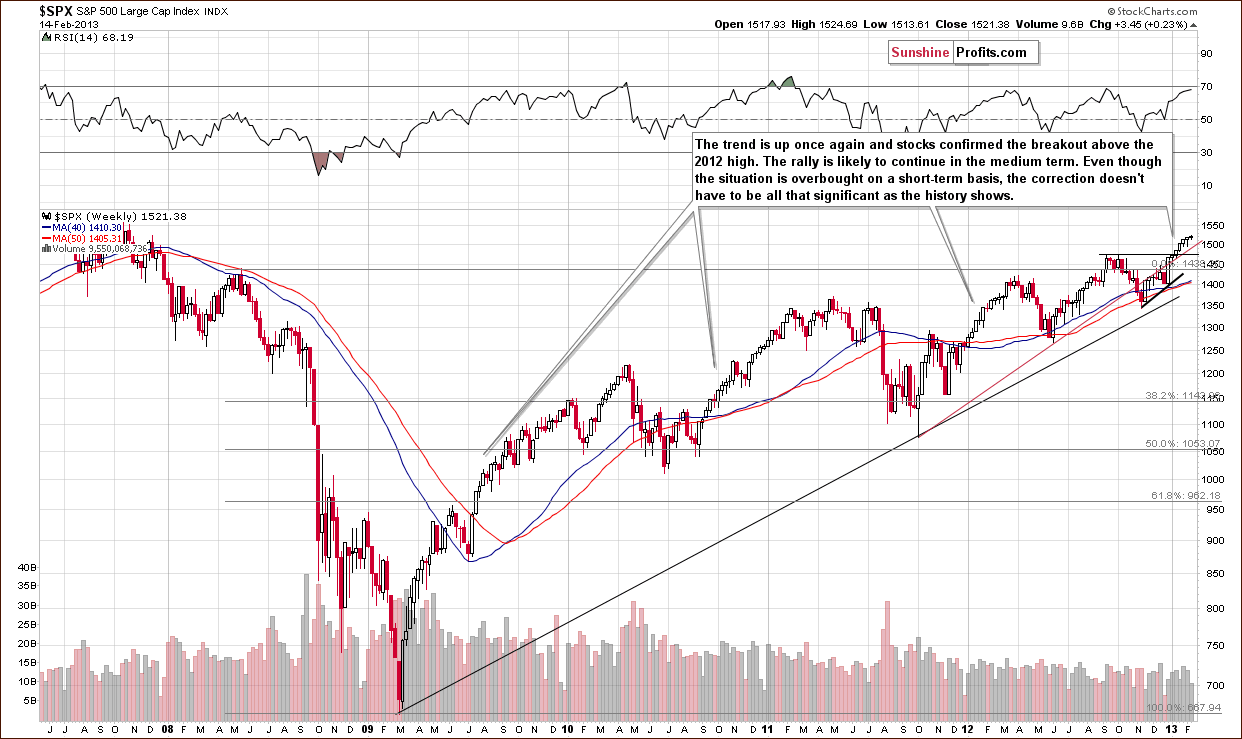
In the long-term S&P 500 Index chart, little has changed this week. Stock prices moved a bit higher, and about the only thing we can infer from the long-term chart this week is that any declines will probably be very small. There is little chance that significant price declines will be seen any time soon because there are several strong support levels/lines close to the current value of the index. Yes, the RSI is close to being overbought but this situation persisted for months several times in the past few years without any significant correction. For instance, take a look at the final part of 2009.
We could see a small move to the downside, a continuation of the consolidation, or even a small rally in stock prices.
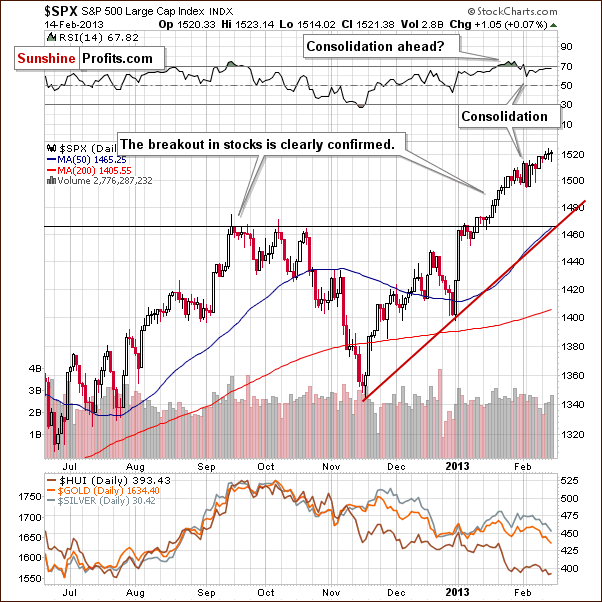
In the short-term S&P 500 Index chart, we see a situation which is no longer overbought and prices, after a period of consolidation, have begun a small steady rally to higher levels. It’s worthy to note here that such a move is much more sustainable than a quick sharp rally. The present situation – based on the above chart alone - could actually continue for a few more weeks before any significant moves to the downside are seen.
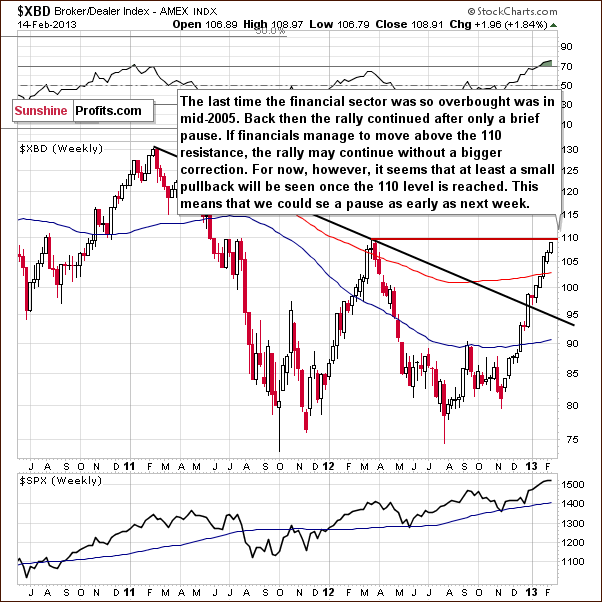
In the financial sector (Broker/Dealer Index serves as a proxy here) chart, it appears that some consolidation could begin here as early as next week. The financials are closing in on the price level of the 2012 high so they and the rest of the sector could soon see some consolidation.
Local tops in the financials are often aligned with those in the general stock market. As we have stated many times in the past, the financials frequently lead the general stock market, and so a period of consolidation here would likely lead to consolidation in the general stock market soon thereafter.
Summing up, the situation in stocks this week is unchanged with respect to the likelihood of any significant declines. The financials however, which often lead the other stocks, could consolidate in the coming week. This would likely lead to a consolidation in the general stock market as well. Stock prices could very well consolidate a bit and then rally once again.
Crude Oil
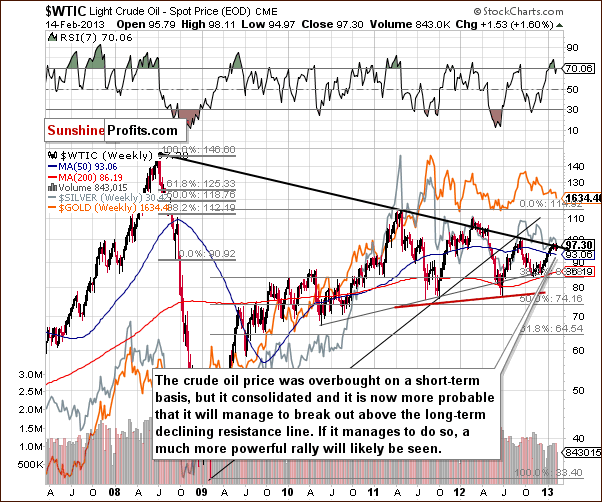
With stocks possibly consolidating a bit and then continuing their recent rally, we now turn to the crude oil price chart where much the same situation could be ahead. Crude oil was overbought recently and after a period of consolidation, prices are now moving a bit higher.
Crude oil prices could manage to break out, but RSI levels are slightly above 70 which is an overbought situation. With some consolidation having been seen here, the odds for a breakout are much higher (60% or so) than they were a few weeks ago (40% or so). With higher stock prices and lower USD Index values, we expect the breakout in oil prices to materialize soon. Such a development could take other commodities as well as the precious metals to higher price levels.
Gold and Silver Correlations
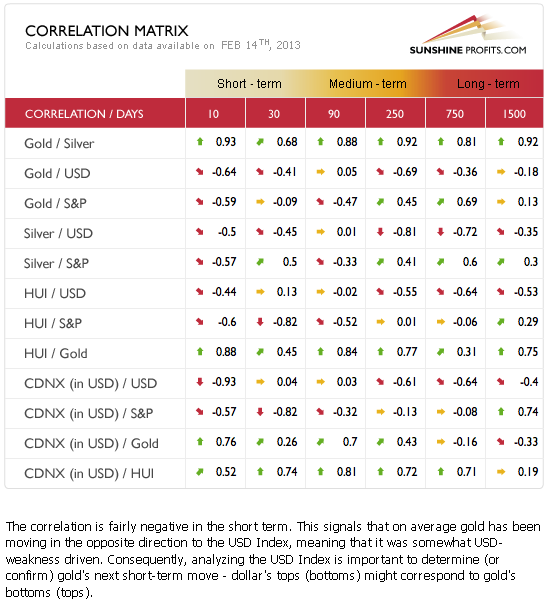
The Correlation Matrix is a tool which we have developed to analyze the impact of the currency markets and the general stock market upon the precious metals sector (namely: gold & silver correlations). A very interesting point this week is the more meaningful negative correlation between the USD Index and gold and silver. While it’s too early to say that the normal correlations are again in place, things are a bit better now than they have been when compared to last week.
It’s important to note that though the USD Index moved higher recently, gold and silver prices declined. The decline, however, was not as strong as could be expected based on the size of the rally in the USD Index. The metals appear to be responding to the strength of the dollar but not in a strong manner, which is a good sign overall for gold, silver, and the gold and silver mining stocks.
When assets do not respond to negative information, it generally means that their overall strength is improving. We would like to see gold and silver outperform along with small declines in the USD Index, but whether or not this will happen remains to be seen. All-in-all, the implications for the precious metals here are positive based on the correlation coefficients this week, the USD Index, the general stock market, and because of the current trends present on these markets and their current medium-term relationshipswith precious metals.
Gold
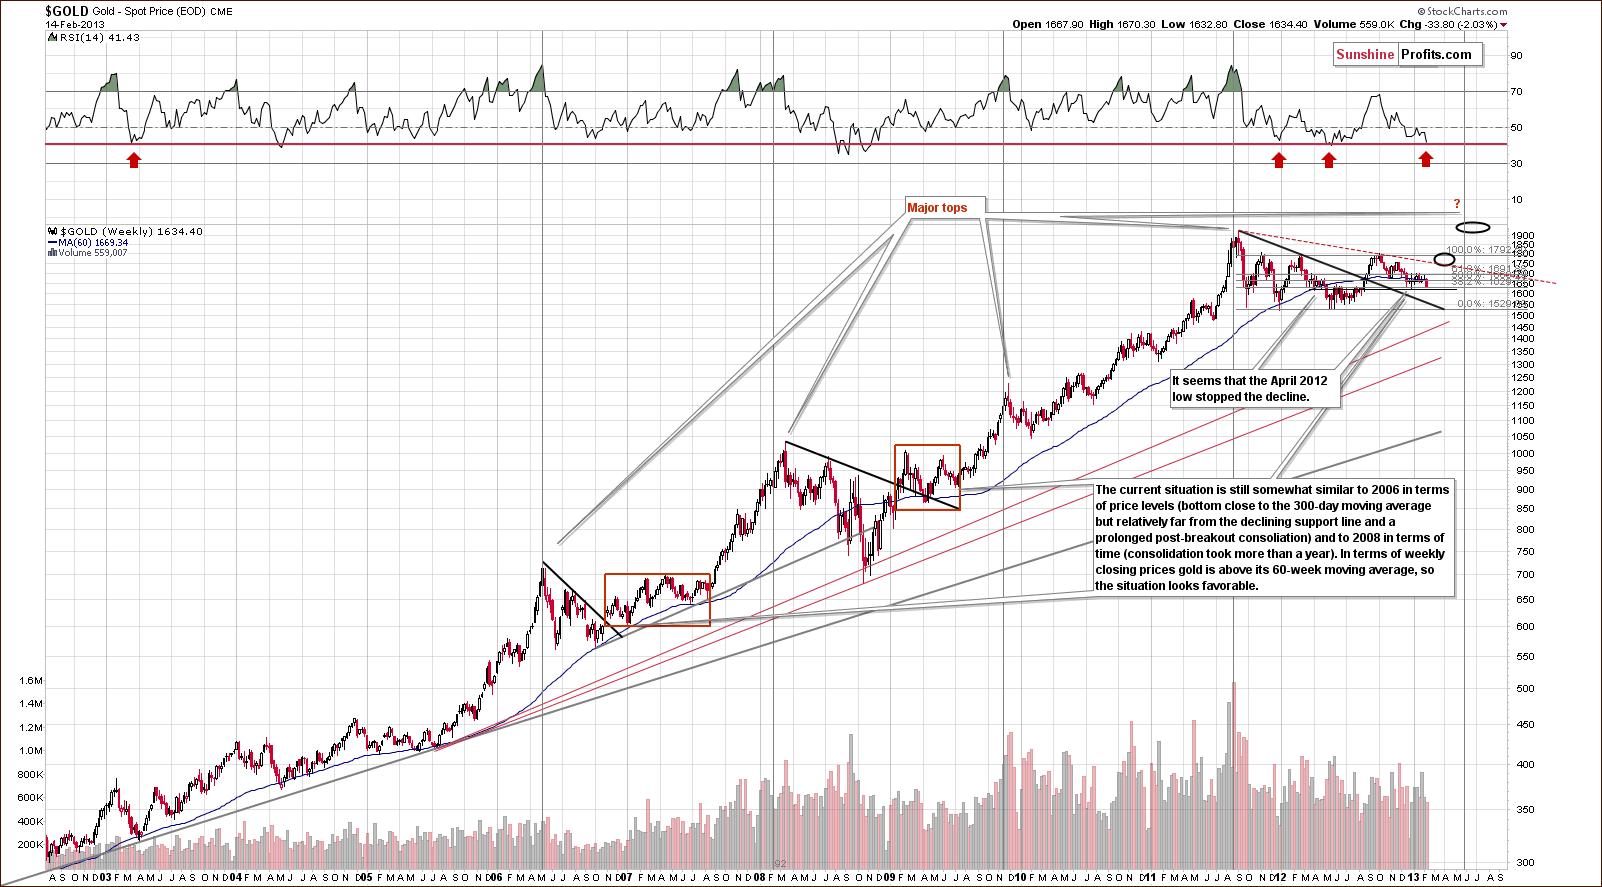
In this week’s long-term gold chart, there are three things to focus on. The first is that Thursday’s low is not below the low seen in January. The low was at $1,626 and gold closed at $1,634 on Thursday. In Friday’s pre-market trading we see gold moving to the $1,626 level once again, but without any meaningful breakdown.
Since prices have moved lower after consolidating, and RSI levels have declined and are now at a level equal to those seen at the 2011 and 2012 bottoms, it seems very likely that a major bottom is either in or at hand now. That is to say, there is a buy signal right now based on the RSI level and this is the second focal point here.
Finally, we have discovered a long-term cycle when analyzing gold market consolidations and how they evolve to rally and top. We generally project the price path that will be seen next, however, this time we thought of looking at when a top could be seen and inferring how gold might get there.
Note that the second stage of the gold bull market began in 2006. From the major bottom in that year and after, we see strong relationships and that every two years or so, we have a major top preceded by a sharp rally. The coming top (long-term cyclical turning point) is suggested in late May, so a sharp rally is expected very soon, that is, prior to the May top.
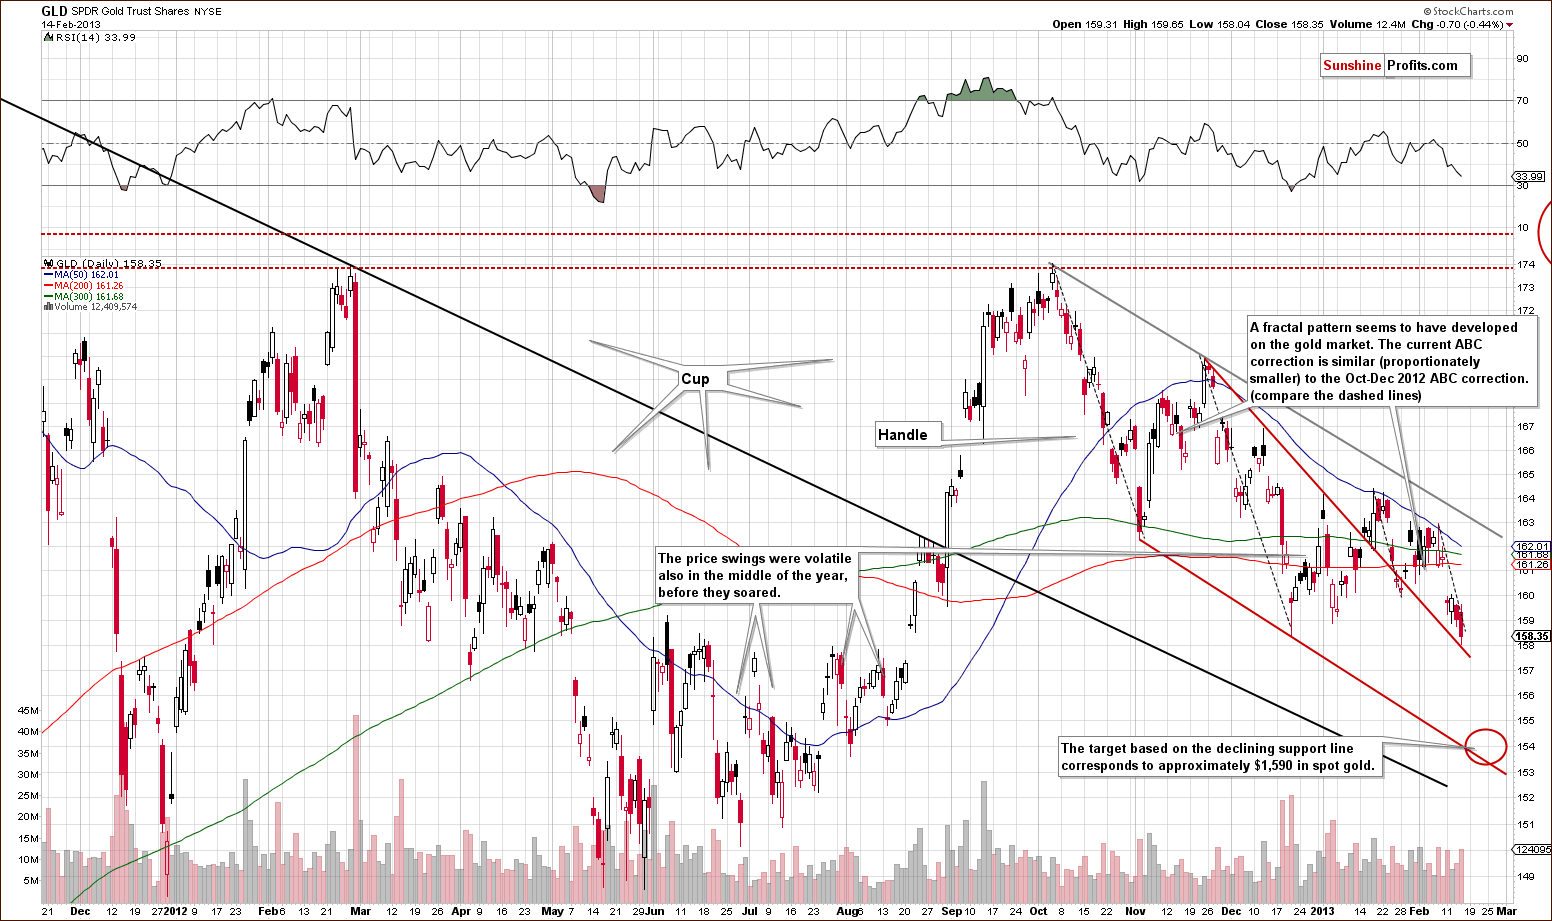
On Thursday, prices moved to the declining support line without breaking it, so we continue to view the situation as bullish. It would take 3 consecutive closes for a breakdown to be confirmed. We will likely have one on Friday but we expect to see a sharp pullback next week.
Please note that the next support line creates a target at $154 that corresponds to approximately $1,590 in spot gold. We could see a move to this area as gold broken below the stop-loss level that we provided previously ($1,629).
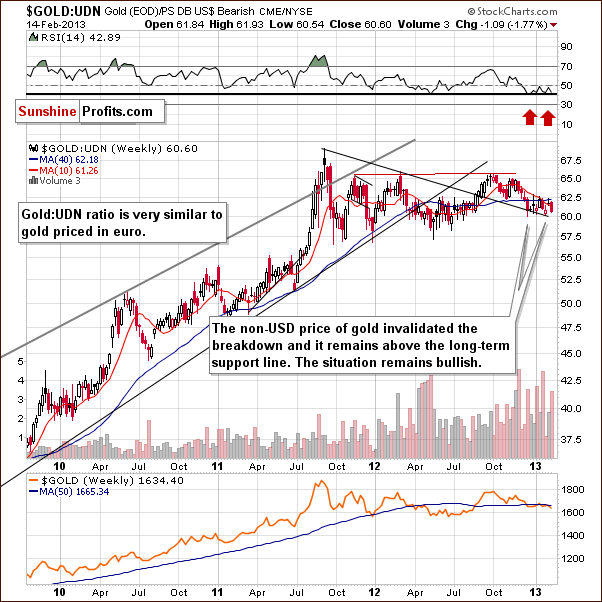
In this week’s chart of gold from the non-USD perspective, we still see a bullish picture. Prices have consolidated after breaking out, and while the situation looks a bit discouraging (as not much happened in the past few months), it is still overall bullish in our view.
Summing up, the situation for the yellow metal remains bullish at this time, however it might be the case that gold moves even lower – say, to $1,590 - before the final bottom is reached. The analysis of this week’s long-term chart uncovered some bullish signals based on a study of trading patterns seen since 2006. As always, implications gleaned from long-term charts carry more weight than those from shorter time periods and are the most important factors to be considered from this week’s gold section.
Silver
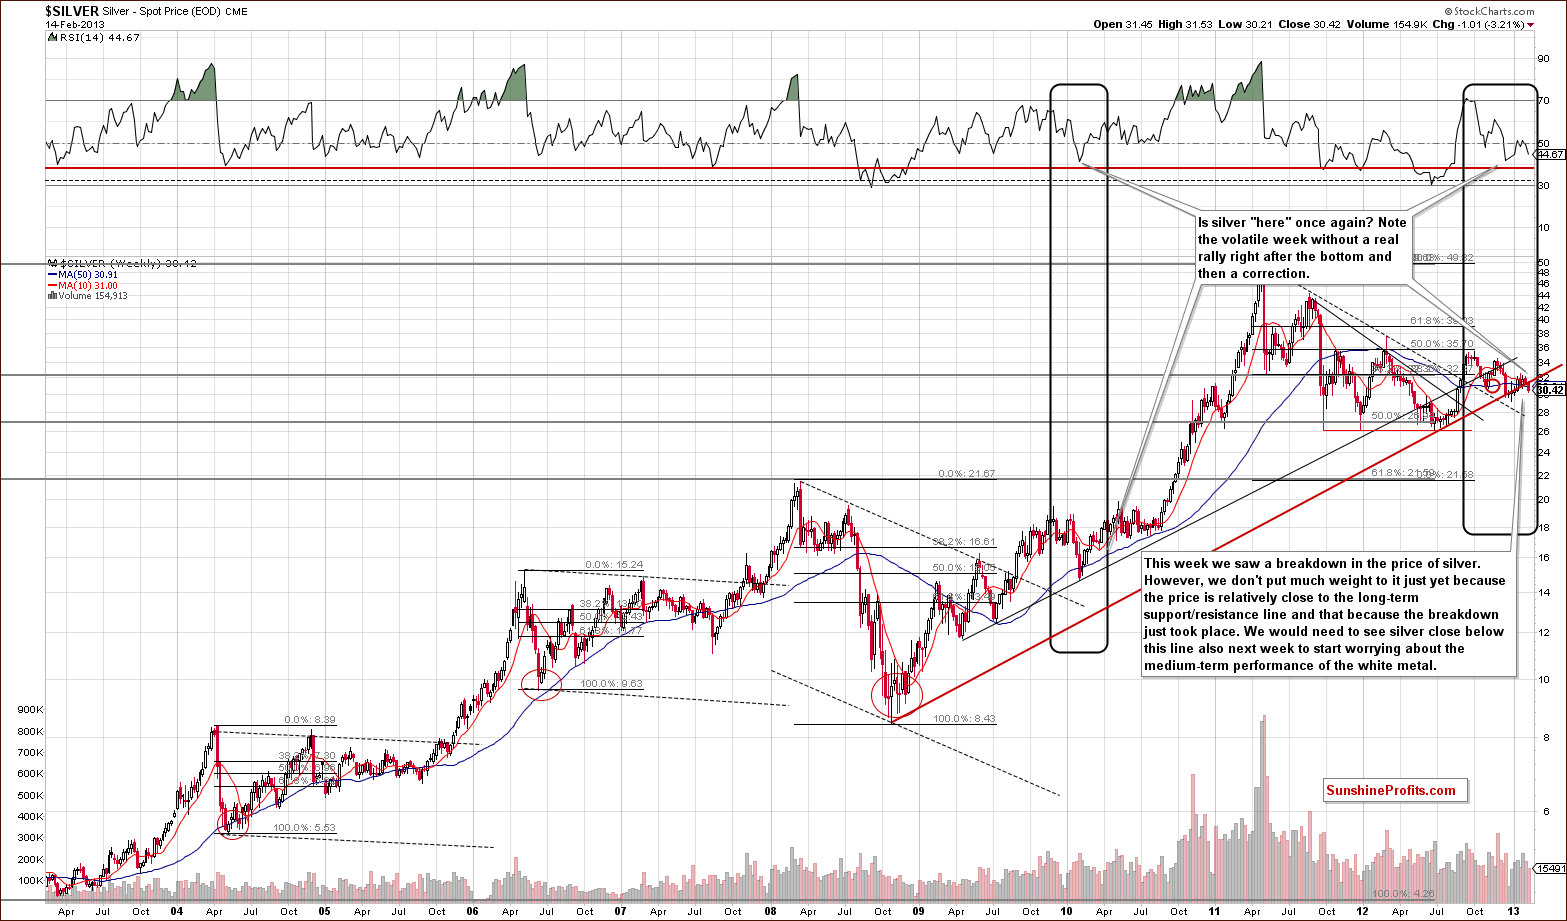
In this week’s very long-term silver chart, we do see that the white metal provides some negative information this week as prices declined on Thursday. We see a breakdown below an important support line but feel this carries little weight when all things are considered.
There are three points we wish to make. First, silver’s price has only been there for one day and we would like to see about three weeks of prices below such a significant support line to confirm the move below it. Secondly, prices barely moved below the support line and closed quite close to it on Thursday, not really a strong move to the downside at all. Finally, in the past, silver has frequently broken down then pulled back with a vengeance, so not much weight in such a small breakdown is appropriate just yet.
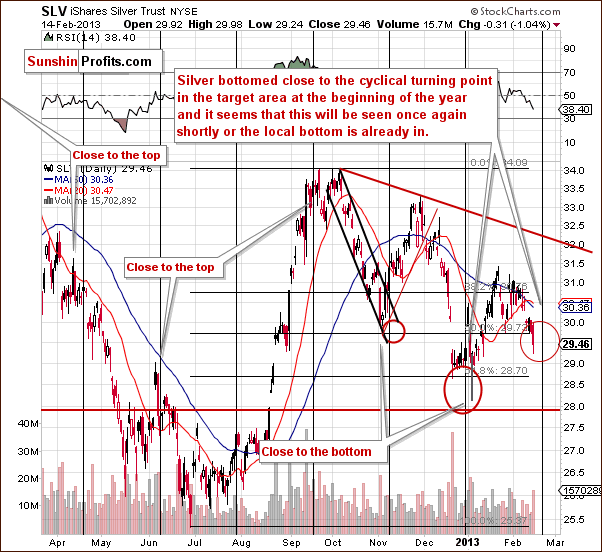
In the medium-term SLV ETF chart, we see that a cyclical turning point is close at hand. In two previous cases, local bottoms emerged when cyclical turning points were encountered, and this seems likely to be the case here once again. Higher silver prices are expected, though some weakness could be seen in the very short term (our stop-loss levels were breached today). The weeks ahead will likely see higher prices, and we feel the situation remains bullish for the white metal, but at the same time we realize that the next few days can see lower prices. We don’t see the SLV ETF moving below $28, though.
Summing up, the situation remains bullish for silver and will remain so until it fails to move above the medium-term resistance line and fails to rally after reaching its cyclical turning point. It seems that the next buying opportunity will be seen when gold moves to $1,590 (the support level is clearer on that market and we expect to see both markets bottom at the same time).
Platinum
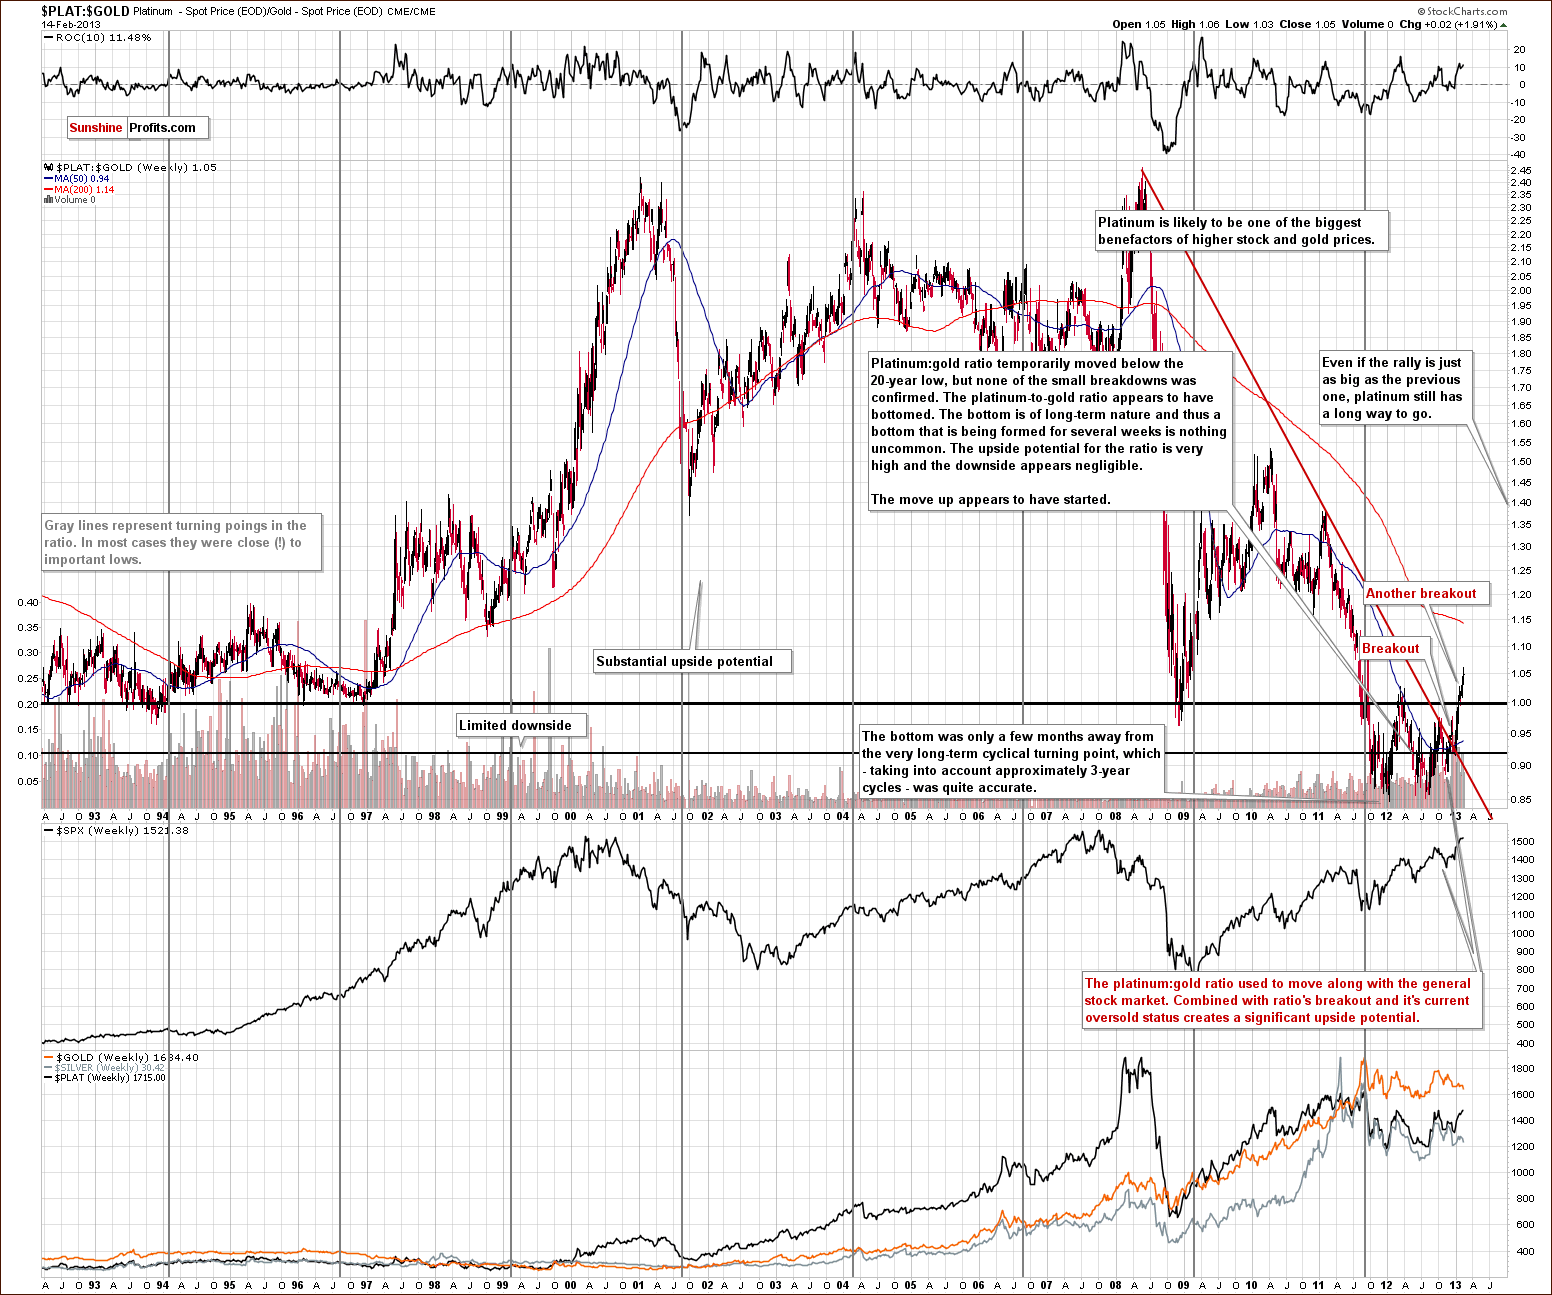
In this week’s platinum to gold ratio chart, nothing changed this week and our comments in last week’s Premium Update remain up-to-date:
Platinum is now [over $80] higher than gold in price, but this price difference is tiny compared to the norm of the past 20 years. It still does not appear to be too late to open a position is platinum or switch part of your gold holdings over and secure a position which appears to have tremendous upside potential. We continue to believe that platinum will outperform gold in the coming months.
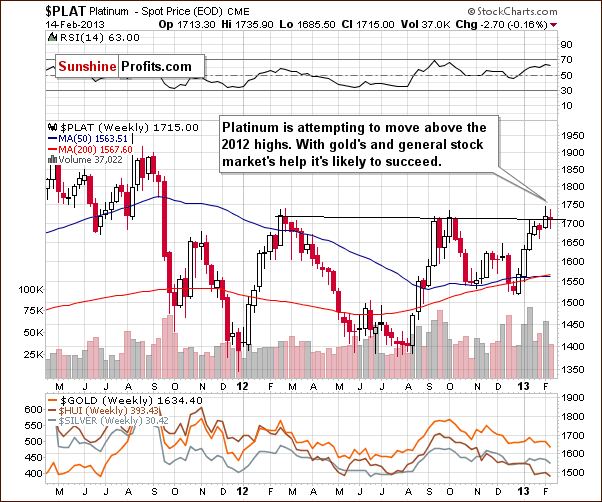
In this week’s medium-term platinum chart, we see that platinum’s price closed above last week’s high and above the resistance line created by recent previous highs. One more week of prices holding above the previous resistance level will confirm the breakout and another sharp rally will then be expected. We might actually suggest going long platinum also with your speculative capital when that happens.
Gold and Silver Mining Stocks
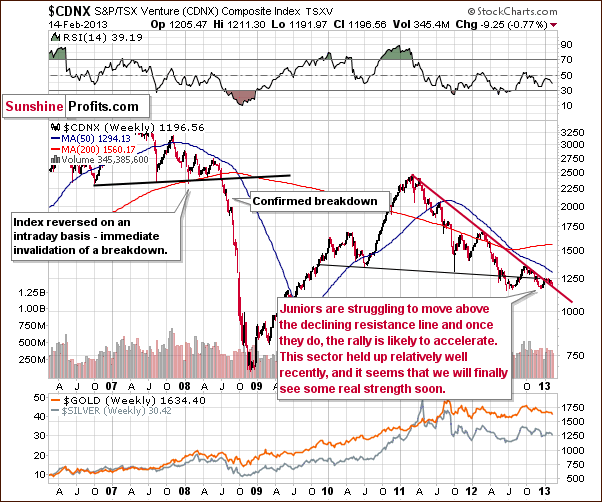
In the Toronto Stock Exchange Venture Index (which is a proxy for the junior miners as so many of them are included in it), last week’s Premium Updatecomments remain up-to-date:
…the junior sector did not do much this week as sideways trading was seen and price levels are now close to the declining resistance line. No significant breakout has been seen yet, but one is likely once additional strength is seen in the precious metals. This will probably lead to a continuation of the rally, and little else needs to be said. We expect prices to move to the upside here as well.
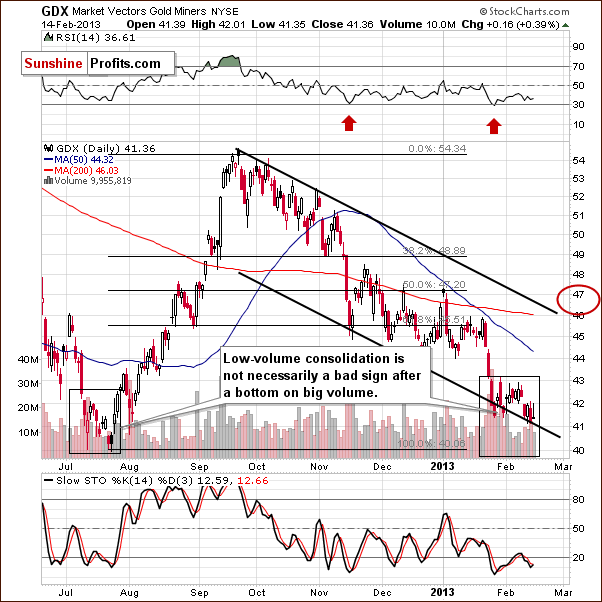
In this week’s GDX ETF chart, we see numerous similarities with what was seen at the end of last July. The price range, behavior, volume levels and RSI levels are all similar. A sharp rally followed the late July trading period, and we expect to see the same here once again, perhaps very soon as the cyclical turning points in the USD Index and silver suggest.
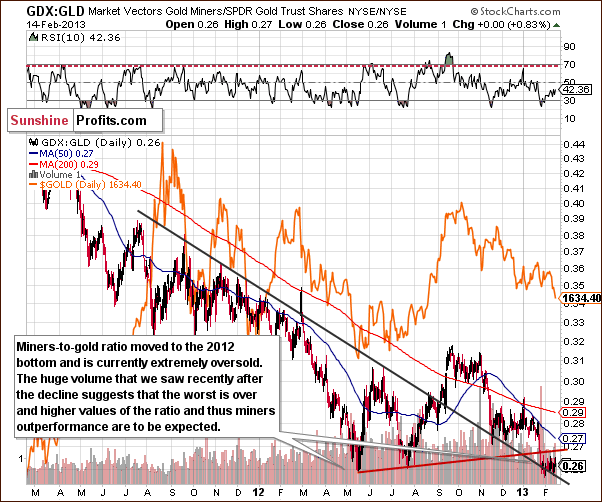
In this week’s miners to gold ratio chart, comments made in last week’s Premium Updateremain up-to-date as well:
In this week’s miners to gold ratio chart, little change was seen, and the ratio is still close to the 2012 low, which is a major support line. It will probably not move below this level as it seems the damage has already been done here, and recent high volume levels confirm it.
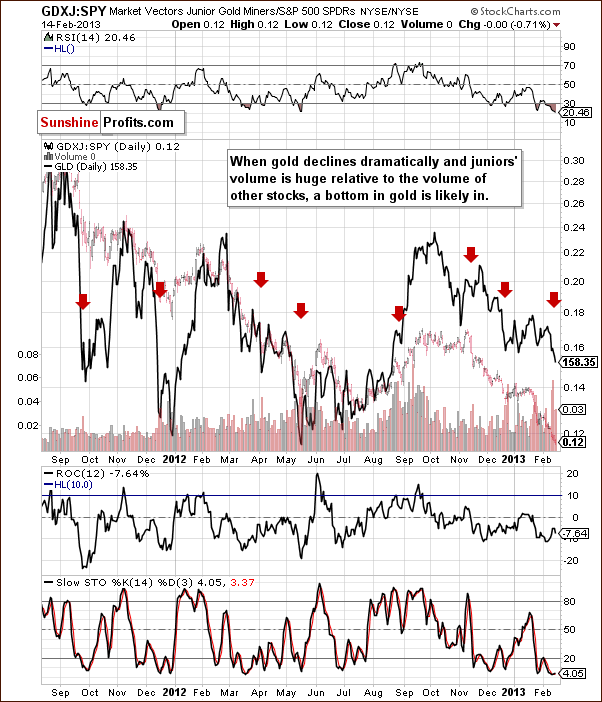
Finally, let’s take a look at a very little known, yet useful ratio – the one featuring juniors and the general stock market. On the above juniors to other stocks ratio chart, the ratio of volumes is most interesting. Note that the GLD ETF chart is included as well, and the ratio is actually in the background. Compare what happened to gold prices when the ratio of volumes spiked (marked with red arrows). Local bottoms were seen for gold practically on each occasion, and this may be the case now since a major spike has been seen in the ratio of volumes.
RSI levels based on the ratio are also more oversold now than they have been in 18 months. Other indicators also suggest an oversold situation, and this chart provides very bullish implications for the precious metals sector.
Summing up, the situation in mining stocks does not really look good based on the GDX ETF alone. When comparing the long-term situation in gold and silver, and the coming cyclical turning points, however, we get a bullish combination for the mining stocks.
Letters from Subscribers
Q: If the metals are moving up with the US dollar short term, would they not go down with the US dollar when it starts to fall?
A: In the February 14, 2013 Market Alert we meant that it was bullish on a very short-term basis (days) - something not even visible in the 10-day column in our Correlation Matrix. When the next significant move takes place, the medium-term correlations will likely take precedence - which are not even close to what we saw early on Thursday.
Still, later on the situation moved back to "normal" as metals responded with a move lower. However, compared to the 0.4 move higher in the USD Index, the $7 decline in gold is a pretty good result. All in all, gold responded negatively to the dollar’s strength, but the reaction was not big. Gold held up relatively well on a daily basis.
Q: Why are we not waiting until a sustained move over 1700 before getting back in? How much money do you see being made on this $50 rise? So far, I do not see much (and I'm basing this on the run up to 1692), compared to the risk of riding gold down to 1620, 1600, or 1550. What are your thoughts on the “odds” of a move to those levels? I don't want to be the last one out the door, nor do I want to be the first one in. Look at it this way: if I was out of the market today, would I feel comfortable getting in? Answer, “maybe”. But at current loss levels, I'm not comfortable staying - not with the prospect of testing lower lows, or an S&P 1000 pt. drop.
A: The key word here is “sustained”. Before a move over $1,700 becomes a sustained move, gold may very well be over $1,750. How much can we miss by not being ready? Quite a lot. In case gold goes down, we've got stop-loss orders that will take us out of the market.
An alternative to being long here would be placing an automated order that would get you in the market at higher prices. However, in this case you risk being a victim of a bull trap - with price moving higher only temporarily only to move lower in the following days. We've seen a lot of sideways trading in the past several weeks. If someone had buy orders at $1,685 and sell orders (stop loss) at $1,655, they would have a few perfectly wrong trades - buying close to the local top and selling close to the local bottom.
If you want to go long only after gold rallies for several days or weeks, you are free to do so. We will of course send out an alert when we think the rally is confirmed. However that might be at much higher prices and we believe that being long already is a good idea. As far as staying in the market vs. entering it - it's true that often an investor’s approach toward a position depends on when they opened it, however (with very few exceptions like in the question about IAU) this feeling is not something that will impact your returns. It's best to think about each position as if you didn't have it. Would you open a long position today? Would we suggest investing in gold if you didn't have any? Yes. We realize that it's not an easy thing to do to separate emotions from trading, but that's what is necessary.
This theoretical exercise might be useful: think about selling the entire position and immediately buying it back. The position no longer carries any emotional impact because you just opened it. If you do this only theoretically (imagine selling and buying back), then you will lose the emotional baggage that the position involves and you will not pay the transaction fees. It may sound ridiculous but in short, it works because of the same way emotions connected with trading make it harder to profit. Investors' brains/emotions trick them through various biases and in this exercise, you use the same trick to regain a cold perspective. Plus, if you think that the situation is not good enough for "buying back in", simply close the position (really).
At this time we view the odds of a move below $1,620 in the next 3 months at 25%, then 20% below $1,600, and 15% below $1,550.
Q&A: Here's an interesting comment on the current situation in the gold market. In general, we agree with the idea that the COMEX default doesn't have to happen soon.
Today (February 11, 2013) billionaire Eric Sprott told King World News that the massive plunge in gold scrap recycling may be removing as much as a staggering 850 tons of gold from world supplies each year. Sprott, who is Chairman of Sprott Asset Management, also warned of a coming default on the COMEX, “And when it (the default) happens, there will be a substantial move in the price of gold (and silver). We’ll make up for these last two years in no time.”
Eric King: “KWN has been receiving information from refiners for quite some time, and this was from one of the largest metals refiners in the world. In the secondary market, which is scrap, business is down almost 50% year over year, and the previous year was already a down year. The only supply now is coming from the miners. This applies to both gold and silver. Gold and silver bar and coin demand is very strong and the supply has essentially dried up.”
Sprott: “It’s interesting, Eric, that the data on recycled gold is woefully lacking. That’s what I hear from my discussion with people, and Johnson Matthey in their six month report suggested that their recycling was down. Your evidence is meaningful. That’s what I hear.
“Because the price has been static or down, essentially, for 2 years, the willingness to trade in gold rings and otherwise recycle some jewelry has diminished here. If it (recycling) is down 50%, I think recycling adds something like 1,700 tons to the gold supply above mine supply, well, that would imply a reduction of (a staggering) 850 tons (of gold supply)...”
Q: A while ago I bought IAU according to your top list of junior mines. In the meantime it dropped 80%. Going from $1 to $0.20! Can you tell me what happened with this junior and what are the prospects of this junior mine.
A: The last time IAU (Intrepid Minerals Corp.) was on our top gold junior list was in June, 2012, and in Oct 5, 2012 junior ranking posted it was no longer there (IAU.TO closed at 0.46 on that day). The company didn't meet our expectations regarding performance and we substituted it with other companies. Before providing each ranking we emphasize the importance of diversification, and we hope that other, outperforming, companies in your portfolio made up for this loss.
As far as the outlook for the company is concerned, it still doesn't outperform the sector, so we don't really like it at this time (we found that it’s better to stick to outperforming juniors). However, the company stock price is currently at a level that has provided support several times in the past - in mid-2007, at the end of 2007, in early 2008, in late 2009 and in early 2010. It's relatively close to the mid-2012 low as well, just like the junior sector on average (however, other juniors are, on average, above that low).
It might (!) be the case that the stock will come back with strength, but more likely other stocks will continue to outperform it. What to do depends on your junior portfolio. If your portfolio is not diversified and transaction costs (fees that your broker charges) are relatively low, sell IAU and diversify. If it is already diversified and IAU is just a small part, you can likely afford waiting several more days/ weeks to see if this company does indeed come back with a vengeance when gold and juniors move higher. If it continues to underperform, sell it.
Q: On the contrary there could be a big drop to 1500. The Fed wants to save the treasury market and the one way to do that is a big drop in the commodity and stock markets. Any selloff here would mean a big drop for junior miners.
A: The junior mining stocks are indeed highly correlated with the general stock market and the situation is tense in juniors and the rest of the precious metals sector. With stocks moving higher and juniors staying in the same place for months, one of them will have to give if the correlation is to be upheld. However, it seems to us that out of the two possibilities it would be juniors that will catch up with the rest of the market.
So far the Fed has been helping the treasury market by moving rates low and keeping them low, and it might continue to do just that. Triggering any artificial selloff would have a temporary effect for the commodities markets, for instance, because of the growth of China and because of the rising money supply (and the Fed knows that, even though they might say otherwise). And a plunge in the general stock market could have many negative consequences. Foreign bond buyers could view this as a sign of weakness in the US economy and a decreased probability of the bonds ever being repaid, which would actually harm the treasury market.
So all in all, the situation could certainly evolve as you described, but we don't see it as a likely outcome at this point.
Summary
The USD Index has moved higher this month but a cyclical turning point is just around the corner. Once the index reverses direction, a bigger rally will likely be seen in the precious metals sector. The general stock market may consolidate for a week or two led by the financials, but no big declines are expected.
Overall, the bullish situation in gold remains in place and RSI levels suggest an oversold situation similar to the major bottoms of 2011 and 2012. It seems that a rally will begin shortly - based on long-term cycles that suggest a major top will be seen after a few (3-7) months, preceded by a sharp rally.
The same situation described above is in place for silver, which has a cyclical turning point in play soon and had an unconfirmed breakdown this week. The outlook for the white metal is still bullish.
Finally, the mining stocks’ outlook is similar to last week, somewhat mixed except for juniors’ ratio to other stocks, which is bullish. Other markets are most important, however, and a rebound in mining stocks could be very powerful indeed.
Please note that the stop-loss orders were reached in the pre-market trading today ($1,629 – gold, $30.15 – silver). Consequently, the speculative long positions based on our analysis were closed. We think that we will re-open them soon, but since the stop-loss levels were breached, gold and silver might move quickly lower – so we will likely re-open the long positions at lower prices (likely when gold moves to $1,590).
Trading – PR: No position
Trading – SP Indicators: Long position in gold, silver and mining stocks
Long-term investments: Remain in the market with your precious metals holdings
| Portfolio's Part | Position | Stop-loss / Expiry Date |
|---|---|---|
| Trading: Mining stocks | Long (half) | - / Mar 6, 2013 (half) |
| Trading: Gold | Long (half) | - / Mar 6, 2013 (half) |
| Trading: Silver | Long (half) | - / Mar 6, 2013 (half) |
| Long-term investments | Long | - |
This completes this week’s Premium Update. Our next Premium Update is scheduled for February 22, 2013.
As always, we'll keep you updated should our views on the market change. We will continue to send out Market Alerts on a daily basis (except when Premium Updates are posted) at least until the end of February, 2013 and we will send additional Market Alerts whenever appropriate.
Thank you for using the Premium Service. Have a profitable week, a great weekend!
Sincerely,
Przemyslaw Radomski, CFA

