
It would behoove those who still cling to a misguided faith in fiat currencies to pay close attention to what is happening in Iran. The rial swooned in a free fall as much as 18% on Monday to a record low against the US dollar. The collapse was so steep that Iranian currency websites blanked out the rate. The currency has reportedly lost 80% of its value since the end of 2011. It is literally getting to a point that it will not worth the paper on which it is printed.
The economic sanctions imposed on Iran over its disputed nuclear program are hitting Iran where it hurts. Inflation is raging at an annual rate of 24 per cent, Iran has been all but frozen out of the global banking system, and its oil exports have been slashed. Britain, France and Germany are pushing for EU sanctions on Iran to be tightened further later this month, to close some of the larger loopholes. Iran's weak currency makes imports to the country more expensive and although a weak currency can theoretically make exports more attractive, Iran is in a bind since most countries don't want to trade with it.
And in a classic scenario, the Iranian government has tried to step in to make things better and bring the currency under control but has only made them worse. Last week it launched an exchange center aimed at stabilizing the rates, but the rial's fall has since increased. Previous attempts also include a sharp rise in interest rates in February and an order for an imposed exchange rate to be used both in banks and on the open market. At the time, the police were sent to change bureaus to implement the order but change bureau owners simply shut down and refused to comply.
Many Iranians have lost faith in the rial and are contributing to its instability by rushing to convert their assets and properties to foreign currency and gold. Turkish gold sales to Iran have soared as Iranians turn to the precious metal to protect savings.
Wait a sec. Isn't it for times like these, when the you-know-what hits the fan that one needs to have physical gold put aside?
Gold has proven itself to be good money time and time again throughout history. It possesses all the properties to make it so: divisible, portable, recognizable and, most importantly, scarce - making it a stable store of value.
Investor and newsletter publisher Dennis Gartman told CNBC Tuesday that "Gold is just another currency. It is doing well in other currency terms... I am not a gold bug. I don't think the world is coming to an end, but I think everyone needs to own some gold."
We bet there are plenty of Iranians who wish now that they would have thought of buying gold earlier.
Pimco founder and co-chief investment officer Bill Gross, in his monthly investment outlook also posted Tuesday, said only gold and real assets would thrive in a “ring of fire” of U.S. fiscal problems.
In his piece, Gross warned the U.S. would no longer be the first destination of global capital seeking safe returns if it doesn't address its fiscal gap. The U.S. will begin to resemble Greece before the turn of the next decade if it continues to close its eyes to deficits, Gross said.
Unless we begin to close this gap, then the inevitable result will be that our debt/GDP ratio will continue to rise, the Fed would print money to pay for the deficiency, inflation would follow and the dollar would inevitably decline. Bonds would be burned to a crisp and stocks would certainly be singed; only gold and real assets would thrive within the "ring of fire," Gross said.
Right now all currencies on the planet are backed by debt. If you need a refresher course in why fiat money can become toast, here are some words published this week on the website of Texas Congressman Ron Paul:
Fiat money is not good money because it can be issued without limit and therefore cannot act as a stable store of value. A fiat monetary system gives complete discretion to those who run the printing press, allowing governments to spend money without having to suffer the political consequences of raising taxes. Fiat money benefits those who create it and receive it first, enriching government and its cronies. And the negative effects of fiat money are disguised so that people do not realize that money the Fed creates today is the reason for the busts, rising prices and unemployment, and diminished standard of living tomorrow.
This is why it is so important to allow people the freedom to choose stable money. Earlier this Congress I introduced the Free Competition in Currency Act (H.R. 1098) to permit people to usegold as moneyagain. By eliminating taxes on gold and other precious metals and repealing legal tender laws, people are given the option between using good money or fiat money. If the government persists in debasing the dollar - as money monopolists have always done - then the people would be able to protect themselves by using alternatives such as gold that are both sound and stable.
As the fiat money pyramid crumbles, gold retains its luster. Rather than being the barbarous relic Keynesians have tried to lead us to believe it is, gold is, as the Bundesbank president put it, "a timeless classic." The defamation of gold wrought by central banks and governments is because gold exposes the devaluation of fiat currencies and the flawed policies of government. Governments hate gold because the people cannot be fooled by it.
We all know that gold has gone up spectacularly in the last decade. If you want to look at the numbers just for the sheer pleasure of it, here is a list. (The ones, who will get the most enjoyment from this list, are those that got into the gold trade in its earlier stages.)
2000 — $273.60
2001 — $279.00
2002 — $348.20
2003 — $416.10
2004 — $438.40
2005 — $518.90
2006 — $638.00
2007 — $838.00
2008 — $889.00
2009 — $1096.50
2010 — $1421.40
2011 — $1566.80
2012 — $???
To see if we can fill in the question marks let's begin this week's technical part with the analysis of the US Dollar Index. We will start with the very long-term chart (charts courtesy by http://stockcharts.com.)
USD and Euro Indices
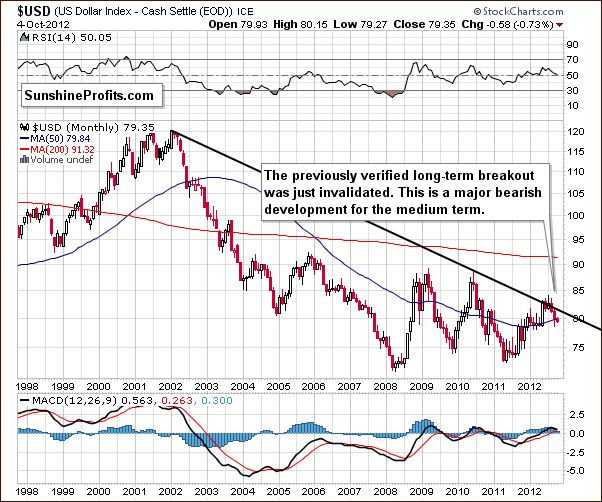
Very little changed from this perspective and what we stated in last week's Premium Update is still up-to-date and accurate:
There were no long-term changes this week and the picture remains bearish because of the invalidation of the previous breakout (…) This is an important bearish phenomenon for the medium term, and the implications for the months ahead are quite bearish.
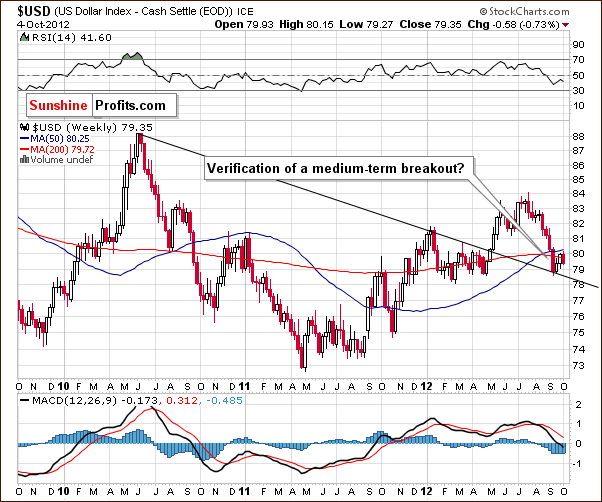
This week, we are including a look at the medium-term USD Index chart. This perspective is something right in between the above long-term picture and the short-term chart below and it allows us to use two important local tops (from 2010 and 2012) to create a support line. Adding this support line to our chart adds value because clearly this support line has stopped the decline seen recently in the USD Index and therefore improves the bullish outlook.
In fact, taking into account this perspective alone, the outlook is bullish and upside target levels are in the 81-82 range or even higher. While a major rally does not appear likely based on the long-term picture, a smaller upswing appears quite possible from a medium-term outlook. Combining the implications and signals of the two, it seems that another attempt to move above the declining resistance line (seen on the long-term chart) is a good possibility in the near term.
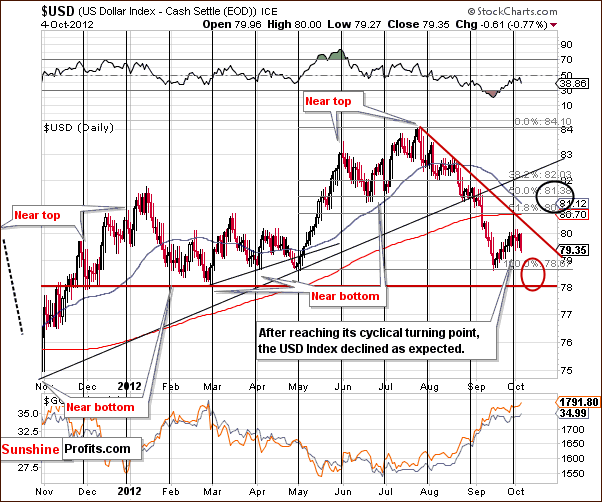
A look at the short-term chart this week is also quite interesting. In our Market Alert earlier this week, we mentioned that the USD Index could move lower based on the cyclical turning point and that gold could rally. If such a rally was seen on low volume, it would likely be a bearish confirmation and a possible sell signal for the yellow metal.
While it's true that the index declined on Thursday, it's not clear whether more declines will be seen right away. We do see a downside target area in the 78 to 80 range; a move to the medium-term support line (seen on the medium-term chart) would coincide with a move to the September bottom – only slightly lower.
After reaching its next bottom, a rally will likely follow and a move to the declining red resistance line or even higher is possible. This is consistent with the medium-term picture presented earlier. A move to one of the Fibonacci retracement levels between 80.7 and 82 is also a good possibility based on it. The important point is that no matter where exactly will the coming move higher in the USD Index end, it will likely trigger a decline in the precious metals sector when it starts.
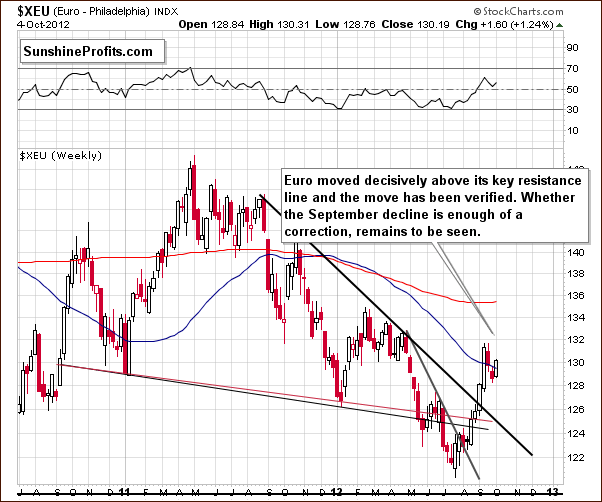
In the long-term Euro Index chart this week, we see a bullish picture for the medium term, but further consolidation or verification of the previously broken resistance line could take place. There are really no short-term signals seen this week. A move down to the 124 level would not be surprising, and this would not invalidate the current bullish medium-term technical picture.
Summing up, all-in-all we could still see another small decline in the USD Index followed by a bigger rally and then a continuation of the decline. There appears to be a good possibility for a correction in the precious metals sector when the USD moves higher again.
General Stock Market
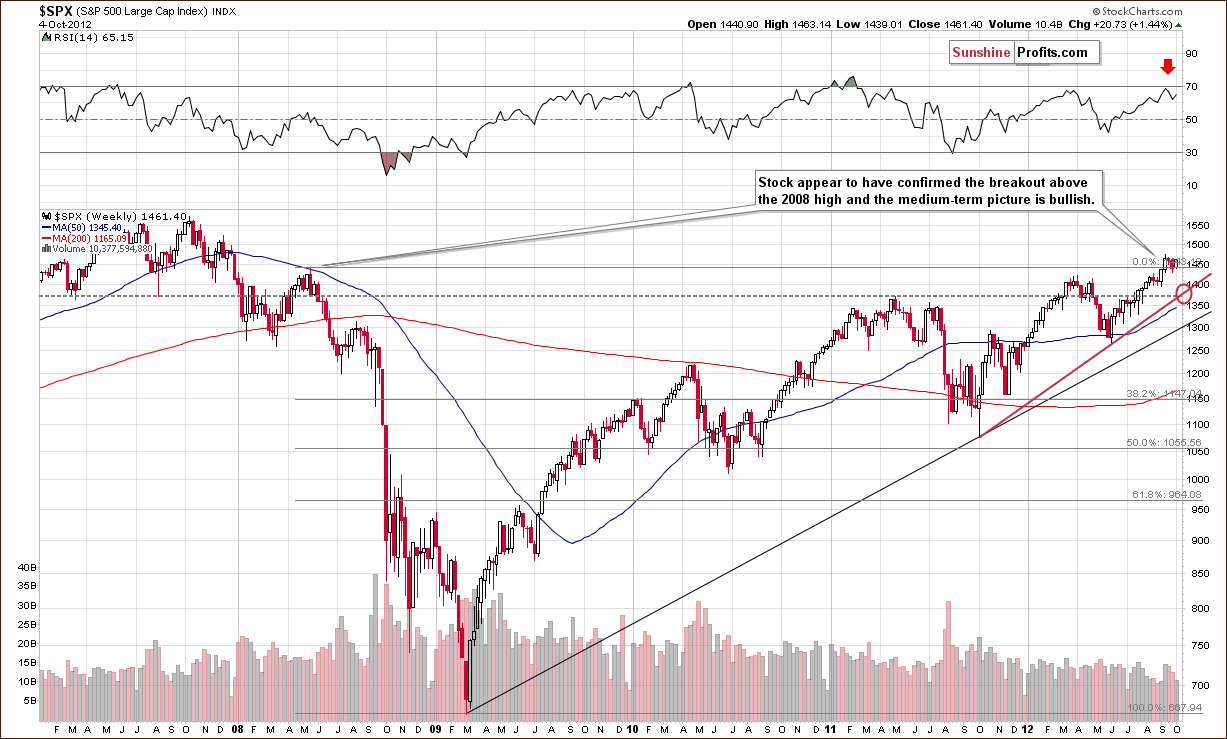
In the long-term S&P 500 Index chart (please note that you can click the above or any other chart to enlarge it), we see very much what was described in Tuesday's Market Alert this week.
The S&P 500 didn't really decline below 2008 lows last week and it holds up quite well also this week. At this time the move above the 2008 high appears to be verified. Additionally, the DIA ETF touched the neck level of the previously-completed reverse head-and-shoulders pattern, which is a bullish development as it further verifies the breakout.
The Transportation Average and financials don't confirm the above bullish developments, but their impact is not short-, but medium-term. So, it seems that a rally in stocks is in the cards. The situation is now more bullish than not.
Stocks verified the move above their 2008 top and the picture here is now bullish.
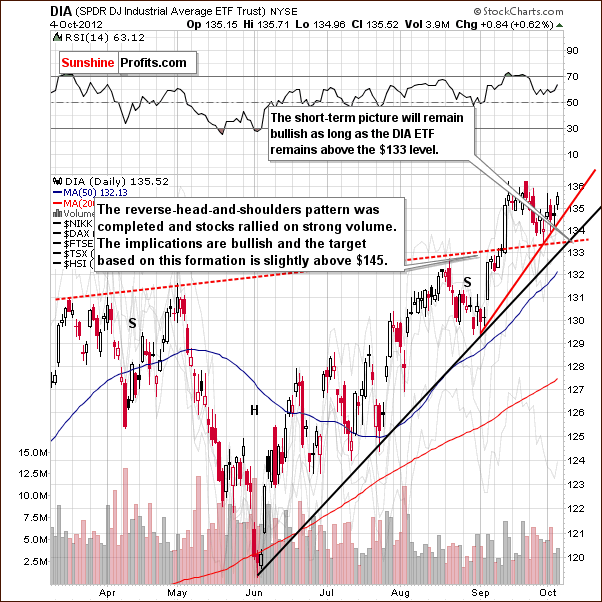
In the short-term DIA (a proxy for the Dow Jones Industrial Average), a move to the upside was seen on Thursday but was accompanied by low volume which is normally a bearish factor. The price patterns here however have been very bullish as a reverse head-and-shoulders pattern has been completed and verified by a pull back. It seems that it would take a close below the $133 level here to change the picture here to bearish.
Summing up, both charts appear bullish as we look ahead except for the small issue of low volume on Thursday. With the DIA now significantly above $133 level, the outlook is bullish at this time.
Crude Oil
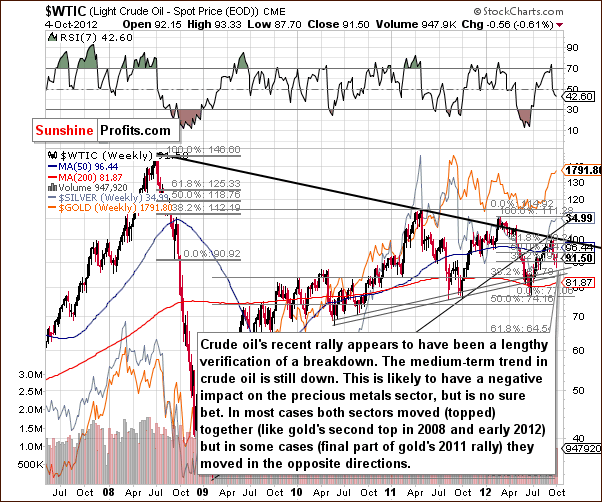
Turning to the crude oil price chart, we appear to have a verification of two breakdowns as we discussed inlast week's Premium Update. We stated that prices were recently at the intersection of two most important resistance lines. The medium-term situation remains bearish as the previous breakdown has not been invalidated. This is a slight indication that commodities in general may need to correct some more before another rally emerges.
This week the decline has continued and this could have a negative impact on precious metals prices. This is by no means a sure bet, however, for while crude oil prices and precious metals prices usually move in the same direction, this is not always the case. There is a slight chance that declining oil prices will not take the metals along with them at all.
Correlation Matrix
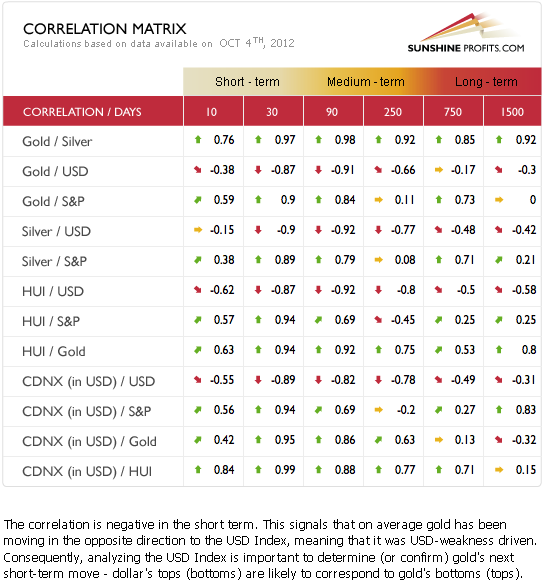
The Correlation Matrix is a tool which we have developed to analyze the impact of the currency markets and the general stock market upon the precious metals sector. Generally, the short-term 30-day coefficients are still in the classic mode this week. The USD Index is negatively correlated with gold, and the general stock market is positively correlated with the precious metals. This means that the USD Index situation translates into considerable risk of correction in the precious metals market. This is something which could be seen a few days from now.
The general stock market has bullish implications in the short and medium term, so all-in-all, these two markets suggest caution for the short term. At this time however, no direct sell signals are evident for the precious metals sector.
Gold
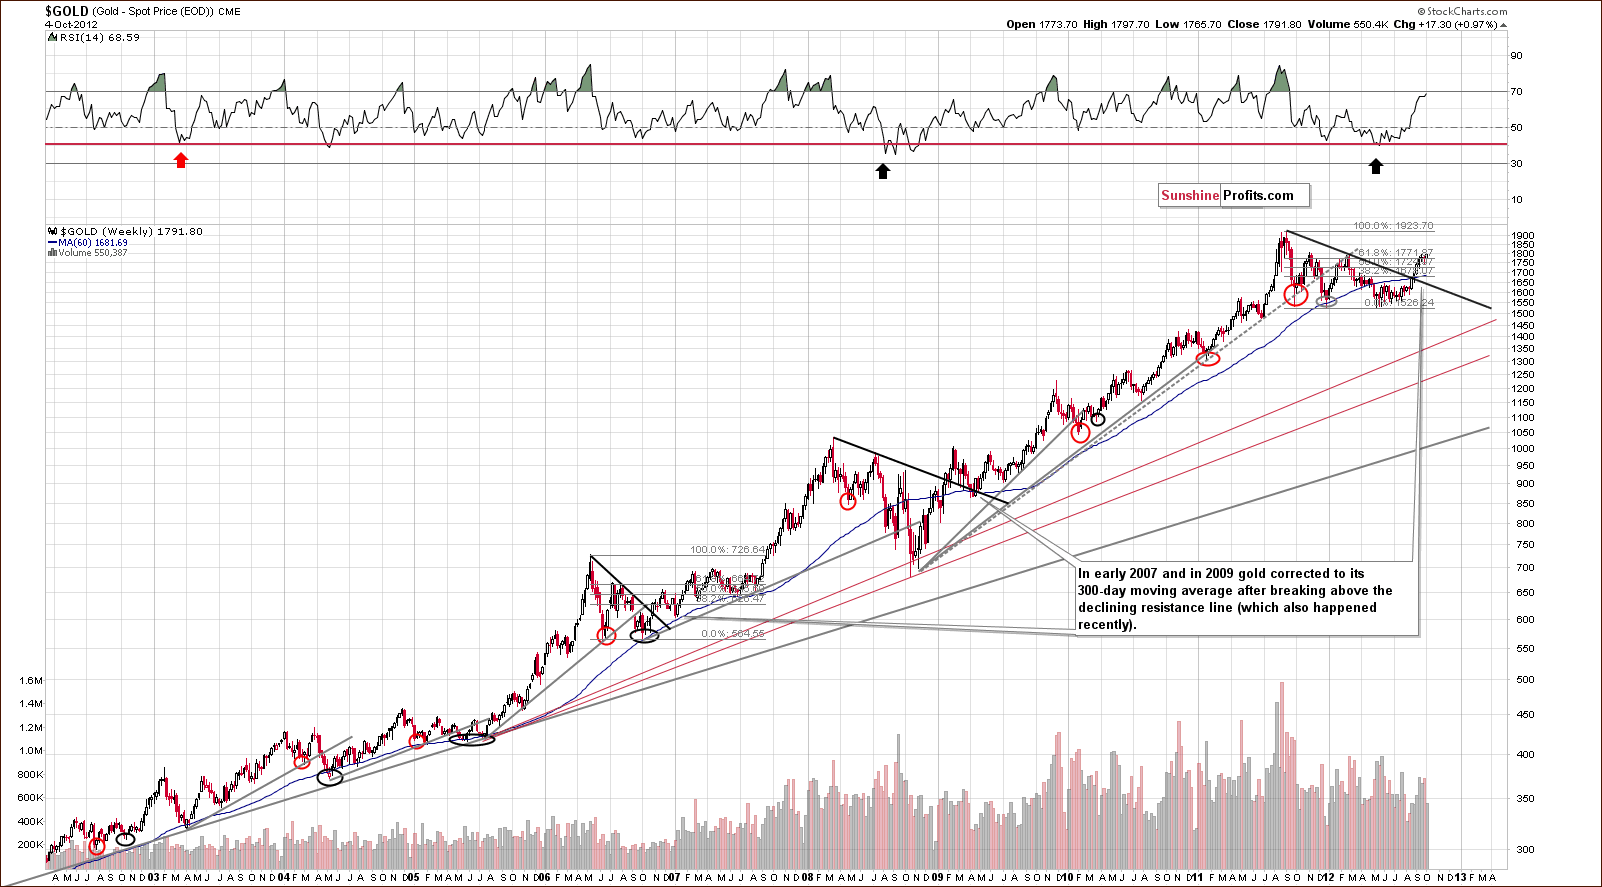
In gold's very long-term chart, not much change was seen this week. The RSI level is at 68.59 which is now pretty close to 70, a classic sell signal. This is only slightly bearish though, as higher levels have been seen in the past on many occasions and gold didn't decline.
The more bearish development is the price of gold moving to the level of previous highs (you can see that on the next chart as well). The breakout above the declining resistance line was not followed by a move to the 300-day moving average, however, as is usually the case. This move could still be ahead of us, so a correction would not be surprising here. Conversely, it is likely.
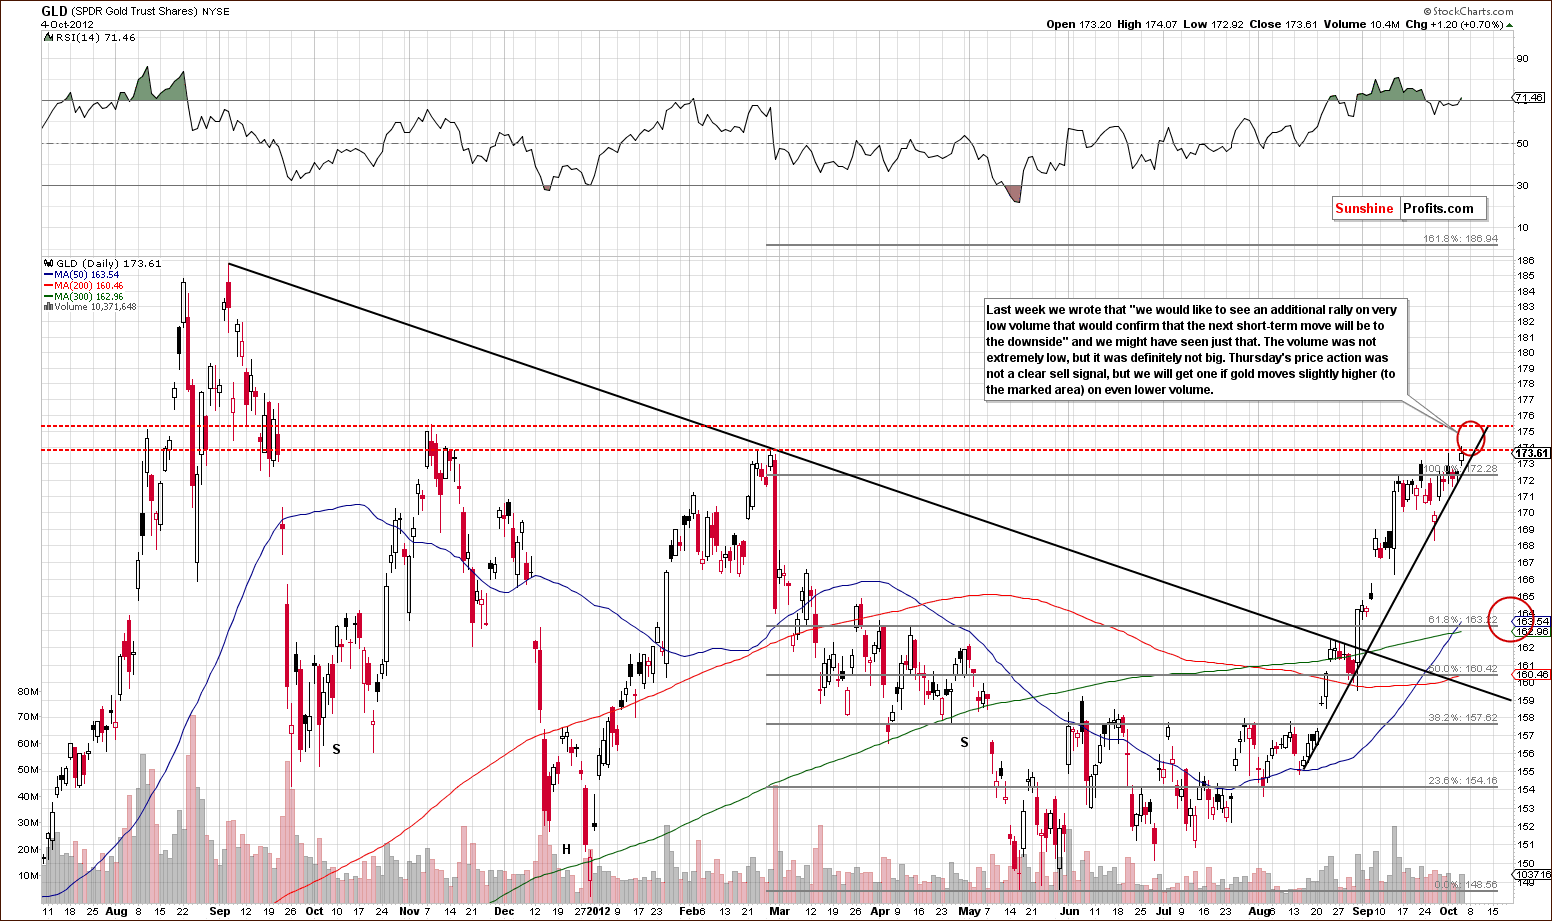
In the short-term GLD ETF chart, we see a sharply rising support line. A breakdown below the rising support line would paint a bearish picture for gold and the rest of the precious metals sector – that's why in this week's Market Alert we suggested placing an order that would enter a short position if gold moves significantly below this line. Prices have recently been approaching the February high and even last year’s November high. If the USD Index declines (and as mentioned in the USD section of this update, we expect such a decline to be quite modest), we could see a temporary move above this week's high likely stopping at the level of last November's high.
Please note that gold prices rallied on Thursday but the rally took place on rather average volume. This by itself is a bearish indication because we would expect to see the continuation of the rally on strong volume if the move was to take gold above strong support levels, such as those created by Feb 2012 and Nov 2011 highs. Average volume is not a sell signal, though.
If prices do rally further on low volume levels (significantly lower than what we saw on Thursday), we may suggest shorting the precious metals sector even before the rising short-term support line gets broken. Downside target levels for the GLD ETF are close to $163 to $164 and remain unchanged fromlast week. This corresponds to $1, 680 to $1,700 for spot gold.
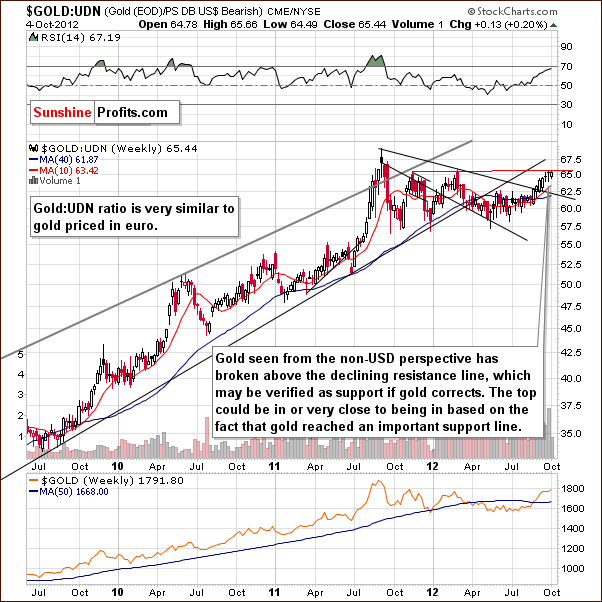
In this week's chart of gold from the non-USD perspective, we do not see many details this week. The resistance line has been reached, and a correction appears to be in the cards with the RSI level close to 70.
Last week we wrote the following regarding the above chart:
An important resistance line was almost reached here, and it seems that it could be engaged one more time. Sell signals are not crystal clear from this perspective. Traders should wait for a better risk-reward ratio before opening short positions.
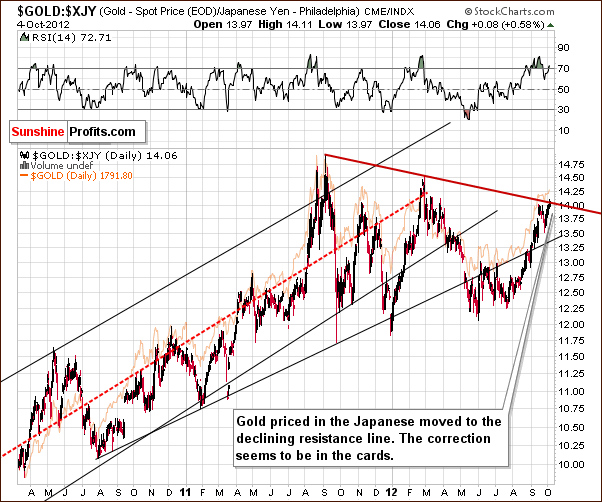
In this week's chart of gold from the perspective of the Japanese yen, we see prices have indeed rallied and finally reached the declining resistance line. This line has not been touched since February-March and though a decline is not inevitable, it is more likely now that the resistance line has been reached and the RSI level is also above 70.
Double tops are quite common here and are generally followed by significant declines. Simply put, we have a more bearish picture here today than was indicated last week.
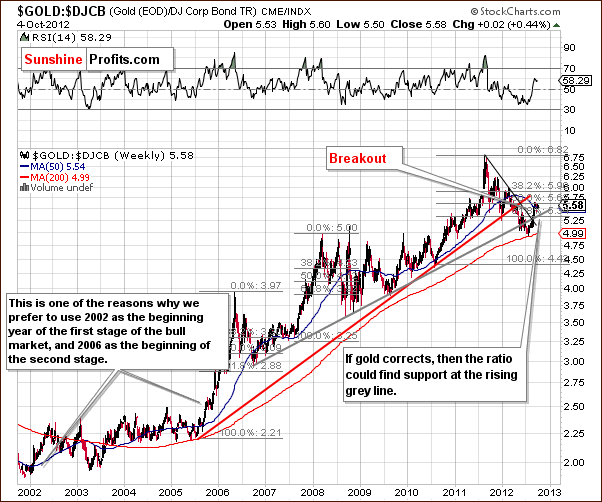
In the gold-to-bonds ratio chart, no important sell signals are provided this week. The suggestion is that the coming declines are likely to be stopped by the rising grey line which would be a correction of about one-half of the preceding rally. Comparing this chart to the short-term GLD ETF chart confirms the above-mentioned downside target levels.
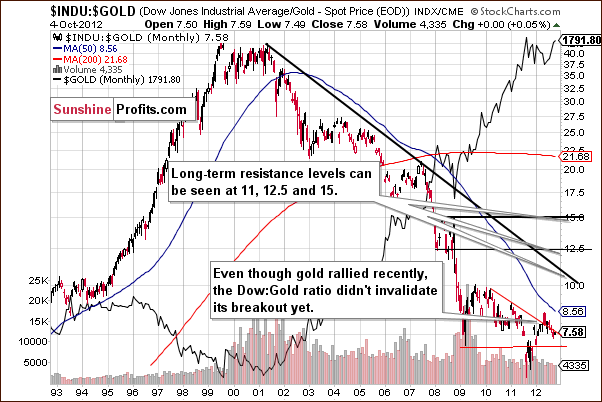
In the Dow to gold ratio chart, there is no new information this week as the ratio is right at its declining support-resistance line – the situation remains tense. This has been the case for several weeks now.
Summing up, the situation in gold appears to be developing as indicated earlier – gold is moving insignificantly higher on relatively low volume. The volume is not very low, so we don't have a sell signal yet, though. However, it seems that a sell signal will be seen quite soon – we suggest editing the order for entering a short position by changing the price at which the order would become effective.
What we suggest for risk-averse traders (most traders fall into this category) is to place an order to short the metals market that is triggered if gold moves to (below) $1,760. We do not suggest shorting metals now, because the risk of correction not taking place is too high.
Silver
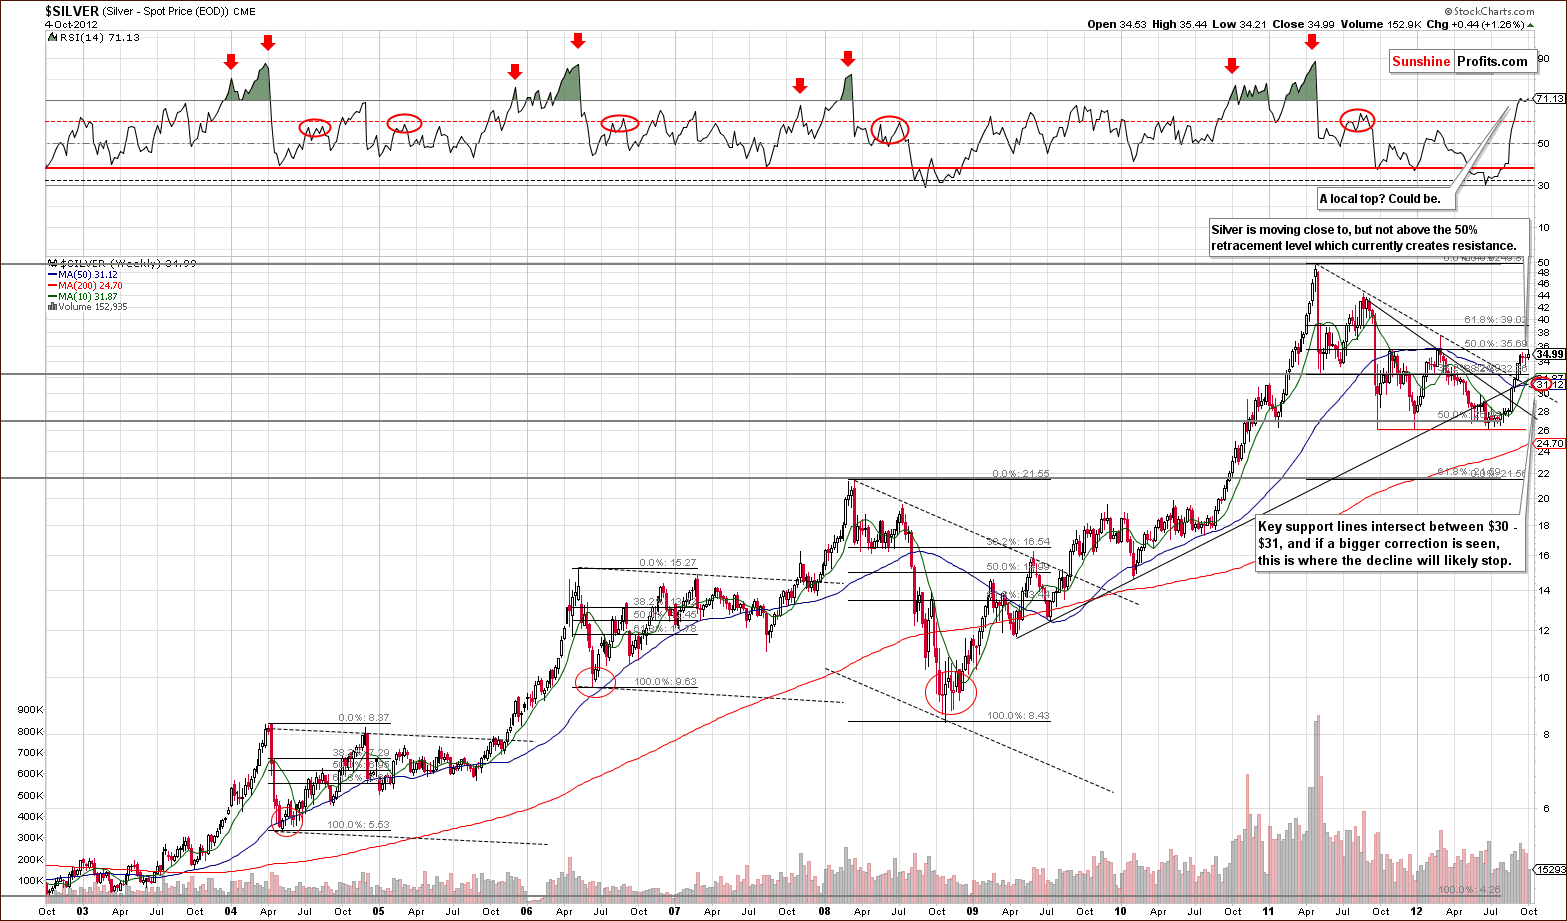
In the long-term chart for silver this week, there is very little change from what we saw last week. The RSI level has moved above 70 confirming an overbought situation on a short-term basis, and a correction is likely here. The price target for the coming correction is $30 - $31, however we will likely focus on the gold market to obtain most reliable exit signals (and – of course – our in-house developed precious metals indicators).
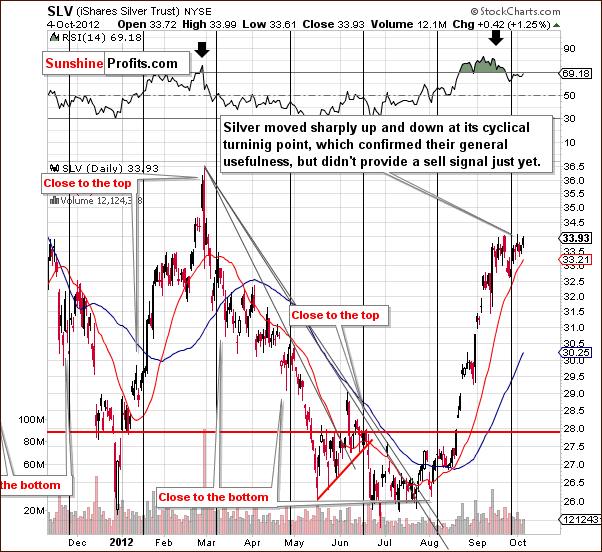
In the short-term SLV ETF chart, we see a similar picture this week. The recent cyclical turning point worked as declines were seen and followed by a small contra-trend move to the upside. So not too much new information has been provided, and the true correction still seems to be ahead of us.
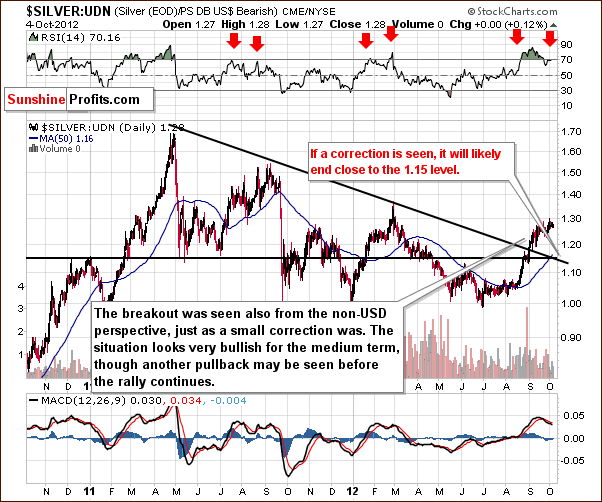
In this week's chart of silver from the non-USD perspective, there is no new information forthcoming either, and the target level is still at 1.15. This is where silver would verify a breakout above both the horizontal and the strong declining support lines.
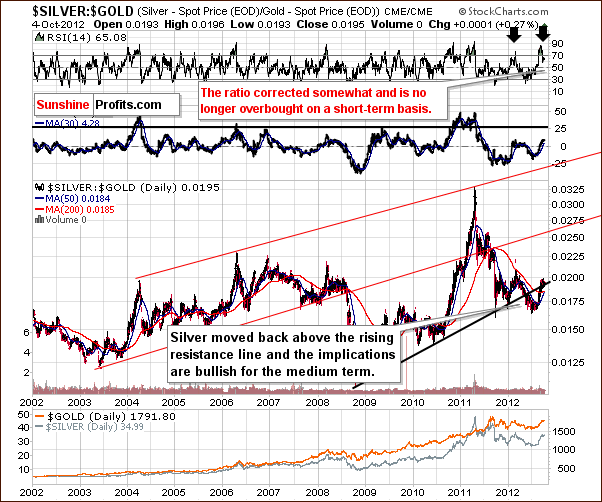
In the silver-to-gold ratio chart, no change at all is seen this week. Silver continues to verify a breakout move above the rising support-resistance line and the medium-term picture remains bullish.
Summing up, the silver situation is pretty much the same as what was seen for gold. The white metal is heavily overbought on a short-term basis, and a correction is still likely. Clear sell signals have not yet been seen.
Mining Stocks
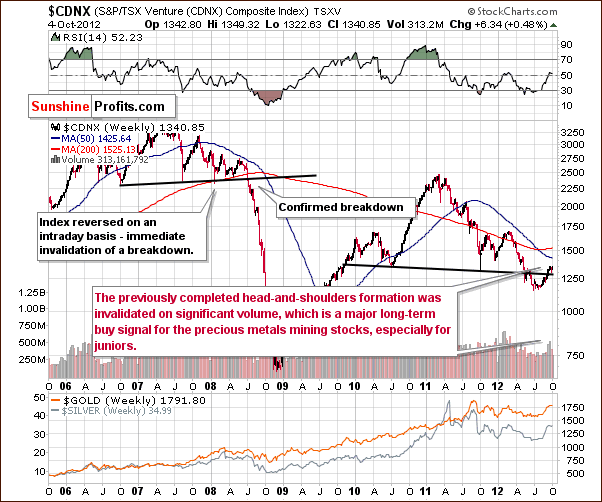
In the Toronto Stock Exchange Venture Index (which is a proxy for the junior miners as so many of them are included in it), we see a confirmed move back above the recent bearish head-and-shoulders pattern. The situation is now bullish, and the long-term picture for the precious metals stocks looks very favorable at this time, particularly for the junior miners.
Speaking of juniors and their timing, please take a look below at our SP Junior Indicator:
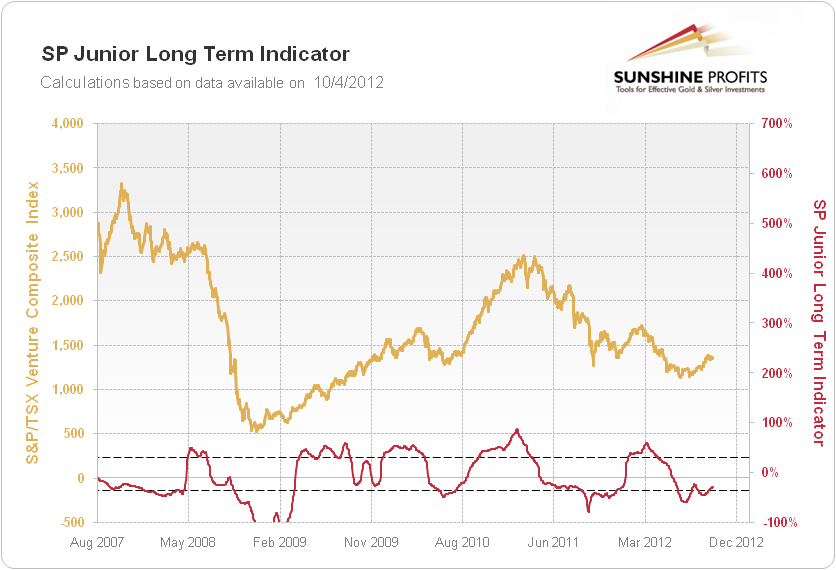
As you can see, the indicator moves somewhat in tune with juniors, with the main difference being that it moves horizontally. Thanks to this and overbought / oversold levels (dashed lines), we can see if juniors are currently overvalued relative to senior mining stocks or vice-versa. When the indicator is overbought and starts to decline, it's time to limit one exposure to the junior sector, and when its oversold and starts to move higher, it's time to increase one's juniors' holdings. As you can see this approach was useful not only in 2008 but also in the most recent years. The key point here is that the SP Junior Indicator is moving higher after being oversold for several weeks – which makes it a very good time for one to think of increasing their exposure to the junior miners.
Please keep in mind that both above charts are of long-term nature, which means that they don't tell us anything about the short-term price moves – a correction may or may not be seen based on them, all they tell is that no matter if a correction is seen or not, juniors will likely thrive in the following months.
Having said that, let's move to the senior mining stocks. We will provide you with up-to-date junior rankings in the following section of this update.
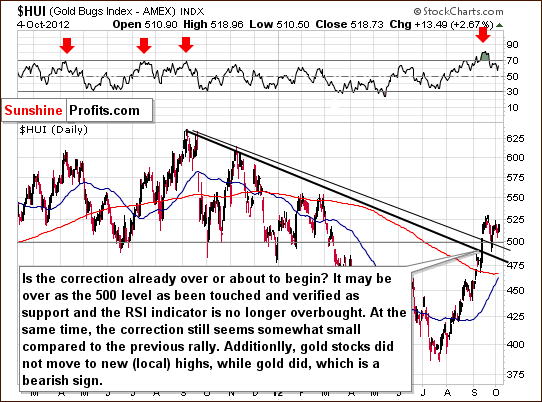
In this week's medium-term HUI Index chart, there is no bullish confirmation provided right now. Gold stocks have not moved to new local highs although the yellow metal itself did so. This suggests that a correction is likely just around the corner for the gold stocks.
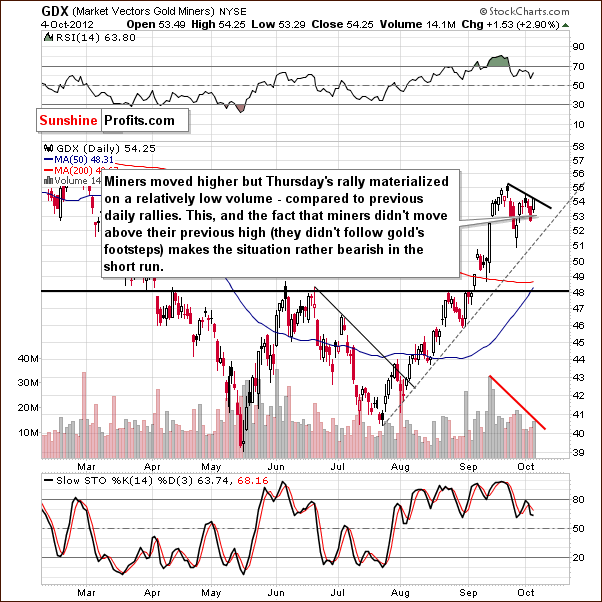
In the GDX ETF short-term chart, we have another confirmation of the bearish outlook for the miners. We have seen low volume levels for several days now when compared to the average volume seen during the previous rally. Low volume has actually accompanied every move to the upside (7) since mid-September (including Thursday's move). This is a bearish signal.
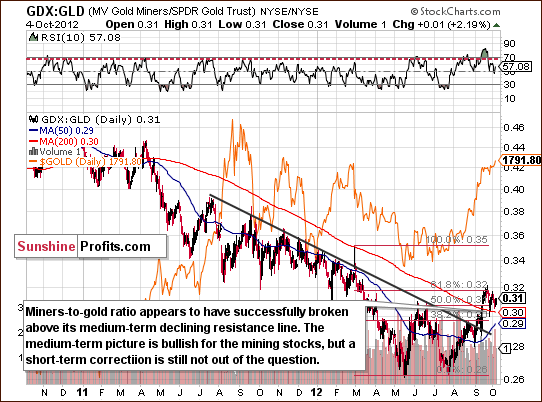
In the long-term miners to gold ratio chart, we have bullish implications for the long term. While there are no short-term implications here, the mining stocks are well positioned to outperform gold in the months ahead. In the next month or two, a correction could be seen in the precious metals as well as in the ratio. This would not be surprising, and as long as the ratio stays above the declining support line, the long-term picture will remain bullish.
Summing up, the mining stocks picture this week is similar to that of silver and gold. Additional details with respect to volume levels and with ratios to gold are provided in the mining stocks charts. The miners did not move to new highs even though gold did and this along with the low volume levels is a bearish signal.
Sunshine Profits Indicators
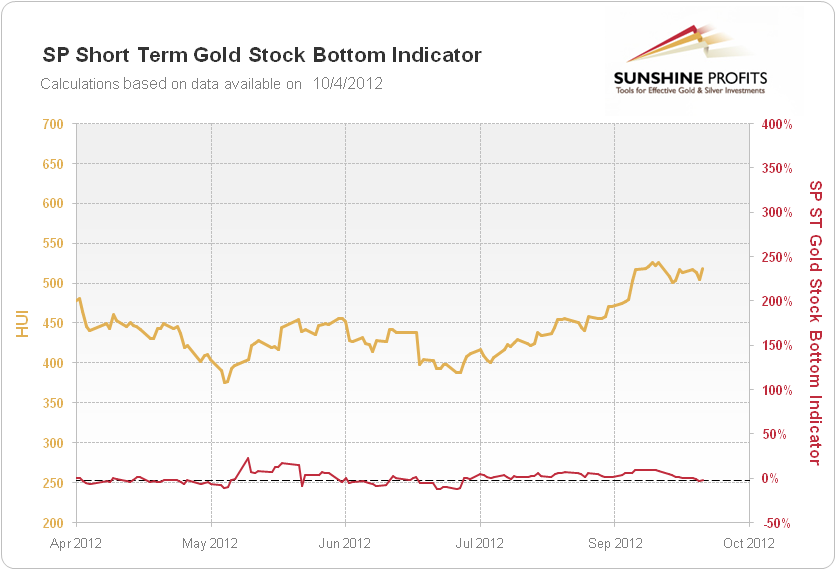
The SP Short Term Gold Stock Bottom Indicator just moved slightly higher after moving below the dashed horizontal line, which means that it flashed a buy signal. This signal is based on mining stocks and it works best on this sector (it works with smaller precision also in case of gold and silver). Let's see how it worked in the past few years:
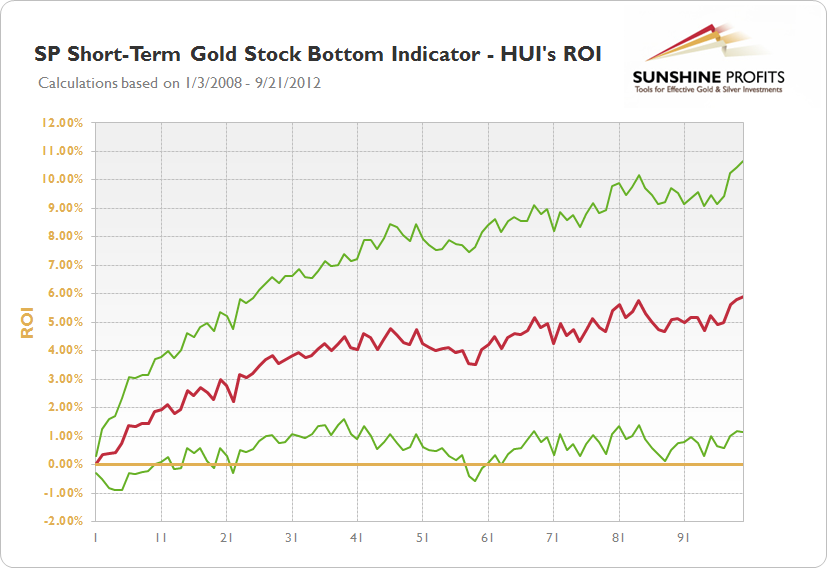
The red line shows average performance of the HUI Index after the signal is seen. The green lines show you how different particular rallies (those that created the average performance) were from each other. Generally, the wider the gap between two green lines, the less certain it is what the price will do. Based on the variability of HUI Index after the signal was seen we estimated that there is 90% probability (based on statistical calculations) that the HUI Index will move between the green lines.
As you can see the price may move temporarily lower (which could be what we saw earlier today) but that it is likely to rally soon anyway. This is caused by the fact that this particular indicator used to be early in predicting a bottom in many cases in the past.
Combining the signal, its performance and the current market situation that we described above – we believe that this indicator suggests that the precious metals market will move higher one more time before correcting – perhaps gold will move to the November 2011 high and the mining stocks will move to their 2012 high. If this is going to happen on low volume then it could provide us with a shorting opportunity as discussed earlier, but – for now – our indicator suggests that going long is a good idea.
Consequently, we suggest opening a speculative position in mining stocks (say GDX ETF) using the other part of your speculative capital. This does not mean that you should use 50% of your trading capital for this trade, but that you should make the position size 2x smaller than it would be if you didn't divide your trading capital between two sources of signals. So if you normally decide to open a position that is 5% of your trading capital, then please open a long position with 2.5% of your capital.
We suggest putting a stop loss order for the long position in the GDX ETF at $51. The rally that our indicator is suggesting will probably be short-lived.
Junior Mining Stocks Ranking
As stated in the Gold & Silver Portfolio report, the list of topjuniorswill be updated approximately every 4 weeks, usually at the beginning of the month. In previous months we didn't provide the top rankings because the situation in the junior miners didn't look favorable. However, it currently looks very favorable (invalidation of the long-term head-and-shoulders pattern, bullish general stock market charts and a highly positive correlation between stocks and juniors), so here we are.
We have updated the method we use for junior stock selection, and we have also begun reviewing our selected juniors manually. In our view, one of the most important considerations when choosing junior mining stocks is their performance relative to the rest of the sector and also their strength during a decline and the subsequent bounce. For juniors, we can't apply as sophisticated algorithms as with senior gold stock rankings and silver stock rankings because the market is too small in each junior's case and the small price moves may not properly reflect the stocks' true value. It is for this same reason that junior mining stock prices can be manipulated more easily (diversify to lower the risk of being affected!). And it is also why we don't analyze individual juniors from the technical perspective on a regular basis.
See the results of our latest research on juniors in the tables below:
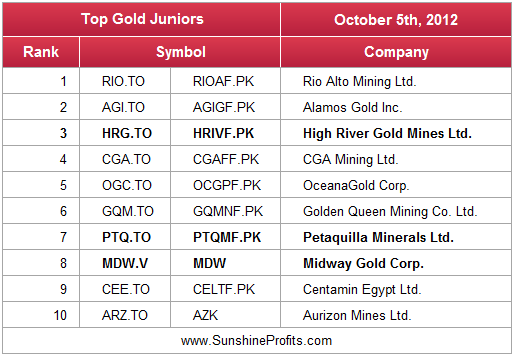
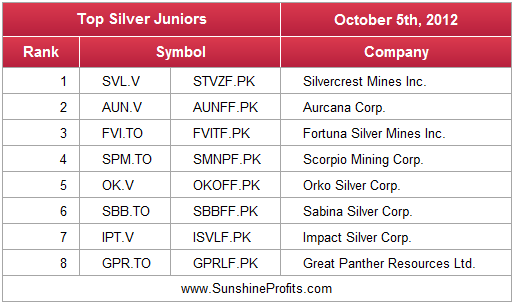
The majority of stocks that were in our rankings several months ago are still in them even though we made calculations on an adjusted dataset. This implies that the fundamentals behind companies are most likely solid as they consistently perform well. This does not refer to each company individually because they all have their ups and downs, but to all of them at the same time – they seem to average out each other's downs and ups and at the same time provide good profit potential – which is exactly what we strive for when constructing juniors portfolio.
As you probably noticed, three companies were put in bold in the gold ranking: High River Gold Mines, Petaquilla Minerals and Midway Gold Corp. These are the companies that were not previously included in our rankings and that we added based on improved selection algorithm. Adding them to your junior holdings should prove profitable in the coming months (even if the precious metals market corrects here).
Letters from Subscribers
Q: I am writing to get some perspective on why the price of gold is rising. Many commentators say that QE 1, 2, 3 has contributed to the fear of inflation so many are running to gold. Yet QE has not produced inflation since the Federal Reserve is just buying financial notes and requiring the banks to hold more in reserves.
Where is the effect of inflation coming into the gold market? Is it China? Is it the fear of a financial Armageddon? Is it the euro and Europeans who are dealing with a recession which has gotten out of hand? Why is the price of gold just going up when the price of oil is tame and under control? What am I missing? Why have you not written about the German banks that will collapse under the weight of European sovereign nations defaulting on their obligations? Every commentator says that the German government should help the southern European countries but who will help the German banks? I realize that the only voice of sanity is coming from your articles, arguing that the sky is not falling. Thank you.
A: Much of the reply to your question depends on how one defines inflation. We prefer to use the old (old-fashioned?) definition that says that inflation is an increase in the general level of prices caused by increases in the money supply. According to this definition QEs don't really cause inflation - they are inflation. Yes, the Federal Reserve is buying financial notes (thus monetizing debt), but this is what causes the value of money to drop. By inflating (=decreasing in real terms) the overall debt levels, it allows for additional government spending in various forms.
The value of the dollar has to go down given the increased supply and no increase in demand - but what would it move down against? The euro? The Europeans will have to run their own printing presses in order to devalue their own debt levels and so will a large part of the world. Currencies will sink at similar rates so they will not seem to decline from the point of view of the exchange rates. However, they have to decline in value against real things like energy, food and gold, because while the number of papers with different symbols (a.k.a. fiat money) is unlimited, the supply of gold and crude oil is limited. Real things, tangibles, have real costs to produce and their supply cannot simply increase indefinitely.
That's why tangibles' prices will have to go up when monetary authorities around the world really start racing for the title of "most effective destroyer of currency value." In fact, this race is already underway and prices of commodities reflect that. Where was copper 10 years ago? Where was crude oil? Finally, where were precious metals? All of them were many times cheaper back then. The trend is already in place, and inflationary forces are ensuring that the commodities bull market remains in place.
Our take is that the German banks will not be allowed to collapse. We think that it's much more likely that the same thing will happen to them (if necessary) as with Greece: they will get money to prevent a collapse. Where will they get huge amounts of money? From the printing presses and the electronic means of creating money.
Do we think that the sky is falling? Generally, we do. However, we think that the upcoming global monetary crisis will not happen immediately. History shows that currency crises happen later than anyone expects and they are more profound and volatile than anyone assumed. Our gold and silver portfolio structure report reflects that - we suggest holding a portfolio that will keep you covered regardless of when the inevitable happens - tomorrow or in 20 years.
As forgold and oilwe suggest going to thereports sectionand reading about the relationship between gold, silver and crude oil in detail. In short, the relationship between the two is very loose, and they can even trade for months independent of each other. Precious metals and other commodities are in bull markets but they can move relatively independently in the medium- and especially short-term.
Q: Hi, and thank you for your very detailed reports. I would like to buy gold and silver penny stocks. While I understand that these are very risky, I also know that some of them are sitting on huge deposits and so far they are unrecognized by the public. Do you have a few of each (gold and silver) that you could mention? Thank you.
A: Yes, we have and we have included the ranking of our top gold and silver juniors mining stocks in today's update.
Additional Information
As we promised last week the small charts with intra-day prices are back on the website, so if you – like us – used to check the intra-day gold, silver and platinum price moves on sunshineprofits.com – you can do it once again. You will find the Metals Charts block on the right side of the website in several places on the website, for instance in the Premium Updates section (note that it’s in the right column right now; you will likely need to move up a bit to see it).
You already saw another improvement that we made since the last Premium Update was posted – the algorithm behind junior stock selection. An improvement that is more than 20x significant as this one will be introduced to the juniors ranking in the following months, but for now you still have the most up-to-date ranking (actually two of them) based on our most up-to-date methodology.
This week’s big news at your website (SunshineProfits.com) is the release of theHow to Buy Goldsection – it's under Research in the menu.
Ever wanted to weigh the pros & cons of all forms in which precious metals are available? Now you can. The new section on our website called "How to Buy" reveals it all. It assigns ratings to ETFs, stocks, coins, and all other forms in which one can buy precious metals. It enables you, as an investor or trader, to clearly see which of these forms are more useful to you.
This is something that will be most useful to beginning investors (like Eric from the video on the homepage), but it should prove valuable also to those who are more experienced, for instance if a new way of gold ownership is introduced – you could quickly compare it to the ones that we already covered and see if it has more advantages and less disadvantages than what we suggest.
It should also be invaluable when your friends ask you (knowing that you are interested and have experience with precious metals) how they can buy gold - you can simply refer them to this section – easy as that. You could then explain the situation further in greater details or you can simply tell your friends to ask us – we’ll do our best to explain in a timely manner. As for the how-to-use section - we will make sure that it’s up-to-date and easy-to-use when you or your friends get there. We strived to make the list clean and straightforward as possible with only the most relevant details being present in the table. The details are hidden in reports.
In order to access a report about a given way of purchasing gold, simply click on its name in the first column in the table – the links are put in bold and have red underscore, just like many other links on the website.
Please note that the table in the how-to-buy section is interactive – you can click on the header to sort it – clicking on “traders” and “investors” will be most useful as it ranks way to buy gold in the order that we believe is suitable for traders or investors. Futures, for instance, are pretty much useless for long-term investments, but they are good for speculative purposes.
As a reminder, you can readupdates,publications,definitionsetc. in the reader-friendly mode that we recently introduced after we received a few requests from you 2 weeks ago. In order to use it, please click the book icon slightly above this paragraph on the right side of the text (on the right side of the “PREMIUM UPDATE” title).
---
On an administrative note (if you have already updated your account or subscribed this/last week - thank you, you can safely ignore the following part of this message), we would once again like to ask you to update your account - along with introducing the new website, we had to move to a different payment processor and we are not able to properly work with the previous payment processors. That's why moving to the new payment processor (fully integrated with the new website) is necessary for each premium account. Actually, this is good for you because for instance the PayPal system didn't allow us to give someone an extra week of access as a small thank-you for sending us some suggestions regarding our services. Naturally, the next payment will be made when it's due, not when you update card details (technically, you may see an authorization - not a payment - for $1). So, please take a few seconds to update your account here:
We will individually check each premium account to see if everything was updated successfully and if so, we will take care of cancelling the subscription that you had using the previous payment system - so you don't need to worry about it. Of course, you can do it yourself as well.
On a side note, this may be a good moment to switch to a quarterly or yearly plan - it's convenient, because you will need to select a payment plan anyway to update your account, so you can simply choose the bigger plan and save some money with no extra hassle (technically there is no difference between signing up for the same or bigger plan on the selection screen). This will also allow us to provide you with more features faster, so it seems beneficial for everybody.
Summary
In the coming days, we could see additional insignificant weakness in the USD Index which would likely be followed by yet another rally. This rally would likely ignite a correction in the precious metals sector.
The gold market provides us with a reflection of what we are seeing in the USD Index and a small move up to the level of the November 2011 highs is possible. Declines would likely follow such a move, and if higher prices are seen on low volume, this would be a confirmation of the correction. Opening short positions may be suggested in such a scenario even if gold prices did not decline immediately.
At this time, it seems that an adjustment to the order which we suggested for traders earlier this week is appropriate – we suggest moving the price at which to enter a short position to $1,760 in spot gold.
Please keep in mind that according to ourportfolio structuringapproach, the above relates only to a half of the speculative capital. The other is dedicated to the SP Indicators. Since we have just seen a buy signal from one of our indicators (the SP Short-Term Gold Stock Bottom Indicator), we suggest opening a speculative position in mining stocks (say GDX ETF) using the other part of your speculative capital. This does not mean that you should use 50% of your trading capital for this trade, but that you should make the position size 2x smaller than it would be if you didn't divide your trading capital between two sources of signals. So if you normally decide to open a position that is 5% of your trading capital, then please open a long position with 2.5% of your capital.
We suggest putting a stop loss order for the long position in the GDX ETF at $51. The rally that our indicator is suggesting will probably be short-lived.
Summing up, we now suggest being long, then (when miners move to their 2012 high) we will probably suggest moving to the short side of the precious metals market. If the precious metals decline and gold moves to/below $1,760 and/or GDX moves below $51, we will suggest closing long positions and opening short ones anyway.
We suggest remaining in the precious metals markets with long-term investments.
Thank you for using the Premium Service. Have a profitable week and a great weekend!
This completes this week's Premium Update. Our next Premium Update is scheduled for Friday, October 12, 2012. Of course, we will continue to send out Market Alerts whenever appropriate.
Przemyslaw Radomski, CFA

