

The second week of August began with an important event for oil investors – a meeting of some oil ministers from OPEC and non-OPEC producers in Abu Dhabi. Thanks to these circumstances, the price of crude oil wavered between small gains and losses in the previous days, but finally moved a bit higher after news that Saudi oil company Aramco will cut allocations to its customers in September by at least 520,000 barrels per day. Is this event strong enough to hold the price of crude oil above $50? In our opinion, it’s not. Why? Because, we have to keep in mind that production remains high in many parts of the world. As a reminder, Libya's largest oil field Sharara increased country’s oil production to more than 1 million bpd in late June. Additionally, last week’s report showed that U.S. oil production hit 9.43 million barrels per day, which was the highest level since August 2015. On top of that, OPEC’s crude oil exports increased to a record high in the previous month.
In our opinion, all the above-mentioned fundamental factors do not bode well for oil bulls and higher prices of the black gold. Nevertheless, to have a more complete picture of the oil market let’s jump right into the charts (charts courtesy of http://stockcharts.com) and try to find out where will the commodity head in August.
Crude Oil
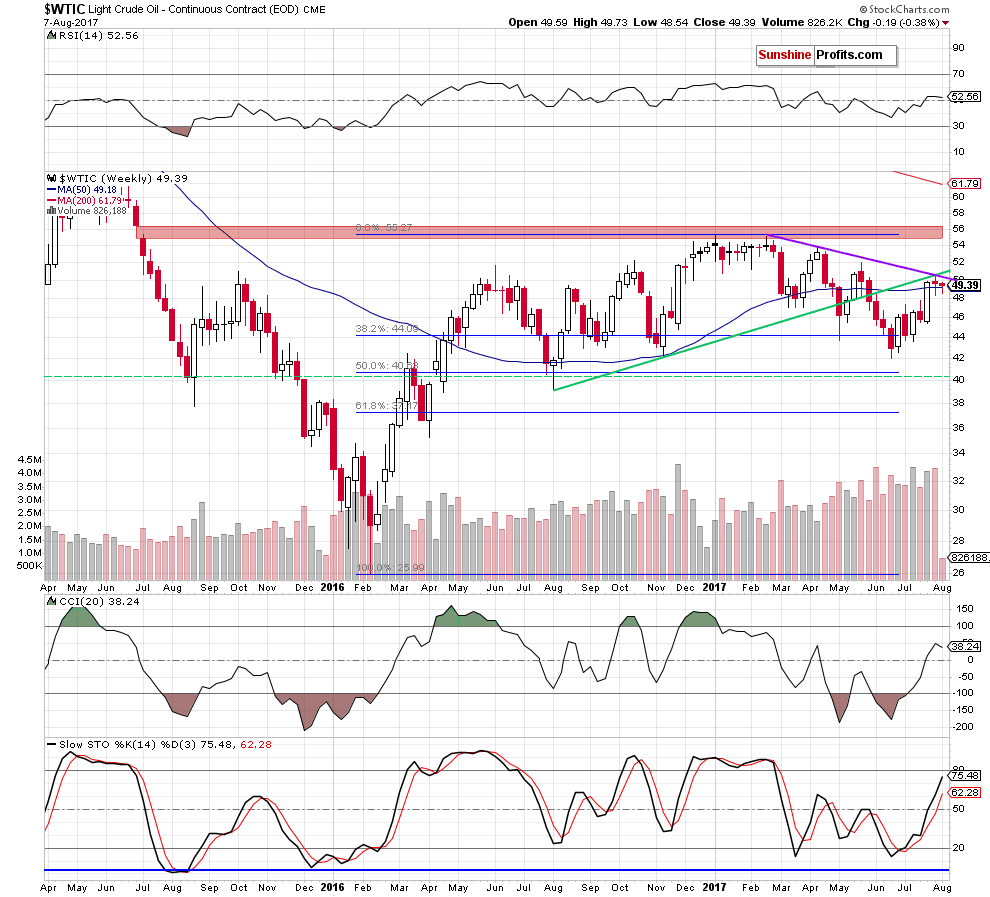
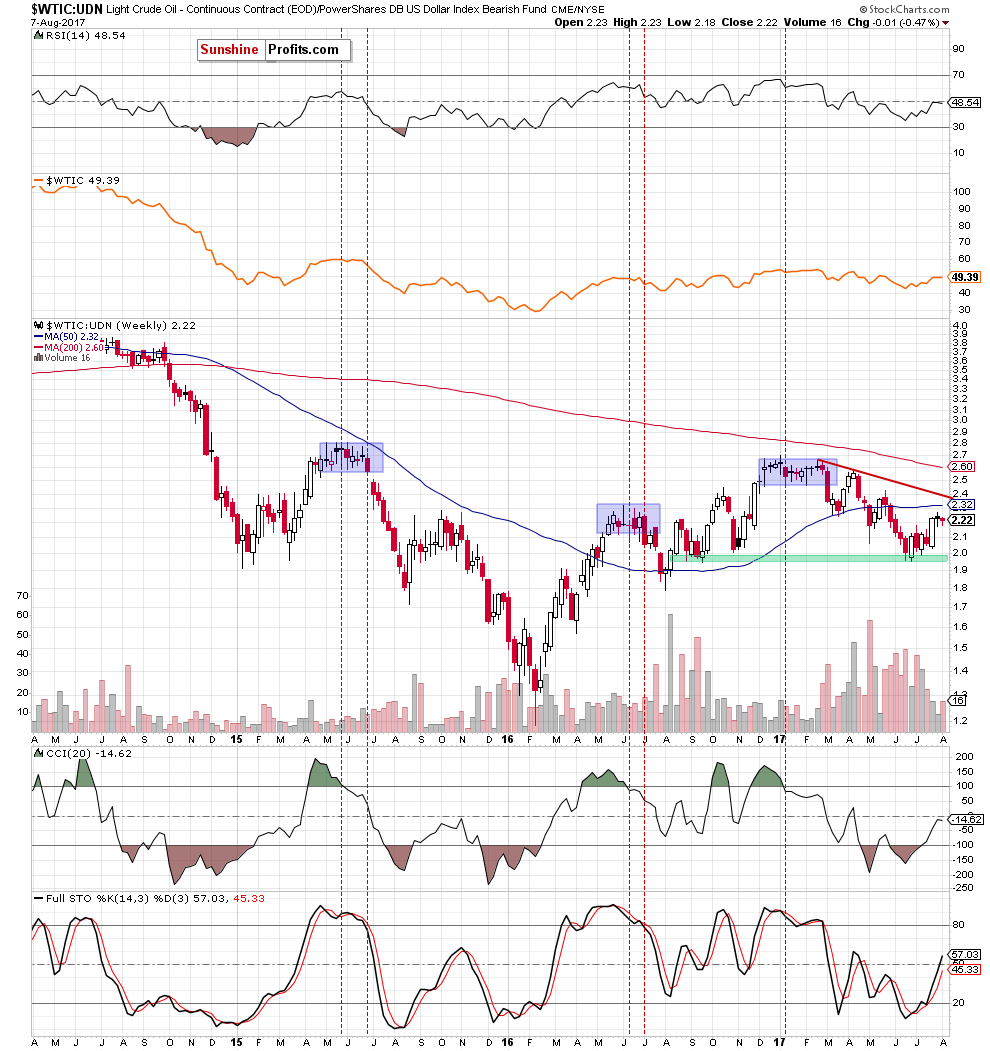
Looking at the weekly chart, we see that crude oil broke above the 50-week moving average and closed the previous week above it. Despite that bullish development, the purple resistance line based on the previous highs together with the previously-broken long-term green line based on the August and November lows stopped oil bulls at the beginning of the month.
How did this price action affect the very short-term picture of the commodity?
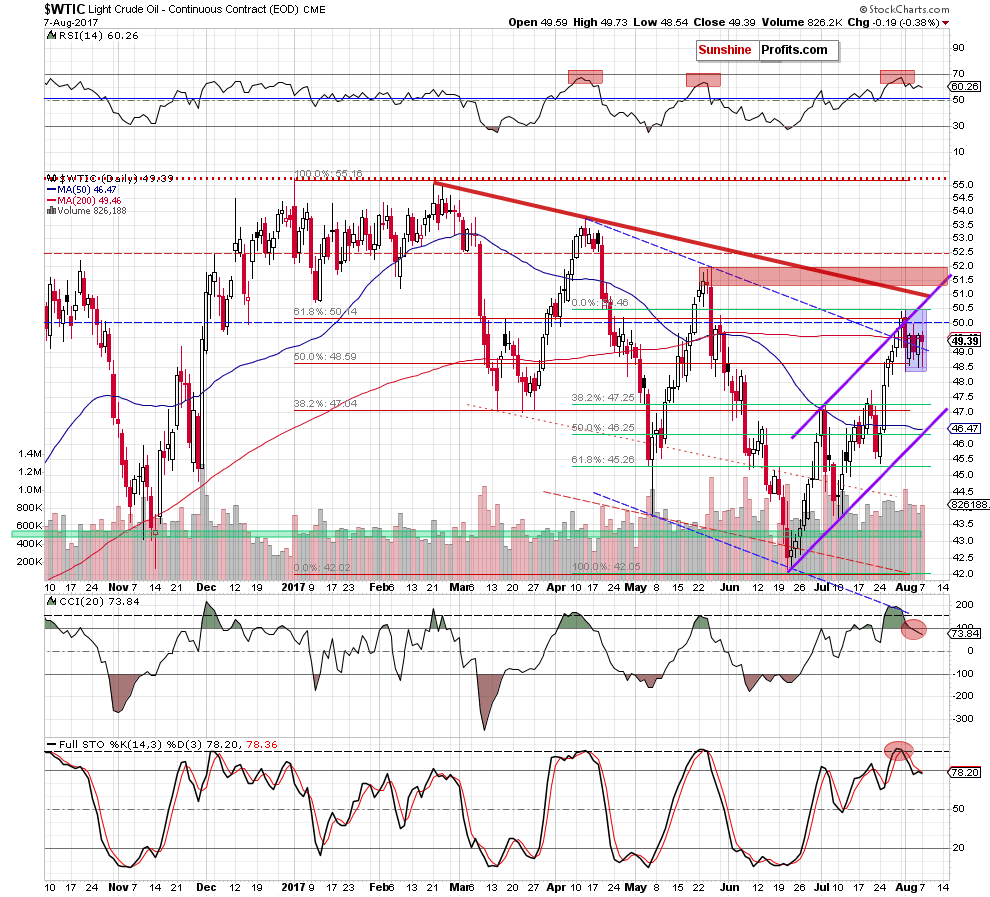
Looking at the daily chart, we see that although crude oil moved lower after Friday’s market’s open, oil bulls managed to stop declines and pushed the black gold higher. As a result, light crude came back above the previously-broken 200-day moving average, but this increase didn’t change anything in the overall picture of the commodity.
Why? Because despite this improvement, crude oil remains in the blue consolidation under the resistance area created by the 61.8% Fibonacci retracement (based on the entire 2017 downward move), the barrier of $50 and the upper border of the purple rising trend channel.
What does it mean for black gold? Taking into account an invalidation of the breakout above these resistance levels and its potential negative impact on the price, the sell signals generated by the daily indicators and the size of volume, which accompanied Friday’s increase (it was smaller compared to what we saw during previous downswings) we believe that oil bears have many important reasons to act, which should result in further deterioration in the coming days – especially when we factor in the medium-term picture (the commodity closed the week under the previously-broken long-term green line based on the August and November lows and the medium-term purple line based on the February and April highs).
How low could the commodity go? If light crude moves lower from current levels, the first downside target will be the last week low, which creates the lower border of the blue consolidation (at $48.37). If it is broken, the next downside target for bears will be around $47.25, where the 38.2% Fibonacci retracement based on the entire recent upward move is. However, taking into account all negative above-mentioned factors, we think that light crude will move even lower and test the lower border of the purple rising trend channel in the coming days (currently around $46.30). Please note that this area is also reinforced by the 50% Fibonacci retracement, which could pause for a bit further declines.
Having said the above, let’s examine the oil-precious metals link. Let’s start with the oil-to-gold ratio.
Ratio Analysis
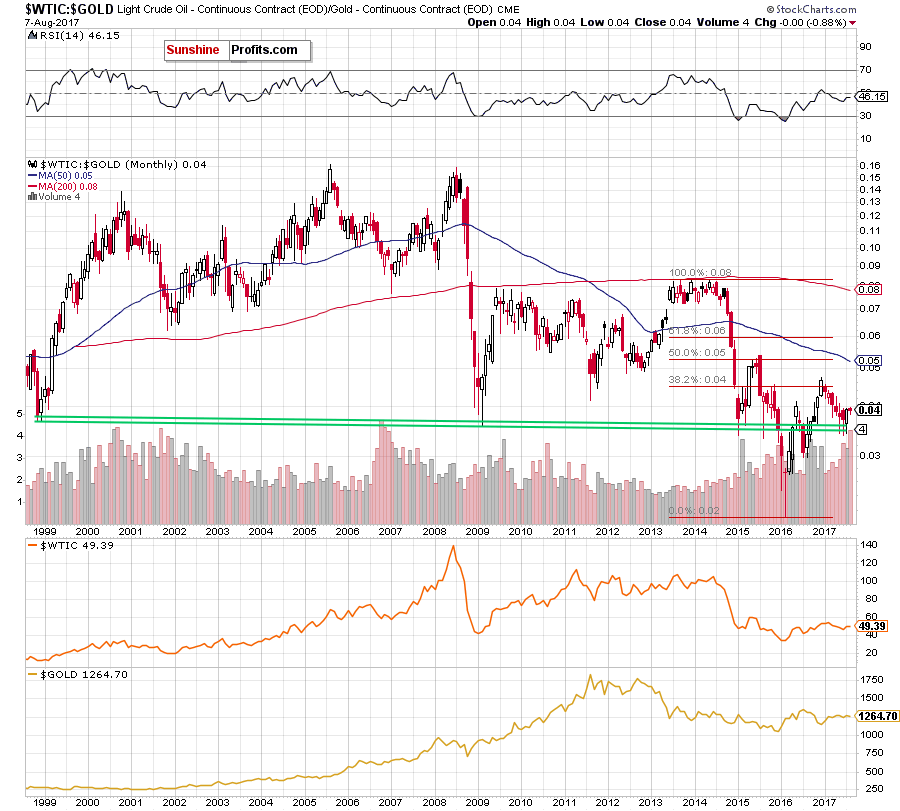
Looking at the chart from the long-term perspective, we see that the overall situation hasn’t changed much as the ratio is trading in a narrow range between the May high and low, slightly above the long-term green support lines, which stopped the bears three times in the previous months. Such situation suggests that as long as there is no breakdown and a monthly closure below this support zone another sizable move to the downside is not likely to be seen.
But will we see a test of the recent lows in the coming weeks? Let’s take a closer look at the weekly chart and try to find the answer.

In our crude oil essay posted on July 31, 2017, we wrote the following:
(…) From the weekly perspective, we see that even if the ratio moves higher one again, very close to the current levels we can notice the upper border of the blue declining trend channel, the 50-week moving average and the July peak, which together could stop bulls and trigger a reversal and declines in the coming week.
From today’s point of view, we see that the situation developed in line with the above scenario and the above-mentioned resistance area paused oil bulls in the previous week. As a result, the ratio closed the whole week under the upper border of the blue declining trend channel and the 50-week moving average, invalidating the earlier tiny breakout.
Such price action is a negative development, which suggests that further deterioration may be just around the corner. How such price action could affect the price of crude oil? We believe that the best answer to this question will be the quote from our oil essay posted on July 31:
(…) Taking into account the fact that positive correlation between the ratio and the commodity is still in cards, we believe that declines in the ratio will likely translate into lower prices of crude oil in the coming week(s).
This pro bearish scenario is also reinforced by the current situation in the oil-to-silver ratio.
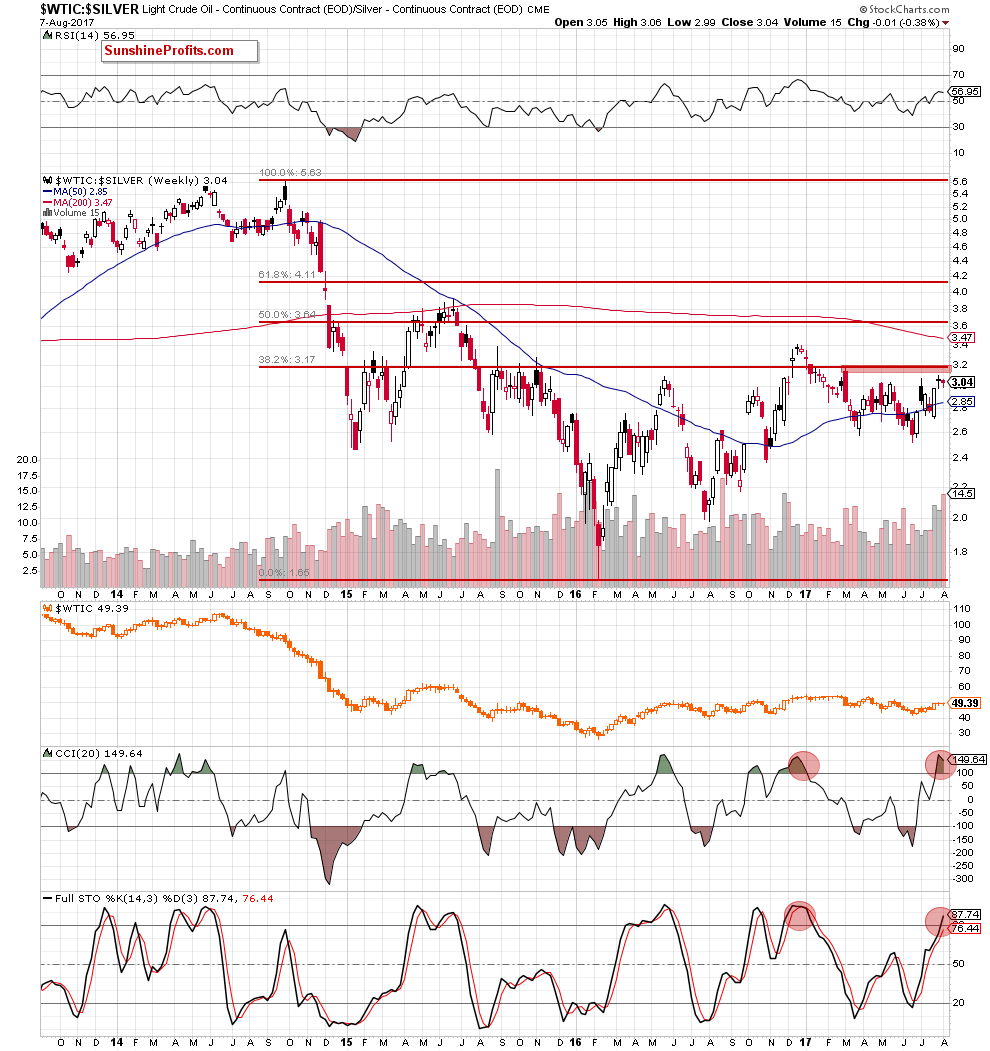
As you see on the medium-term chart, the recent rebound took the ratio to slightly below the red resistance zone created by the March peak and the 38.2% Fibonacci retracement based on the entire September 2014-February 2016 downward move, which could stop the bulls and further improvement in the ratio (and also crude oil) in the coming week(s).
Finishing this section let’s focus on the non-USD (WTIC:UDN ratio) chart of crude oil. As a reminder, UDN is the symbol for the PowerShares DB US Dollar Index Bearish Fund, which moves in the exact opposite direction to the USD Index. Since the USD Index is a weighted average of the dollar's exchange rates with world's most important currencies, the WTIC:UDN ratio displays the value of crude oil priced in "other currencies".
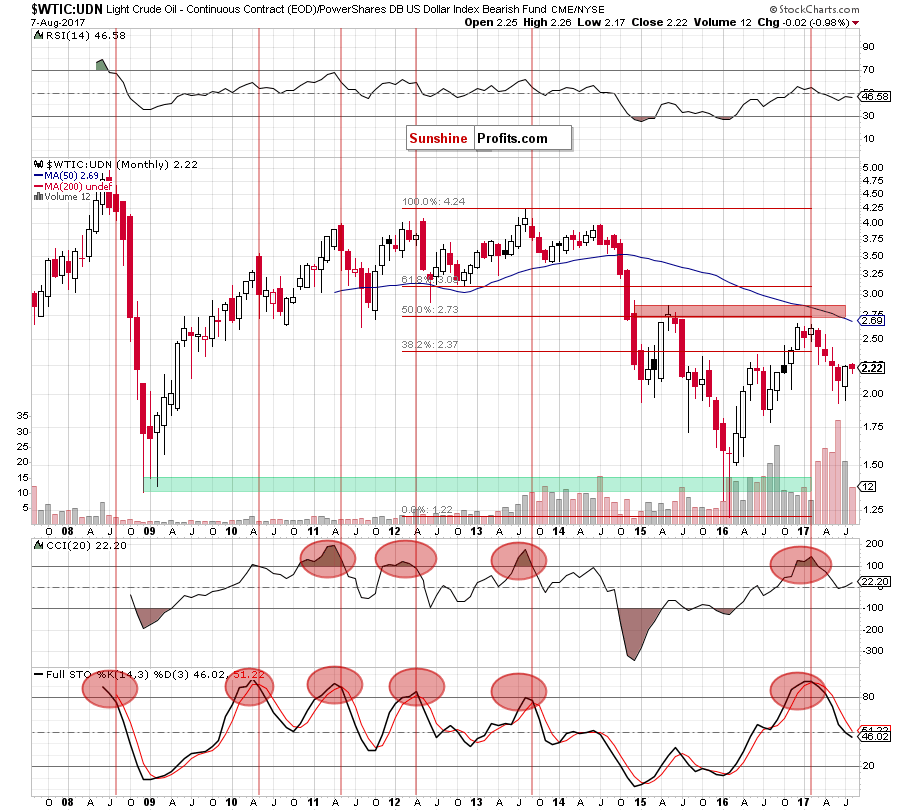
Looking at the long-term chart, we see that although the ratio moved higher in the previous month, the size of volume was visibly smaller compared to what we saw during declines. Such situation doesn’t confirm oil bulls’ strength, suggesting that another reversal may be just around the corner – especially when we factor in the sell signals generated by the monthly indicators and declines in volume during increases (seen more clearly on the medium-term chart below).
On top of that, when we take a closer look on the daily chart below, we’ll see additional negative factors.
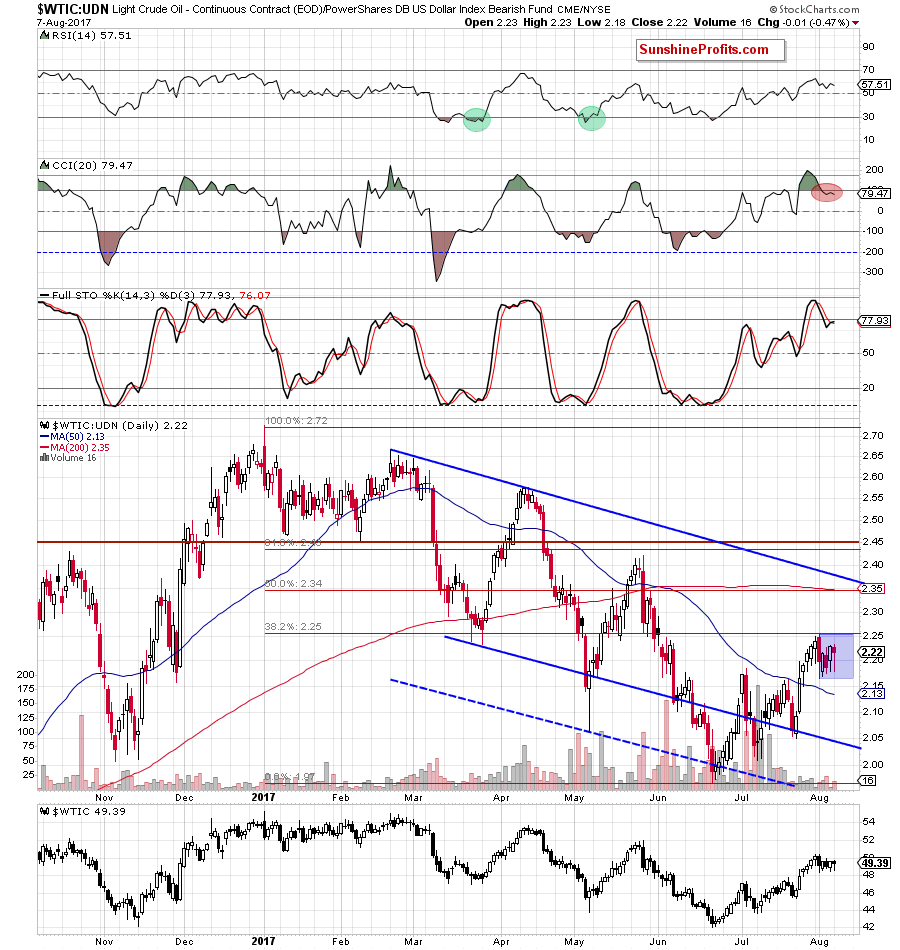
As you see on the above chart, the ratio is consolidating under the 38.2% Fibonacci retracement based on the February-Jun downward move, which suggests that the nearest resistance is quite strong for oil bulls. Additionally, the CCI generated the sell signal - similarly to what we saw before bigger declines in February, April and May, which increases the probability of further declines in the coming days.
Finishing this month’s Oil Investment Update let’s examine the NYSE Arca Oil Index (XOI) to find out what the current outlook for oil stocks is.
Oil Stocks
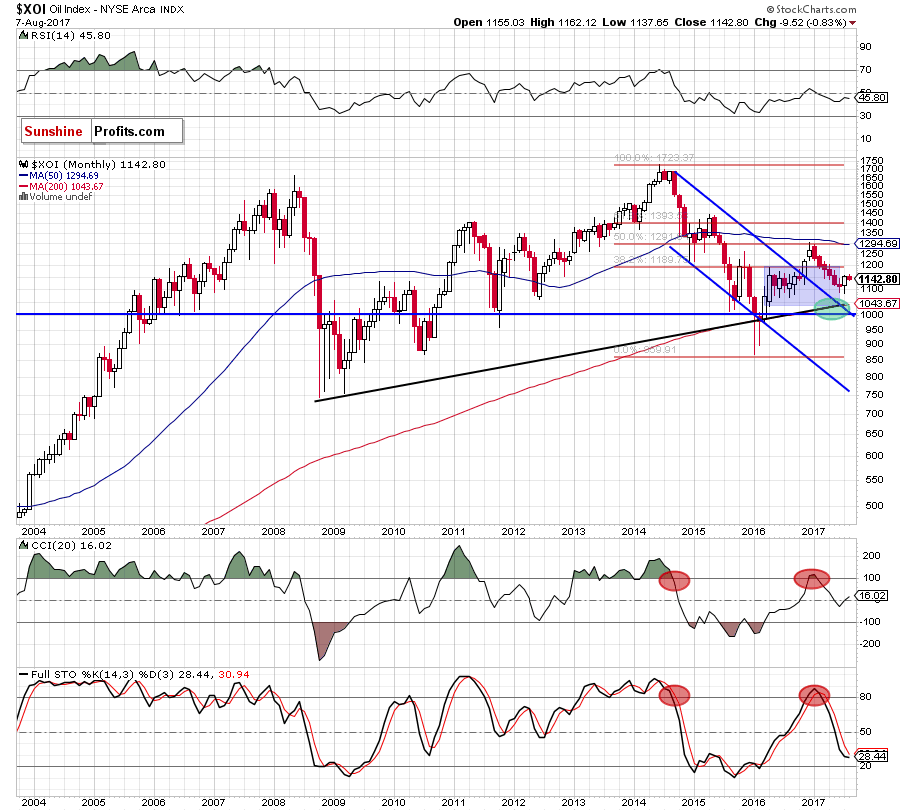
Looking at the long-term chart, we see that although oil stocks moved higher in the previous month, the XOI is still trading in the blue consolidation. Additionally, the sell signals generated by the CCI and the Stochastic Oscillator remain in place, suggesting another attempt to move lower and a test of our downside target marked with the green ellipse in the coming month.
But will we see such price action in the coming weeks? Let’s examine the medium-term chart and find out.
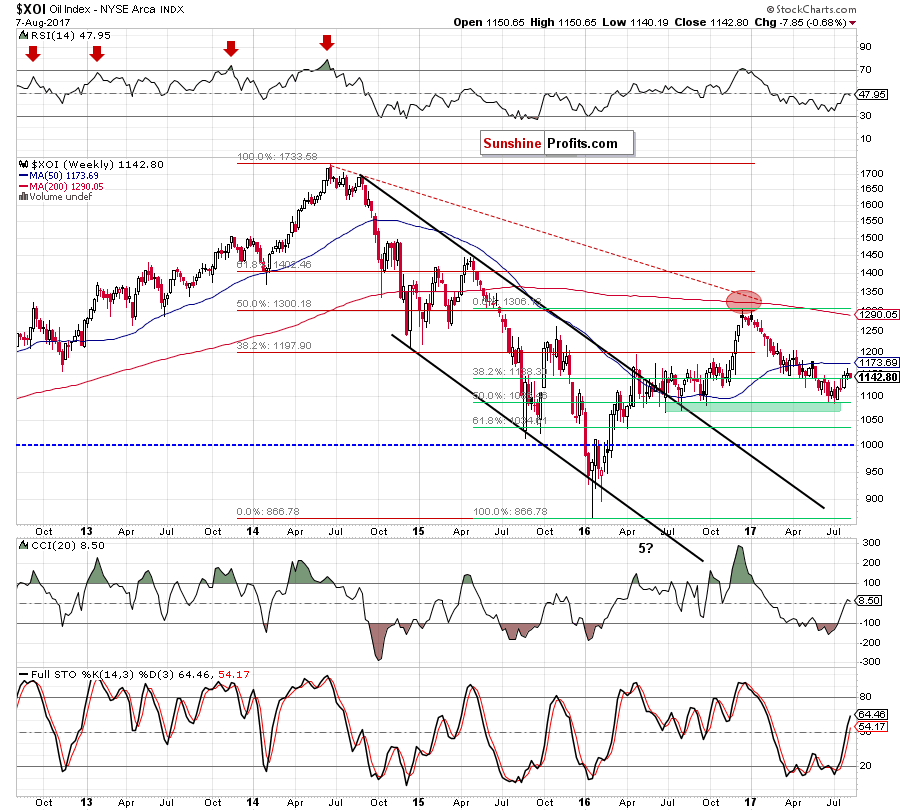
From this perspective, we see that the XOI bounced off the green support zone and the 50% Fibonacci retracement in the previous weeks, which approached oil stocks to the 50-week moving average. Despite this improvement, the index reversed and declined earlier this week, which resulted in a comeback below the 38.2% Fibonacci retracement. Such price action doesn’t bode well for bulls and suggests further deterioration in the coming weeks.
Will the short-term chart confirm this scenario? Let’s check.
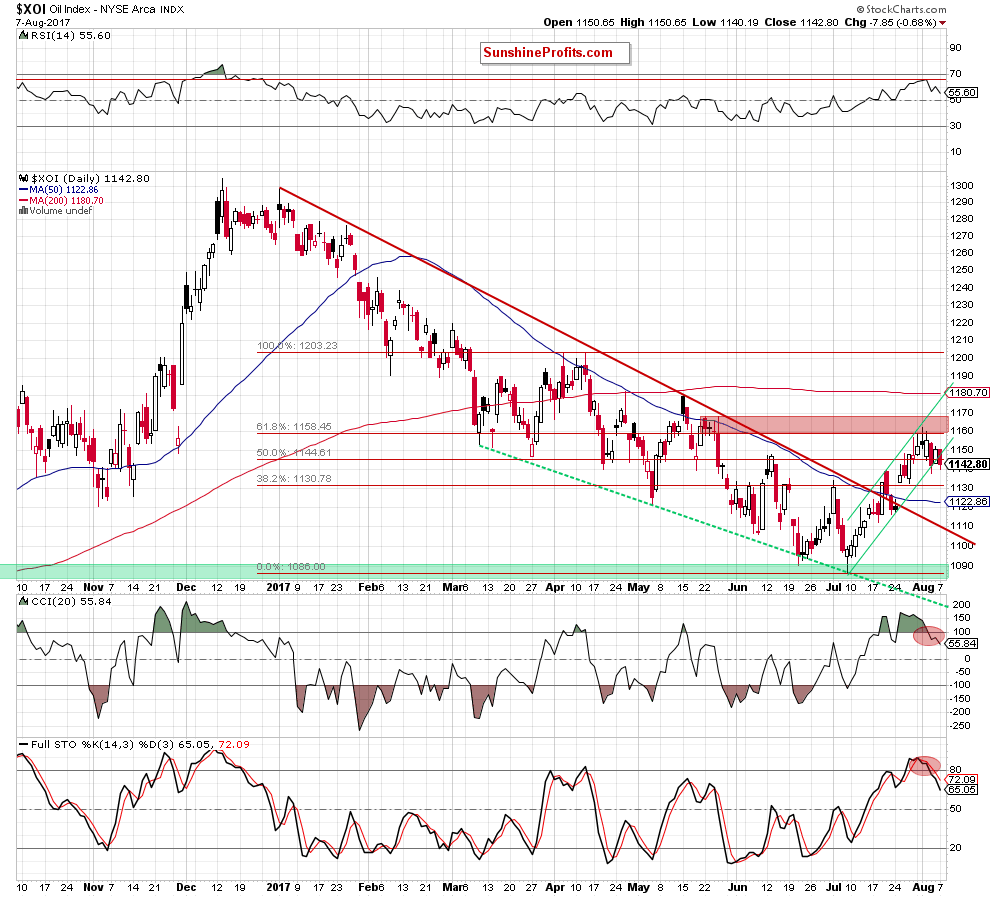
From today’s point of view, we see that oil stocks increased to the 61.8% Fibonacci retracement inside the green rising trend channel in the previous week. As you see, the red resistance area created by the above-mentioned retracement and May highs stopped further improvement, triggering a pullback. As a result, the XOI not only invalidated the earlier tiny breakout above the 61.8% Fibonacci retracement, but also dropped under the lower border of the green trend channel, which is a bearish development. On top of that, the CCI and the Stochastic Oscillator generated the sell signals, increasing the probability of declines in the coming days.
How low could oil stocks go? In our opinion, if the XOI extends losses from here, the initial downside target will be around 1,132, where the July 27 low is. If this support is broken, oil bears will likely try to close the gap between the July 24 peak of 1,124 and the July 25 low of 1,132. If they succeed, we’ll likely see a test of the previously-broken upper border of the red declining trend channel in the following days.
Scenarios
Just like a month ago, today’s Oil Investment Update includes scenarios of what could happen in the coming weeks. Naturally, we will continue to monitor the market in the coming days and if anything invalidates our long-term outlook we will send you an additional message.
- Bullish scenario
Even if crude oil extends gains and climbs above the August peak, the upper border of the purple rising trend channel and the upper border of the red declining trend channel, oil bulls will have to push the black gold above the red resistance zone marked on the daily chart (created by the May peaks and the 76.4% and 78.6% Fibonacci retracements based on the entire 2017 downward move) to open the way to higher levels. If they succeed, we’ll see a test of the January and February highs. - Bearish scenario
If the commodity drops under the lower border of the blue consolidation the next downside target for bears will be around $47.25, where the 38.2% Fibonacci retracement based on the entire recent upward move is. If this support is broken, we’ll likely see a test of the lower border of the purple rising trend channel and the 50% Fibonacci retracement (around $46.30) or even a drop to the 61.8% retracement and the July 24 low of $45.40. If this support area doesn’t stop oil bears the next target will be the green support zone seen n the daily chart and the 2017 lows.
Summary
Looking at the short-term picture of crude oil (an invalidation of the breakouts above the 61.8% Fibonacci retracement based on the entire 2017 downward move, the barrier of $50, the previously-broken upper border of the purple rising trend channel and the 200-day moving average) and the current situation in the above-mentioned ratios, it seems to us that crude oil will extend losses in the coming weeks. This scenario is also reinforced by the sell signals generated by the daily indicators and declining size of volume, which has accompanied recent increases (in the case of crude oil and our ratios). Therefore, we think that if the black gold slips below the lower border of the blue consolidation, we’ll see a complete or at least partial realization of our bearish scenario in the coming weeks.
Very short-term outlook: mixed with bearish bias
Short-term outlook: mixed with bearish bias
MT outlook: mixed
LT outlook: mixed
This completes this month’s Oil Investment Update. Our next Oil Investment Update is scheduled for Wednesday, September 6, 2017. Oil Trading Alerts subscribers will additionally receive similar but shorter alerts on a daily basis (or more than once a day when the situation requires it). You – Oil Investment Updates subscribers – will receive short Investment Alert messages should the outlook for the medium or long term change before the next Update is posted.
Thank you.
Nadia Simmons
Forex & Oil Trading Strategist
Oil Investment Updates
Oil Trading Alerts

