

On Friday, crude oil moved higher and hit a July peak supported by a weakening U.S. dollar and bullish Wednesday’s EIA weekly report. As a result, the black gold climbed above the 200-day moving average, but is it enough to trigger a rally above $50?
Crude Oil’s Technical Picture
Let’s take a closer look at the charts and find out (charts courtesy of http://stockcharts.com).
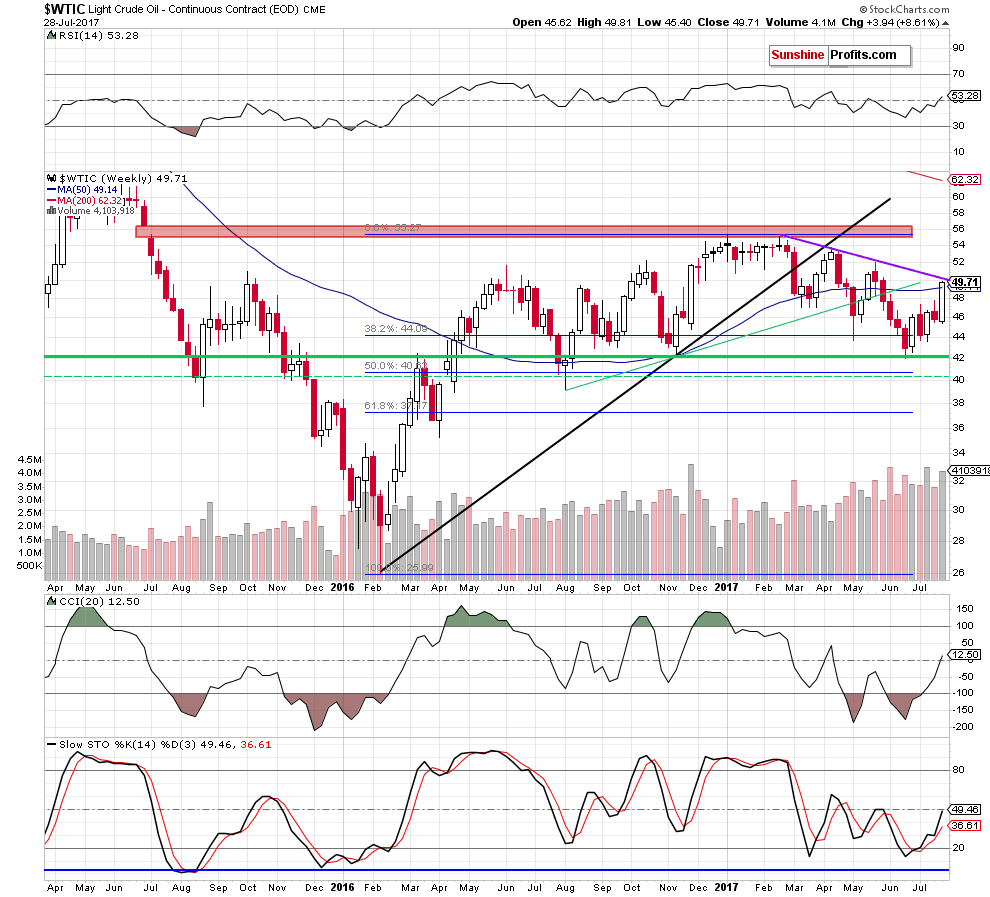
Looking at the weekly chart, we see that crude oil broke above the 50-week moving average and closed the week above it. Although this is a bullish development, we should keep in mind that thanks to the last week’s increase the commodity also approached the purple resistance line based on the previous highs, which could pause or even stop further improvement.
Will this resistance manage to push the black gold lower in the coming week? Let’s examine the daily chart and find out what can we infer from it about future moves.
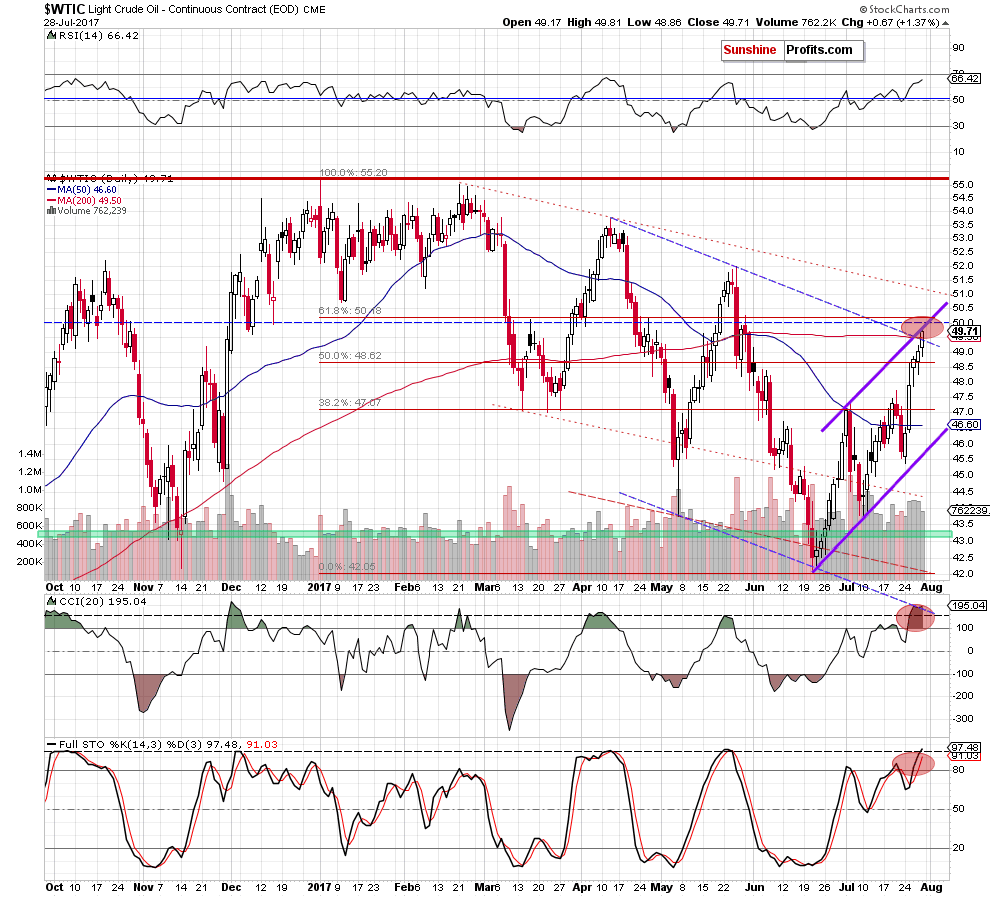
On the above chart, we see that crude oil extended gains and broke above the 200-day moving average and the upper border of the blue declining trend channel (marked with dashed line), which encouraged oil bulls to act and resulted in a move to the upper line of the purple rising trend channel.
Will we see further improvement in the coming days? As you see on the above chart, not far from current levels we can notice the barrier of $50 and the 61.8% Fibonacci retracement based on the entire 2017 downward move. This suggests that the space for gains may be limited – especially when we factor in the medium-term picture and the current position of the daily indicators. Looking at them, we see that the CCI increased to the highest level in 2017, while the Stochastic Oscillator reached levels, which triggered reversals in April and later in May.
Additionally, Friday’s upswing materialized on smaller volume than earlier increases, which may be the first sign of oil bulls’ weakness. On top of that, when we take a closer look at the oil-to-gold ratio we can notice more bearish factors on the horizon.
Crude Oil – Gold Link
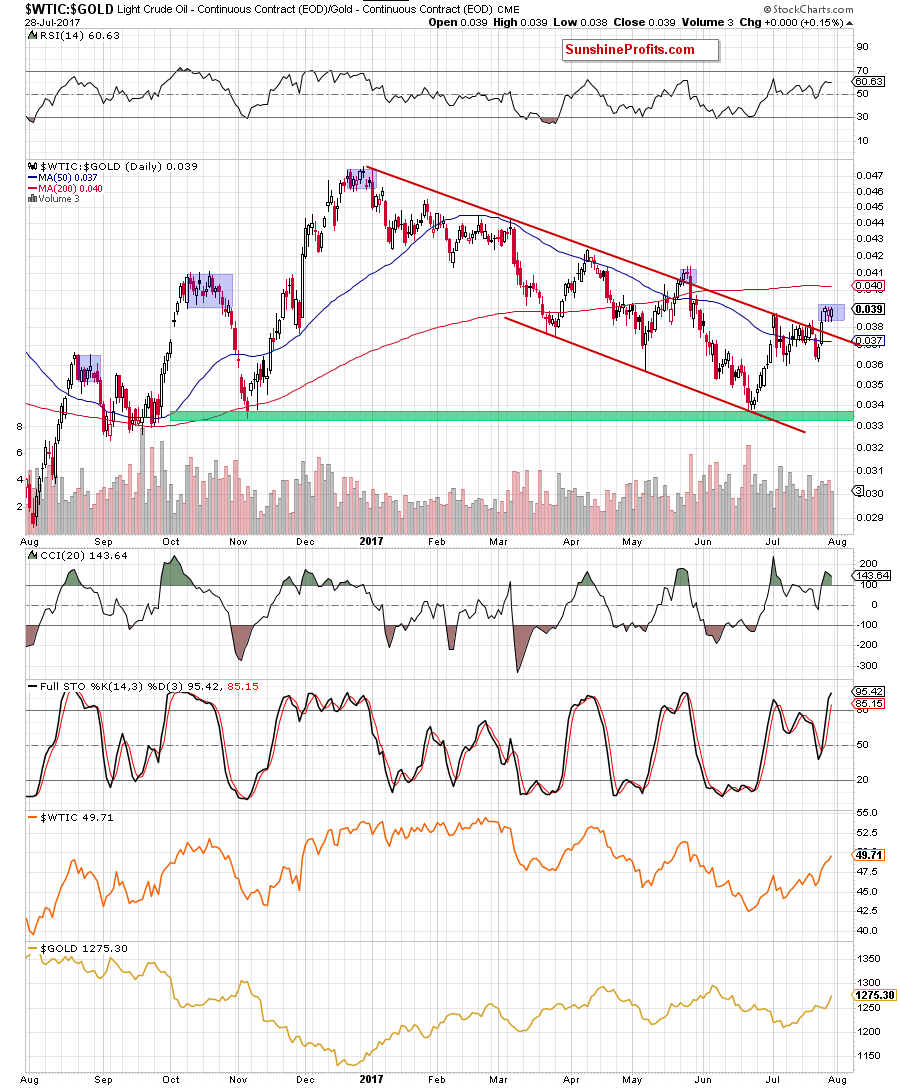
Looking at the daily chart, we see that although oil-to-gold ratio broke above the upper border of the red declining trend channel, we didn’t see a sharp move to the upside. Instead, the ratio started to consolidate, which increases the probability of reversal in the coming week.
Why? When we take a closer look at the above chart, we see that there was a similar price action in May. Back then, after the breakout above the upper line of the trend channel, the ratio started consolidation, which resulted in a reversal and declines in the following week. Additionally, looking at the daily chart, we see that there were also similar cases in 2016 and they all preceded smaller or bigger declines.
Nevertheless, taking into account the fact that there are no sell signals at the moment of writing these words, one more short-lived upswing can’t be ruled out (similarly to what we saw in the past).
How high could the ratio go? Let’s zoom out our picture and focus on the medium-term chart.
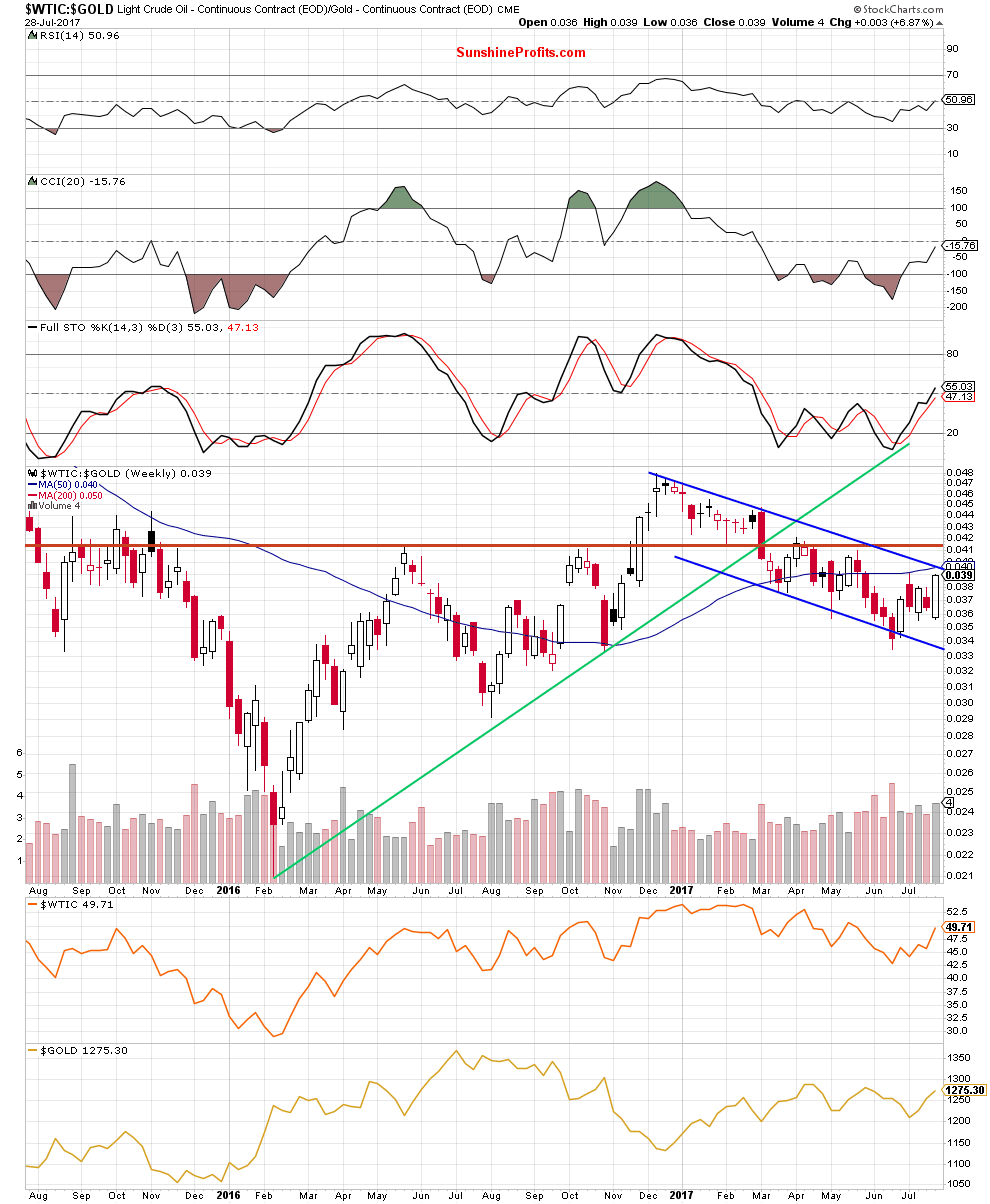
From the weekly perspective, we see that even if the ratio moves higher one again, very close to the current levels we can notice the upper border of the blue declining trend channel, the 50-week moving average and the July peak, which together could stop bulls and trigger a reversal and declines in the coming week.
How such price action could affect the price of crude oil? Taking into account the fact that positive correlation between the ratio and the commodity is still in cards, we believe that declines in the ratio will likely translate into lower prices of crude oil in the coming week(s).
Summing up, crude oil extended gains and climbed to the upper border of the purple rising trend channel, which suggests that even if light crude moves higher from here the space for gains is limited as the 61.8% Fibonacci retracement and the medium-term declining resistance line based on the previous high (marked on the weekly chart) are quite close to current levels. The pro bearish scenario is also reinforced by the current situation in the oil-to-gold ratio, which started consolidation under the upper border of the medium-term declining trend channel. Naturally, the above could change in the coming days and we’ll keep our subscribers informed, but that’s what appears likely based on the data that we have right now. If you enjoyed reading our analysis, we encourage you to subscribe to our daily Oil Trading Alerts.
Thank you.
Nadia Simmons
Forex & Oil Trading Strategist
Przemyslaw Radomski, CFA
Founder, Editor-in-chief, Gold & Silver Fund Manager
Gold & Silver Trading Alerts
Forex Trading Alerts
Oil Investment Updates
Oil Trading Alerts
