

Briefly: in our opinion, full (300% of the regular position size) speculative short positions in junior mining stocks are justified from the risk/reward point of view at the moment of publishing this Alert.
The technical part of today’s analysis is going to be brief, as practically nothing happened in yesterday’s trading.
The only really meaningful fact about yesterday’s session is that gold moved a bit ($4.40) higher, and the mining stocks declined despite that.
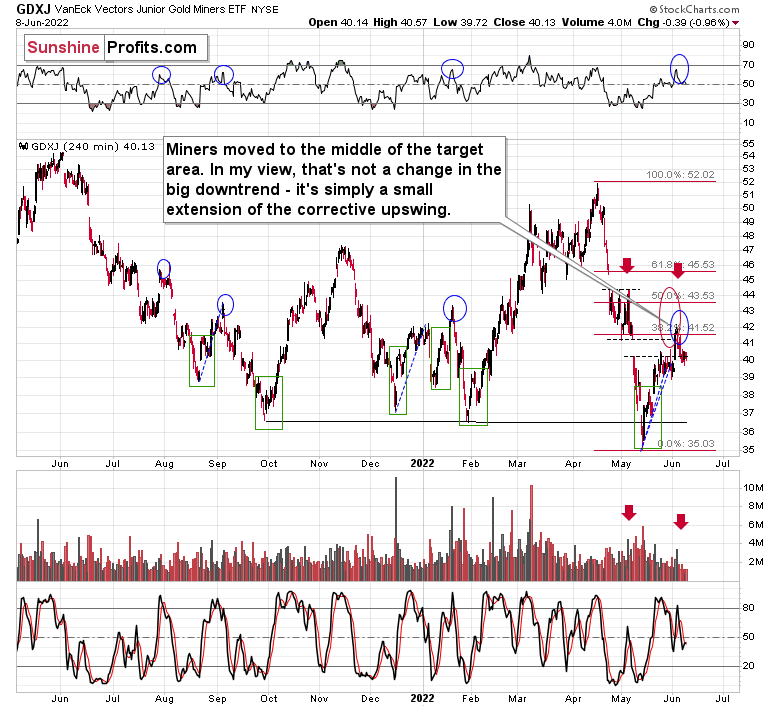
Junior miners were down by almost 1%, which is not a lot on its own, but it’s a lot given that gold moved higher on the same day. This means that miners underperformed gold, which is another indication that the short-term top is behind us and that the precious metals sector is about to decline once again.
In other words, what I wrote in yesterday’s analysis, remains up-to-date.
Having said that, let’s take a look at the markets from a more fundamental angle.
Throwing Good Money at Bad Investments
With the S&P 500 and the GDXJ ETF declining on Jun. 8, the daily shift from optimism to pessimism highlights the fundamental frailty of the financial markets. Moreover, while some investors assume that overly-bearish positing can elicit more than just short-covering rallies, the reality is that the S&P 500 and the GDXJ ETF are likely nowhere near medium-term bottoms.
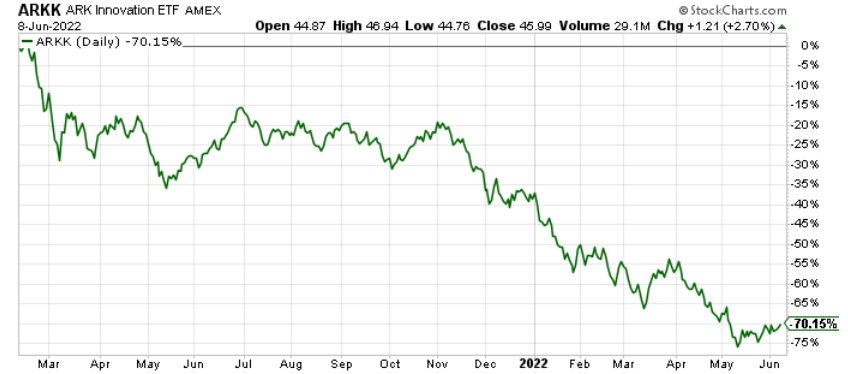
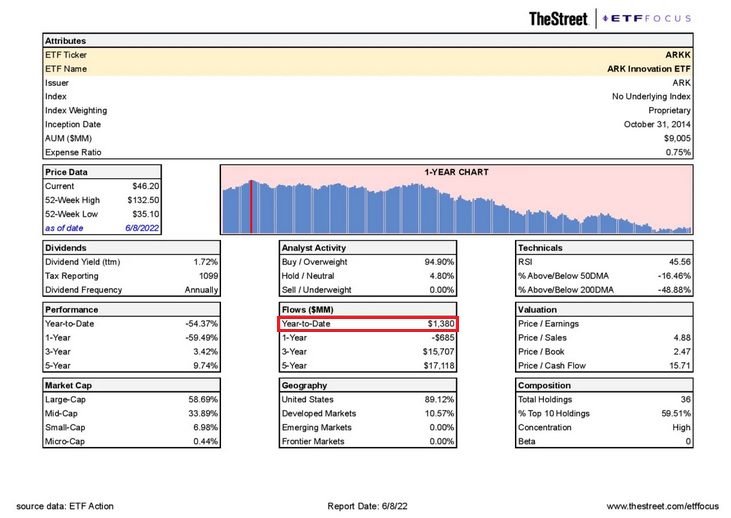
To explain, Cathie Wood – who runs ARK Invest – may go down as the poster child of this bubble. With the oracle confusing speculative growth stocks for generational innovation, the ghosts of QE have some assuming that 2020/2021 was the norm and not an aberration. However, with ARK Innovation’s flagship fund down by more than 70% from its highs, you would think her mystic would have fallen along with it.
Please see below:
Yet, with the ARK Innovation ETF recording $1.38 billion in net inflows in 2022, retail investors continue to pour money into the embattled fund.
Please see below:
As a result, there is no fear in the financial markets. With the consensus assuming the Fed will turn dovish and solve all of the U.S.’s economic problems, investors have lined up to throw good money at bad investments. To that point, I noted on May 25 that the psychological effect of the Fed’s continuously pacifying the markets has clouded the judgment of a generation of investors. I wrote:
We’ve officially entered the monetary version of The Boy Who Cried Wolf. With Fed officials running to the rescue each time the financial markets show signs of stress, investors are programmed to ignore their hawkish threats. However, while these post-GFC pivots occurred with inflation perched near 2%, investors are so steadfast in their belief that they ignore the climactic consequences of unanchored inflation.
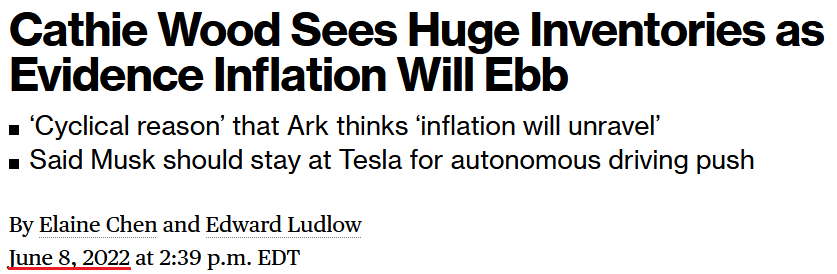
Therefore, while investors either don’t know or don’t care about history, they have complete faith in a shepherd that has already led them to slaughter. For example, Wood told Bloomberg on Jun. 8:
“I’ve never seen [retail] inventory surges like this in my career and I’ve been around for a long time. This inventory issue highlights the cyclical reason we’ve been saying we think inflation will unravel.”
Please see below:
 Source: Bloomberg
However, notice what Wood wrote on Twitter on May 15, 2021?
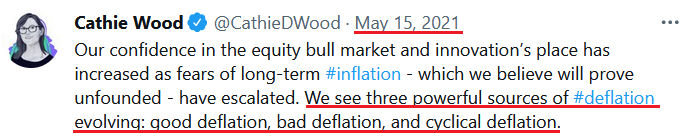
Thus, it’s been more than 12 months since her “powerful sources of deflation” haven’t materialized. Yet, despite the ~70% drawdown, investors continue to believe that her losing streak will be reversed. As such, is this the kind of unwavering faith you see at market bottoms? In reality, these managers often suffer the brunt of the criticism when bull markets unravel.
Furthermore, it’s not only the speculative corners of the stock market that have seen inflows. On aggregate, money is still fowling into mutual funds and ETFs as retail investors “buy the dip.”
Please see below:
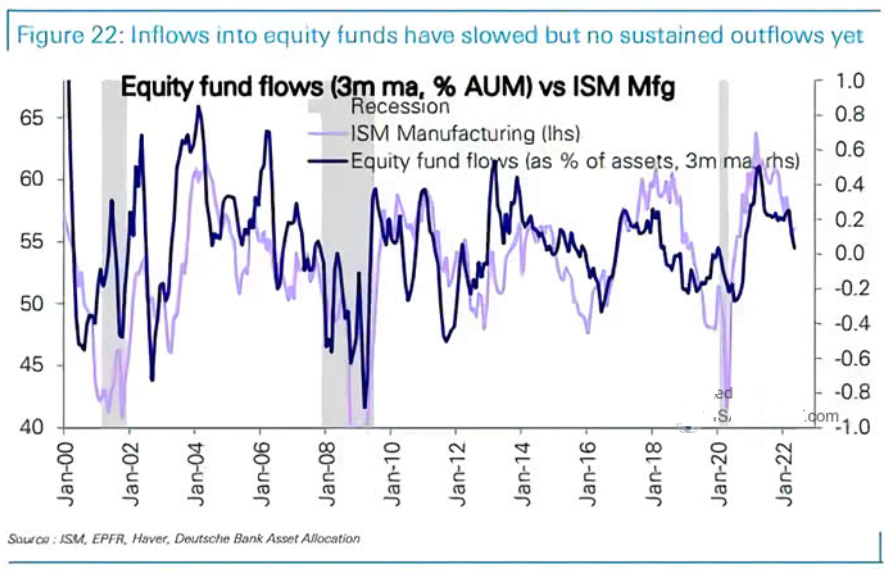
To explain, the purple line above tracks the ISM’s manufacturing PMI, while the blue line above tracks the three-month percentage change in equity fund flows as a percentage of assets under management. If you analyze the right side of the chart, you can see that flows have decelerated but remain positive.
On top of that, Bank of America’s Global Wealth and Investment Management (GWIM) clients – who are generally high net-worth individuals – equity allocations remain well above their historical average of ~56%.
Please see below:
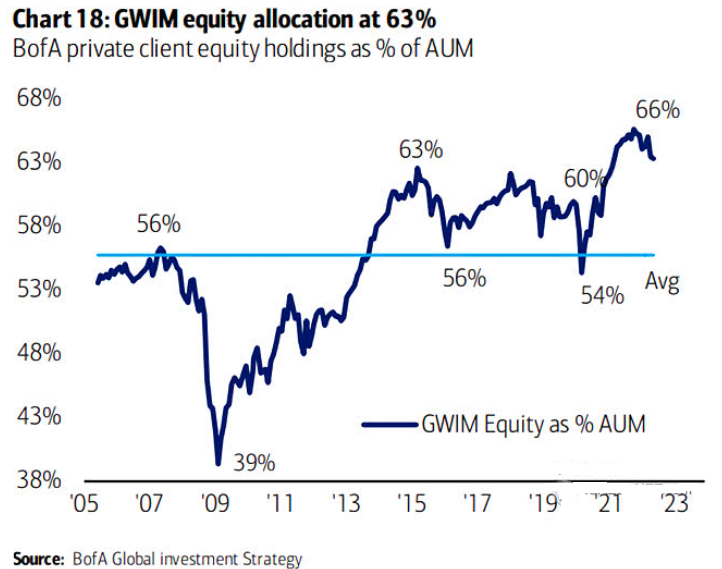
To explain, the blue line above tracks GWIM client holdings as a percentage of assets under management. If you analyze the right side of the chart, you can see that the S&P 500’s struggles have only resulted in an immaterial drop in equity allocation.
Moreover, when the Fed fanned the hawkish flames from 2015 to 2019, GWIM clients recorded sharp declines in equity allocations. However, with investors bracing for a dovish pivot, their Boy Who Cried Wolf belief couldn’t be more apparent.
As a result, while many sentiment measures are profoundly bearish, actions speak louder than words. Furthermore, when speculative stock buying is abundant, retail investors continue to push chips into their mutual funds, and GWIM clients won’t sell, I highlighted on May 19 that hope has overtaken objective analysis. I wrote:
While Fed officials realize that inflation will only subside if commodity and stock prices fall, a near 20% peak-to-trough decline in the S&P 500 still hasn’t spooked market participants. Moreover, while some claim that sentiment is extremely bearish on Wall Street, the reality is that no one fears the Fed.
To that point, Wood’s comment that the “inventory issue highlights the cyclical reason we’ve been saying we think inflation will unravel” lacks fundamental credibility. For example, I noted the inventory builds at Walmart and Target previously, but referenced how Ralf Lauren, Nordstrom, Home Depot, Foot Locker, Canada Goose, TJX Companies, and Macy’s painted much more different portraits.
More importantly, Wood and the consensus don’t realize that input inflation is a catch-22. To explain, if companies pass on higher input costs to consumers, it will increase the Consumer Price Index (CPI) and elicit more hawkish responses from the Fed. In contrast, if companies don’t pass on higher input costs, their profit margins erode. Moreover, why would investors pay near-record multiples for stocks if their profit margins are decelerating?
Thus, input inflation is a lose-lose situation for the S&P 500, as both sides of the equation are fundamentally bearish. In addition, input inflation remains abundant; and with S&P 500 companies confronted with the conundrum above, it will take a recession to calm economically-sensitive commodities’ fervor.
Please see below:
 Source: Investing.com
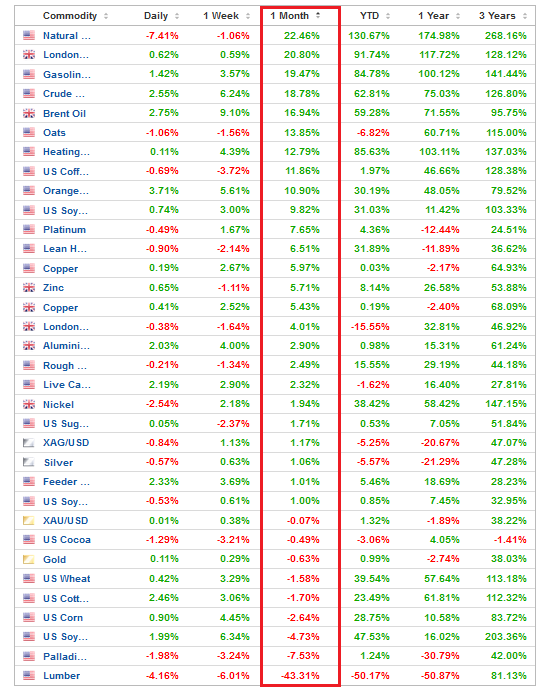
To explain, the table above highlights the performance of commodities over various timeframes. If you analyze the vertical red rectangle, you can see that most commodities have risen materially over the last month. Moreover, lumber is the only commodity that’s fallen off a cliff over the last ~30 days.
As a result, these prices will flow into S&P 500 companies’ cost structures in the months ahead and present them with the catch-22: raise prices and stoke inflation or absorb the costs and erode their profit margins. Thus, the Fed needs to reduce input inflation for the bull market to resume, and three rate hikes have done little to deter the commodity enthusiasts.
To that point, the U.S. Energy Information Administration (EIA) released its Weekly Petroleum Status Report on Jun. 8. An excerpt read:
“At 416.8 million barrels, U.S. crude oil inventories are about 15% below the five year average for this time of year. Total motor gasoline inventories decreased by 0.8 million barrels last week and are about 10% below the five year average for this time of year.”
Please see below:
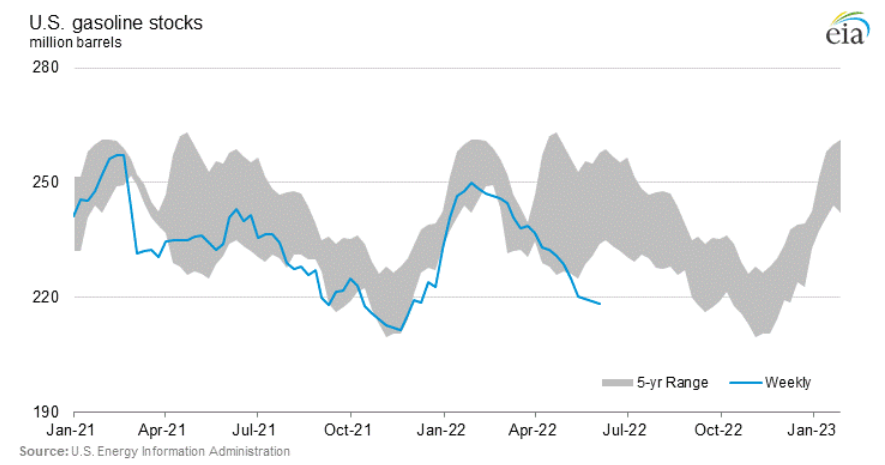
To explain, the blue line above tracks gasoline inventories, while the gray shaded area above reflects the five-year range. If you analyze the right side of the chart, you can see that gasoline stocks have fallen materially below the lower band. Therefore, who is burning all of this gasoline? Many Americans are still working from home, so they're not commuting to and from work. Thus, the sharp drop highlights inflationary demand.
In support of this argument, please have a look at refinery capacity utilization rates. With 93% of U.S. refiners online, why are inventories declining when output is increasing? For context, U.S. refiners produced more gasoline than last week and this time last year. Yet, there still isn't enough supply to meet demand.
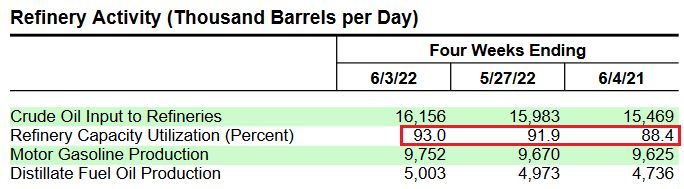 Source: EIA
Thus, it’s another week and another all-time high for retail gasoline prices.
Please see below:
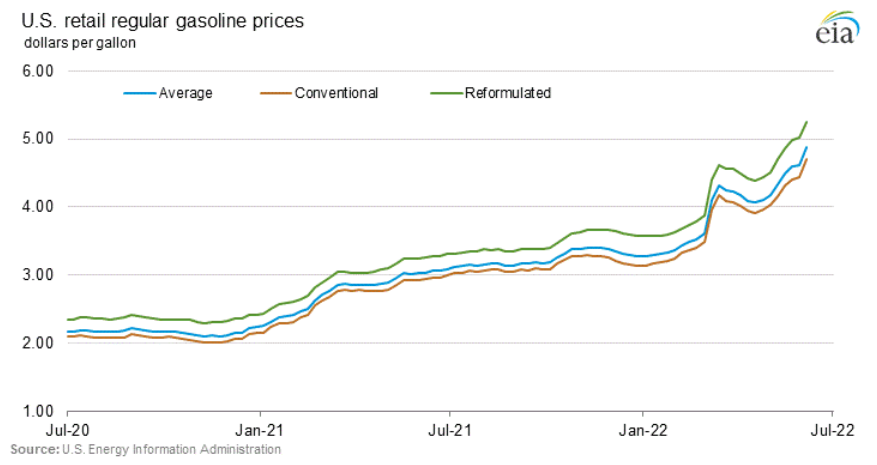
The bottom line? More than a decade of dovish pivots have programmed investors to “buy the dip” and await the Fed’s rescue. However, the consensus miscalculates the task at hand. With inflation raging, unrelenting commodity bulls will only be emboldened by a dovish 180. Moreover, if the Fed backs off, the U.S. dollar would suffer, increasing import-related inflation on an FX-adjusted basis. As a result, the bulls don’t realize that the stock market’s swan song has already begun.
In conclusion, the PMs were mixed on Jun. 8, as gold closed in the green. However, volatility has day traders chasing several rallies and dips, and the latter should rule the day over the medium term. As such, while history shows the bulls will hold on until the very end, the economic outlook continues to worsen with each passing day.
Overview of the Upcoming Part of the Decline
- It seems to me that the short-term rally in the precious metals market is either over or very close to being over. It’s so close to being over that I think it’s already a good idea to be shorting junior mining stocks.
- We’re likely to (if not immediately, then soon) see another big slide, perhaps close to the 2021 lows ($1,650 - $1,700).
- If we see a situation where miners slide in a meaningful and volatile way while silver doesn’t (it just declines moderately), I plan to – once again – switch from short positions in miners to short positions in silver. At this time, it’s too early to say at what price levels this could take place and if we get this kind of opportunity at all – perhaps with gold prices close to $1,600.
- I plan to exit all remaining short positions once gold shows substantial strength relative to the USD Index while the latter is still rallying. This may be the case with gold close to $1,400. I expect silver to fall the hardest in the final part of the move. This moment (when gold performs very strongly against the rallying USD and miners are strong relative to gold after its substantial decline) is likely to be the best entry point for long-term investments, in my view. This can also happen with gold close to $1,400, but at the moment it’s too early to say with certainty.
- The above is based on the information available today, and it might change in the following days/weeks.
You will find my general overview of the outlook for gold on the chart below:
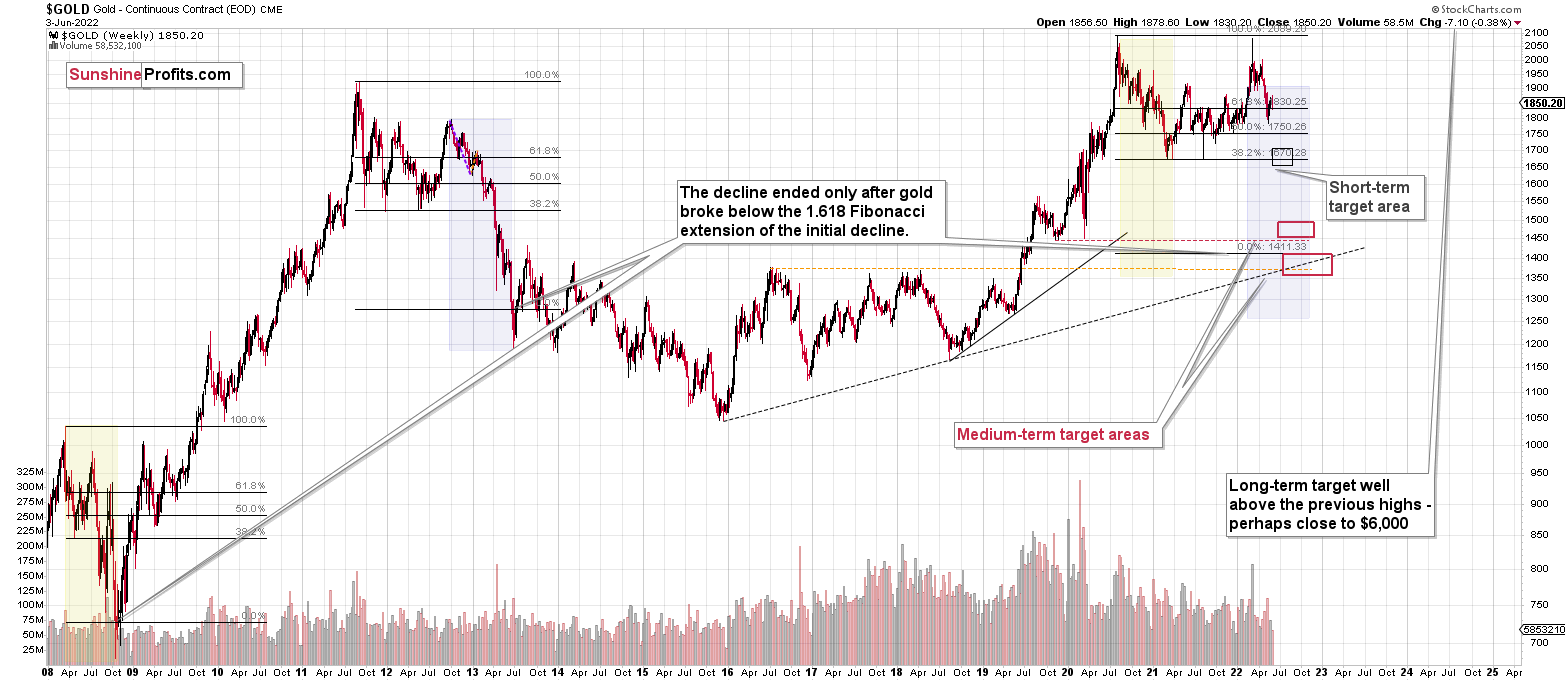
Please note that the above timing details are relatively broad and “for general overview only” – so that you know more or less what I think and how volatile I think the moves are likely to be – on an approximate basis. These time targets are not binding or clear enough for me to think that they should be used for purchasing options, warrants, or similar instruments.
Summary
Summing up, it seems to me that the short-term rally in the precious metals market is either over or close to being over. In fact, it’s so close to being over that I think it’s already a good idea to be shorting junior mining stocks.
I previously wrote that the profits from the previous long position (congratulations once again) were likely to further enhance the profits on this huge decline, and that’s exactly what happened. The profit potential with regard to the upcoming gargantuan decline remains huge.
As investors are starting to wake up to reality, the precious metals sector (particularly junior mining stocks) is declining sharply. Here are the key aspects of the reality that market participants have ignored:
- rising real interest rates,
- rising USD Index values.
Both of the aforementioned are the two most important fundamental drivers of the gold price. Since neither the USD Index nor real interest rates are likely to stop rising anytime soon (especially now that inflation has become highly political), the gold price is likely to fall sooner or later. Given the analogy to 2012 in gold, silver, and mining stocks, “sooner” is the more likely outcome.
After the final sell-off (that takes gold to about $1,350-$1,500), I expect the precious metals to rally significantly. The final part of the decline might take as little as 1-5 weeks, so it's important to stay alert to any changes.
As always, we'll keep you – our subscribers – informed.
To summarize:
Trading capital (supplementary part of the portfolio; our opinion): Full speculative short positions (300% of the full position) in junior mining stocks are justified from the risk to reward point of view with the following binding exit profit-take price levels:
Mining stocks (price levels for the GDXJ ETF): binding profit-take exit price: $27.32; stop-loss: none (the volatility is too big to justify a stop-loss order in case of this particular trade)
Alternatively, if one seeks leverage, we’re providing the binding profit-take levels for the JDST (2x leveraged). The binding profit-take level for the JDST: $19.87; stop-loss for the JDST: none (the volatility is too big to justify a SL order in case of this particular trade).
For-your-information targets (our opinion; we continue to think that mining stocks are the preferred way of taking advantage of the upcoming price move, but if for whatever reason one wants / has to use silver or gold for this trade, we are providing the details anyway.):
Silver futures downside profit-take exit price: $17.22
SLV profit-take exit price: $16.22
ZSL profit-take exit price: $41.87
Gold futures downside profit-take exit price: $1,706
HGD.TO – alternative (Canadian) 2x inverse leveraged gold stocks ETF – the upside profit-take exit price: $11.87
HZD.TO – alternative (Canadian) 2x inverse leveraged silver ETF – the upside profit-take exit price: $31.87
Long-term capital (core part of the portfolio; our opinion): No positions (in other words: cash)
Insurance capital (core part of the portfolio; our opinion): Full position
Whether you’ve already subscribed or not, we encourage you to find out how to make the most of our alerts and read our replies to the most common alert-and-gold-trading-related-questions.
Please note that we describe the situation for the day that the alert is posted in the trading section. In other words, if we are writing about a speculative position, it means that it is up-to-date on the day it was posted. We are also featuring the initial target prices to decide whether keeping a position on a given day is in tune with your approach (some moves are too small for medium-term traders, and some might appear too big for day-traders).
Additionally, you might want to read why our stop-loss orders are usually relatively far from the current price.
Please note that a full position doesn't mean using all of the capital for a given trade. You will find details on our thoughts on gold portfolio structuring in the Key Insights section on our website.
As a reminder - "initial target price" means exactly that - an "initial" one. It's not a price level at which we suggest closing positions. If this becomes the case (as it did in the previous trade), we will refer to these levels as levels of exit orders (exactly as we've done previously). Stop-loss levels, however, are naturally not "initial", but something that, in our opinion, might be entered as an order.
Since it is impossible to synchronize target prices and stop-loss levels for all the ETFs and ETNs with the main markets that we provide these levels for (gold, silver and mining stocks - the GDX ETF), the stop-loss levels and target prices for other ETNs and ETF (among other: UGL, GLL, AGQ, ZSL, NUGT, DUST, JNUG, JDST) are provided as supplementary, and not as "final". This means that if a stop-loss or a target level is reached for any of the "additional instruments" (GLL for instance), but not for the "main instrument" (gold in this case), we will view positions in both gold and GLL as still open and the stop-loss for GLL would have to be moved lower. On the other hand, if gold moves to a stop-loss level but GLL doesn't, then we will view both positions (in gold and GLL) as closed. In other words, since it's not possible to be 100% certain that each related instrument moves to a given level when the underlying instrument does, we can't provide levels that would be binding. The levels that we do provide are our best estimate of the levels that will correspond to the levels in the underlying assets, but it will be the underlying assets that one will need to focus on regarding the signs pointing to closing a given position or keeping it open. We might adjust the levels in the "additional instruments" without adjusting the levels in the "main instruments", which will simply mean that we have improved our estimation of these levels, not that we changed our outlook on the markets. We are already working on a tool that would update these levels daily for the most popular ETFs, ETNs and individual mining stocks.
Our preferred ways to invest in and to trade gold along with the reasoning can be found in the how to buy gold section. Furthermore, our preferred ETFs and ETNs can be found in our Gold & Silver ETF Ranking.
As a reminder, Gold & Silver Trading Alerts are posted before or on each trading day (we usually post them before the opening bell, but we don't promise doing that each day). If there's anything urgent, we will send you an additional small alert before posting the main one.
Thank you.
Przemyslaw Radomski, CFA
Founder, Editor-in-chief

