

Briefly: in our opinion, full (200% of the regular position size) speculative long positions in junior mining stocks are justified from the risk/reward point of view at the moment of publishing this Alert.
It was Newmont’s (NEM) earnings.
While the above might seem like a strange opening sentence, I’m quite sure the context is rather obvious.
The mining stock sector moved lower quite substantially yesterday, but the vast majority of those declines materialized in the case of the senior mining stocks. The proxies for the mining stocks that are based on senior miners, like the HUI Index and the GDX ETF, declined profoundly, while the GDXJ ETF, which is primarily based on junior miners, declined just a little.
Why would this be the case? Most likely, because one of the key senior gold mining stocks, Newmont Corporation (NEM), declined profoundly yesterday. NEM ended the day over 13% lower.
Why is this important? Because over 16% of the HUI Index is based on the NEM price, and it has the biggest (over 14%) weight in the GDX ETF. On the other hand, it’s not included in the GDXJ at all.
As a result, while the NEM was down by over 13% yesterday, the HUI Index declined by 3.46%, and the GDX declined by 3.23%. The GDXJ ETF, on the other hand, was down by only 0.88%.
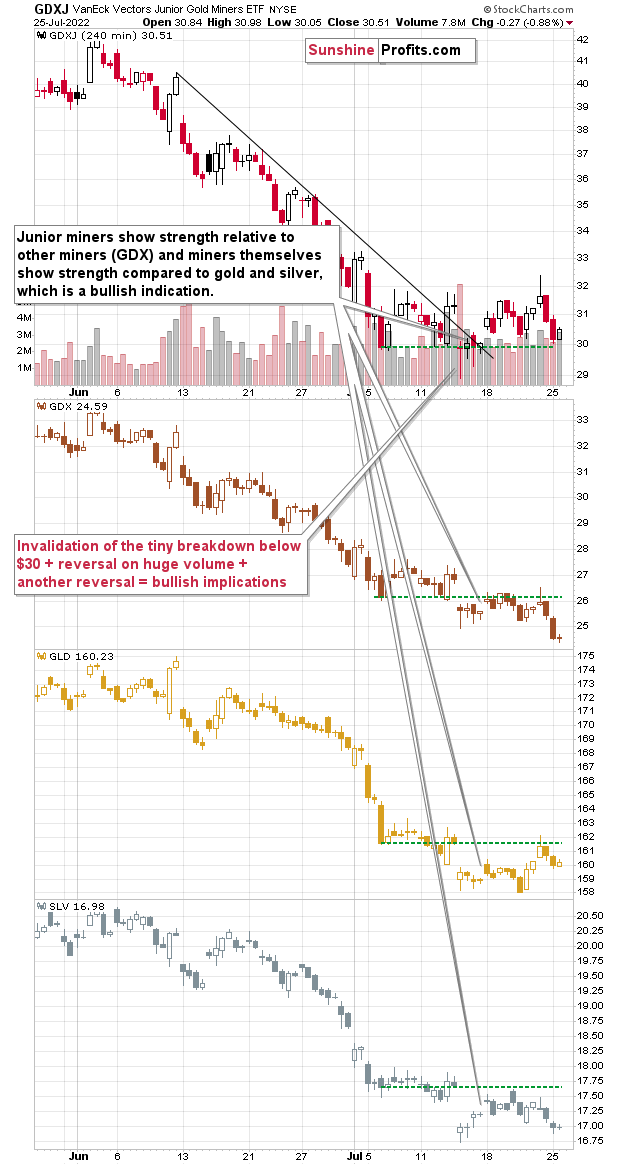
Thanks to the above, even though GLD, SLV, and GDX are below their early-July lows, the GDXJ is above its early-July low.
Technically, this is another sign of junior miners’ short-term strength, which suggests that if the precious metals market moves higher in the near term, junior miners would be likely to benefit the most (exception: silver might rally more in the very final part of the upswing).
The HUI Index itself also provided us with very interesting indications yesterday.
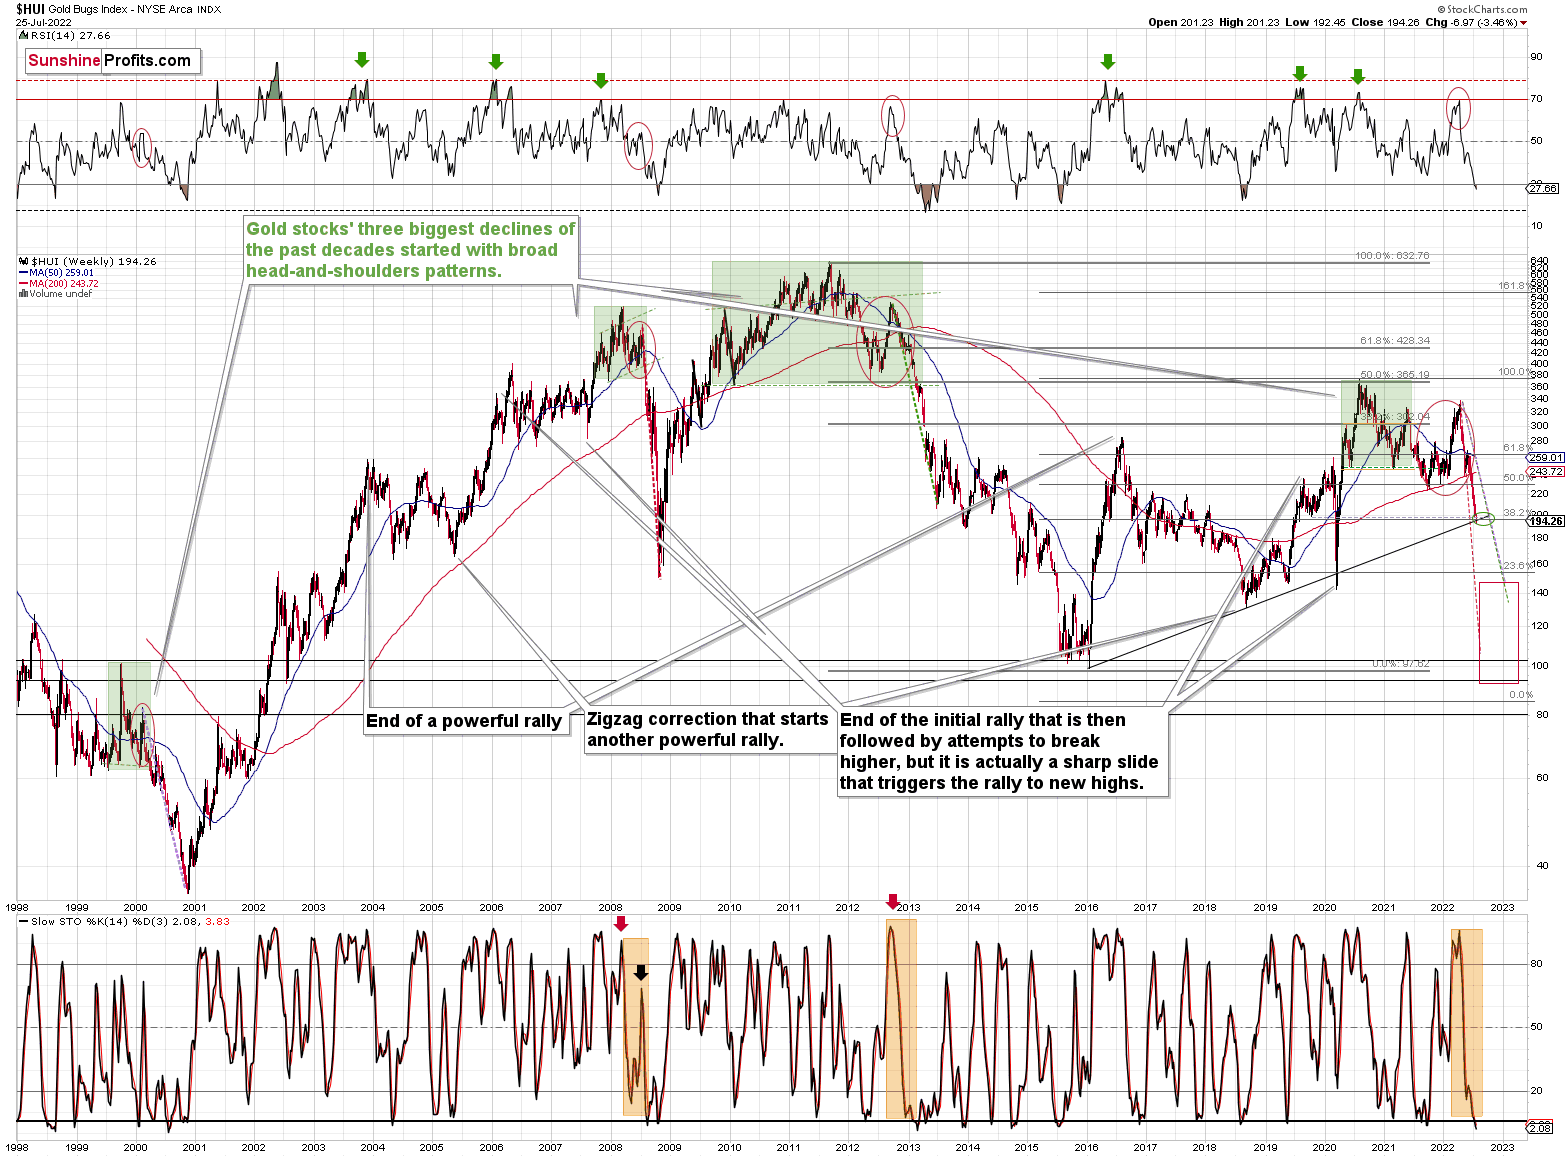
Namely, the gold stocks moved slightly below their Fibonacci retracement and the rising, long-term support line. The latter was broken only once previously. It was in early 2020, and when that happened, a very sharp rally followed practically immediately. Will we see the same thing this time? That’s quite likely. However, I don’t think the rally would be that significant.
Consequently, it could be the case that we’re going to see more strength in the precious metals market before the big move lower continues.
What we saw in the general stock market confirms this scenario.
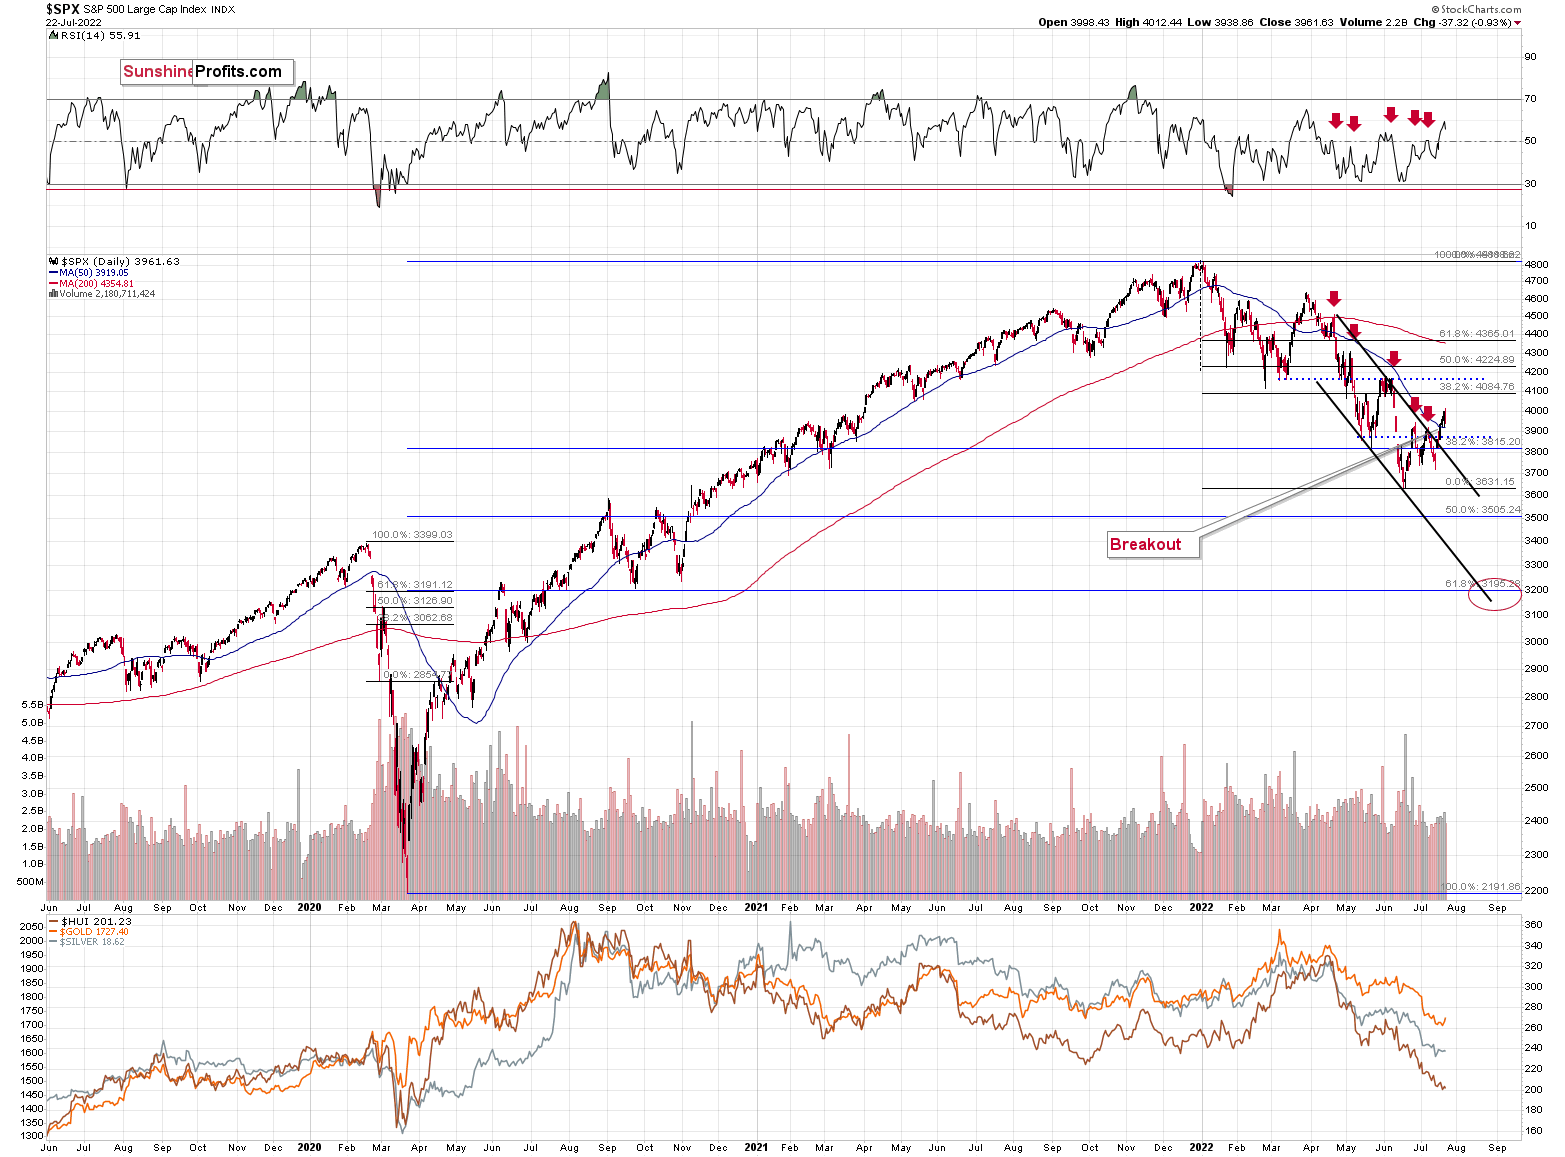
Stocks declined somewhat on Friday (July 22), and moved slightly higher yesterday (July 25). However, overall, they ended last week and yesterday’s session visibly above their declining short-term trend channel and above their 50-day moving average. That’s simply a bullish combination for the short run.
This tells us that silver and mining stocks (and especially junior mining stocks) are likely to move higher unless gold truly plunges.
What’s more, my previous comments remain up-to-date:
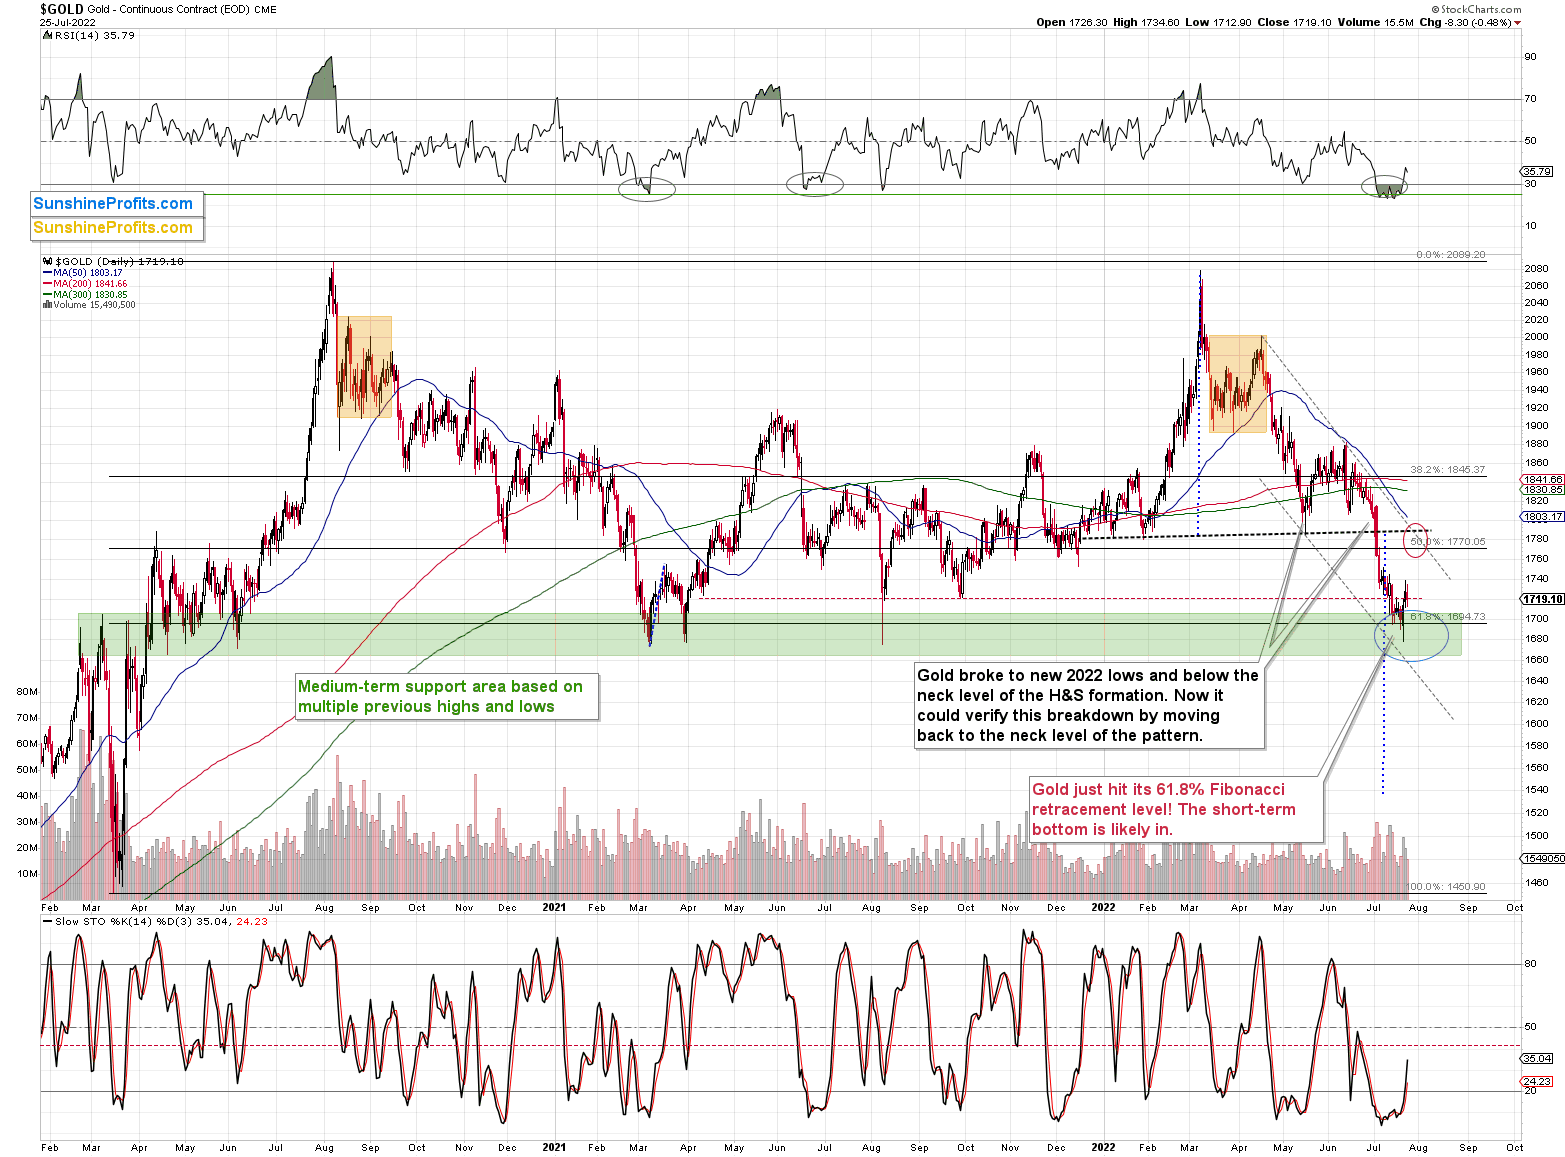
(…) Gold is likely to move higher in the short term, not plunge. The reason is that it just invalidated the breakdown below its mid-2021 lows and the 61.8% Fibonacci retracement level based on the entire 2020 rally. Gold did so after bottoming right in the middle of my target area, close to its previous lows.
Besides, in all recent cases when gold rallied after its RSI was below or very close to the 30 level, it then rallied at least until the RSI was close to 50. That’s not the case yet, so it doesn’t seem that gold is done rallying yet.
So, all in all, gold is likely to move higher within the next several days, and the same goes for the general stock market. Both are likely to contribute to higher prices in junior mining stocks. The latter are likely to rally, top, and then start another very powerful move lower. But for now, the short-term outlook remains bullish.
Let’s get back to Newmont. Why did its price decline so significantly? I’d like to quote a message that I just received from one of my subscribers (formatting was added):
Dear PR,
GDX was down A LOT today. I investigated and came up with the below. Is this the shape of things to come? HIGHER COSTS. LOWER GOLD. Could this push things lower than you think, PR? This is a big producer. Won't the juniors get hit HARDER? They don't have the balance sheet of NEM. The SNAP of miners? It could be even better for our shorts.
“Newmont (NEM) on Monday reported lower second-quarter earnings that fell short of analysts' expectations as higher costs and declining metal prices impacted the gold-mining company's results.
Adjusted profit came in at $0.46 per share, down from $0.83 a year earlier, and below the Capital IQ-polled consensus of $0.61. The result was negatively affected by higher labor, materials and consumables expenses of about $80 million, fuel and energy costs of roughly $50 million, and a $70 million charge related to the profit-sharing agreement it entered into in early July with the workforce of its Penasquito mine in Mexico.”
“Decreasing realized metal prices, including unfavorable mark-to-market adjustments on provisionally-priced sales, impacted profit by about $225 million, according to the company.
Sales for the quarter ended June 30 ticked down to $3.06 billion from $3.07 billion as higher average realized gold prices and sales volumes were offset by lower co-product metal prices, Newmont said. The Street's consensus was for $3.04 billion.”
"Newmont delivered a solid second quarter performance, producing 1.5 million gold ounces and generating $514 million in free cash flow," Chief Executive Tom Palmer said in a statement. "Newmont remains well-positioned to safely manage through the evolving and unprecedented challenges that face our industry and the world at large."
The company said the all-in sustaining cost, an industry metric that reflects total expenses associated with production, was $1,199 per ounce, up from $1,035 a year earlier, primarily due to higher costs applicable to sales per ounce.
The average realized gold price edged up 1% to $1,836 per ounce during the second quarter. Average realized prices for copper, silver, lead, and zinc slumped 32%, 24%, 22%, and 19%, respectively.
For full-year 2022, the company anticipates attributable gold production of 6 million ounces, down from 6.2 million ounces expected previously. Development capital spending was lowered to $1.1 billion from $1.4 billion, while general and administrative expenses are forecast to come in at $270 million, wider than the original guidance of $260 million, due to "slight increases" in labor costs from inflationary pressures, Newmont said.”
My short answer is that I generally agree, and I’d add a few extra things.
First, I think that in the very near term, PMs (including junior miners) are going to move higher, but that then they are likely to reverse and slide profoundly.
Second, higher costs due to inflation and higher interest rates (companies have debt, too) along with declining gold and silver prices serve as a double whammy for mining companies’ profits. Based on Newmont’s earnings – and how they missed analysts’ expectations – people are now beginning to realize that.
Let’s pause for a second here. Analysts were expecting higher profits. Analysts. Professionals. Those who are supposed to know their numbers. If the analysts overestimated the earnings so profoundly ($0.46 profit per share is about 25% below the expected $0.61!), then what do you think is going to happen to the expectations of those who are not professionals, but are just “interested” in the sector?
The investing public is generally long on everything, and people are interested in something when they think its price is going to go up. Gold has a great story behind it, and silver has an even better one. However, just because something is likely to increase in value based on the fundamental picture, it doesn’t mean that it’s going to increase in value SOON. While gold’s and silver’s fundamental situations will be tarnished only a little (silver’s might be affected more when the general stock market falls due to its industrial applications), it’s going to be very difficult for mining stock investors to avoid facing the grim reality.
Ultimately, the mining companies’ prices are based on their valuation, which is in turn based on their current and expected profitability, and there are clear numbers that show just how profitable those mining companies are. As mining companies become significantly less profitable than expected, investors will start to doubt whether investing in them makes a lot of sense.
Here’s the really important thing. Markets are forward-looking. Expectations matter. And when gold and silver prices continue to decline, people will start expecting even lower prices, which would then impact the expected profitability and thus the expected value of mining companies. If the expected value is much lower than the current price, people will sell right away so that they can still do so at prices that are relatively (compared to expectations) more favorable.
The above mentioned gold and silver (thus revenue) only. With high inflation and rising interest rates, markets will likely expect an increase in costs as well – which means a further decrease in expected profitability! This is an extremely bearish combination for mining stocks.
Let’s keep in mind that the above assumes that those companies already have significant assets and relatively stable cash flow, and junior miners don’t necessarily have both, or any of the above. They might just be exploring, hoping to find something and then further develop the property and thus start to sell it. While they are looking for resources or developing, they are going to incur costs on an ongoing basis. Costs are likely to increase, and people are likely to expect them to increase even more. This doesn’t sound encouraging, does it?
As more and more people begin to realize the above (and as they shift their expectations to lower gold/silver prices and higher costs / interest rates), they are likely to dump their junior mining stocks, contributing to the declines in their prices.
That’s what the charts (formations, cycles, relative performance, etc.) have been suggesting for months, and what I’ve been describing, but it’s only now that it’s rather clear what the fundamental narrative will be behind those declines.
For many months, I’ve been writing that miners could decline to or even below their 2016 low, and many have posted hateful comments as replies. Some laughed. But it seems that they might not be laughing for much longer.
The above doesn’t mean that miners will move below my original downside targets – it simply provides background information for it.
Also, please note that the above situation is likely to create a ridiculously favorable fire-sale price level in mining stocks. While those miners are universally hated as people think that they will never generate any profits, that gold is useless, etc., it will be then when the best long-term buying opportunity will present itself. An epic decline is likely to be followed by an epic bottom and an equally epic comeback. In fact, the recovery rally is likely to become a rally to new highs in gold, with mining stocks likely to be the biggest beneficiaries - at least in the early stages of the rally.
These are very exciting times – be sure to stay informed about them.
Having said that, let’s take a look at the markets from a more fundamental angle.
Patiently Waiting
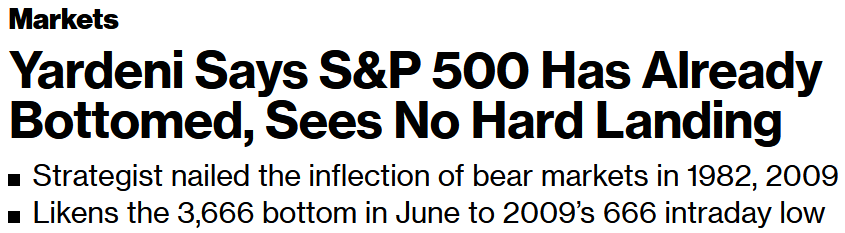
With investors unsure of how Big Tech’s earnings will perform this week and how hawkish or dovish Fed Chairman Jerome Powell will be during his press conference on Jul. 27, the financial markets were in a state of cautious paralysis on Jul. 25. However, with the narrative slowly shifting and investors prone to hearing what they want to hear, their preference for jubilation could help uplift the GDXJ ETF in the days ahead.
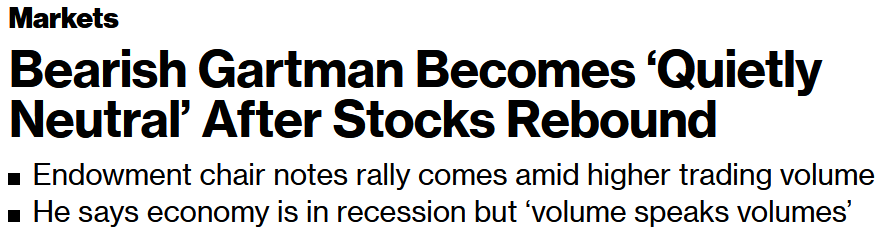
For example, with the consensus often more influenced by price than fundamentals, here are some of the headlines that hit the wire on Jul. 25:
 Source: Bloomberg
Moreover:
 Source: Bloomberg
Thus, because "volume speaks volumes," the price action – combined with the S&P 500's ability to hold up despite weak economic data – has investors assuming that peak bearishness is in the past.
To that point, Mike Wilson, Chief U.S. Equity Strategist at Morgan Stanley, predicted that the S&P 500 would bottom at ~3,400 amid a soft landing and at ~3,000 during a recession. However, with signs of uncertainty creeping in, he told clients on Jul. 25 that the S&P 500's recent strength does beg the question: “is there something going on here we are missing that could make this a more sustainable low and even the end of the bear market?"
He added:
"iF the market is starting to think the Fed is about to pause rate hikes after next week’s move, this would provide the best fundamental rationale for why equity markets have rallied so sharply over the past few weeks and why it might signal a more durable low.”
Therefore:
“With equity markets seemingly shrugging off bad news on the economy and earnings, we explore the idea that it may be trying to get ahead of the eventual pause by the Fed that is always a bullish signal.”
Now, to be fair to Wilson, he also stated that he doesn’t buy the narrative. He wrote:
“The problem with this thinking beyond a near term rally is that it’s unlikely the Fed is going to pause early enough to kick save the cycle (…). The Fed is looking more like the ECB this cycle in that they are likely to still be tightening when recession arrives this time making the window to trade the pause much shorter than usual with less upside as well."
Thus, while his overall conclusion aligns with our medium-term thinking, the doubt showcased by prior skeptics is material. I’ve noted on numerous occasions how bearish positioning has become extremely stretched recently.
As such, with everyone panicking about rampant inflation and an impending recession, their freak-outs were contrarian bullish. In a nutshell: no one is left to sell when all the bears have sold, no matter how weak the incoming fundamental data is. Then, when the shorts cover and systematic funds (CTAs) enter the mix, counterintuitive rallies like the ones we’re experiencing unfold.
However, while the GDXJ ETF hasn’t benefited much from the S&P 500’s relative strength, decent earnings prints from Big Tech (Microsoft and Alphabet report after the bell on Jul. 26) could supercharge investors’ optimism. Moreover, with heavyweights like Visa, Coca-Cola, and McDonald’s reporting in the morning, investors may find something they like.
Furthermore, if Fed Chairman Jerome Powell strikes a dovish tone on Jul. 27, the outcome would be bearish for the USD Index and bullish for the S&P 500 and the GDXJ ETF. To that point, with the futures market expecting Powell to pivot, the front-running is in full swing.
Please see below:
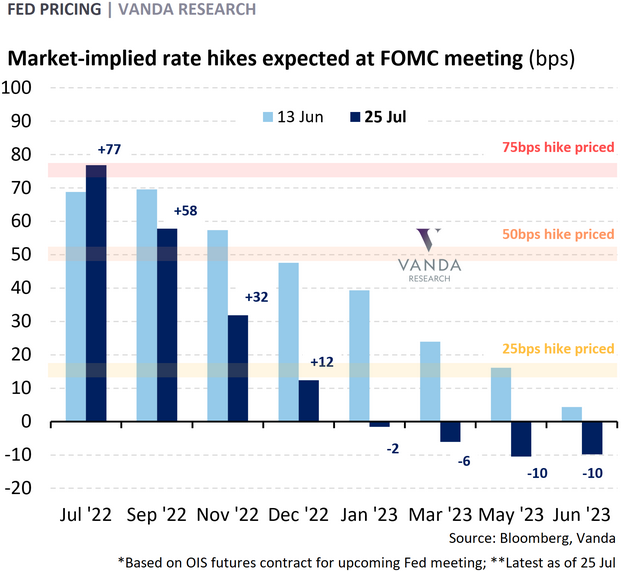
To explain, the light and dark blue bars above track the market-implied rate hikes on Jun. 13 and Jul. 25. If you analyze the height of the light blue bars, you can see that investors had priced in rate hikes through March 2023 (the final bar that reaches 25 bps).
However, the dark blue bars highlight how those expectations have materially decelerated. For example, market participants now expect the Fed to be done hiking by December 2022 and to begin cutting rates in 2023 (the negative dark blue bars).
Moreover, while a 75 basis point rate hike is considered a done deal on Jul. 27, the probability of a 50 basis point rate hike in September has dropped below 50%.
Please see below:
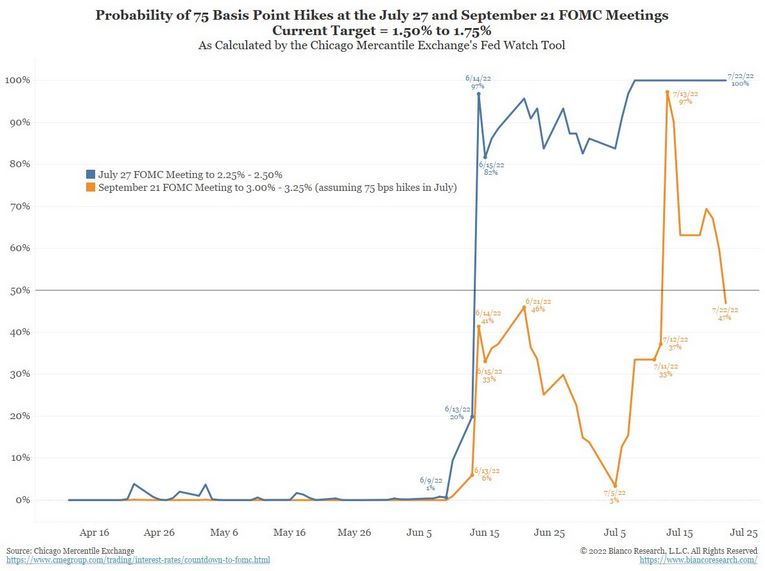
To explain, the blue line above tracks the market-implied probability of a 75 basis point rate hike this week (100%), while the orange line above tracks the market-implied probability of a 50 basis point rate hike in September (~47%). Moreover, the orange line has plunged in recent days.
Therefore, if these expectations materialize, then the USD Index is materially overvalued and the GDXJ ETF is materially undervalued. Right or wrong, the important point is that narratives move markets in the short term, and right now, the narrative is bullish for the GDXJ ETF.
Not So Fast
While investors’ misguided optimism is short-term bullish for the GDXJ ETF, the medium-term realities should have the opposite effect. For example, a 75 basis point rate hike on Jul. 27 would put the U.S. federal funds rate at 2.50%.
Moreover, if we add 25 basis points in September (since the market-implied probability of 50 basis points is less than 50%) and November, and then assume a pause in December (like the futures market expects), the U.S. federal funds rate would peak at 3%.
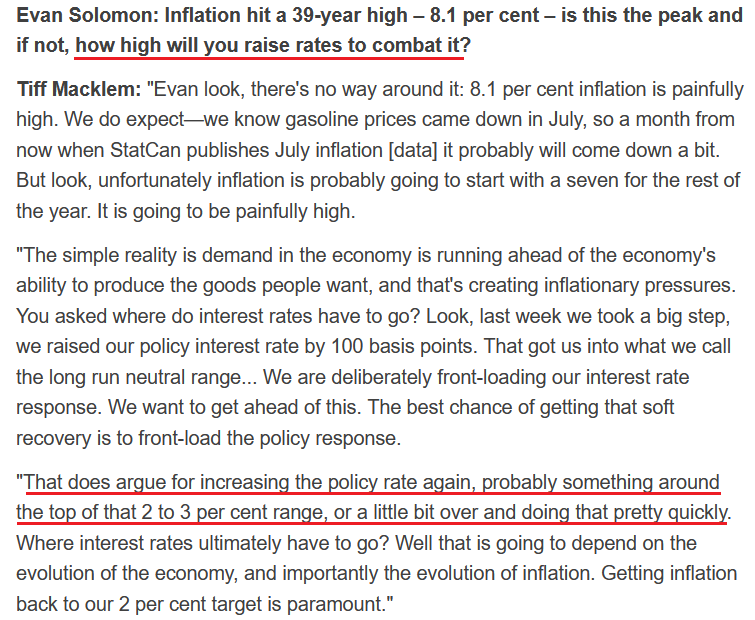
Likewise, it’s no surprise that investors have adopted these expectations. With Bank of Canada (BoC) Governor Tiff Macklem (Canada’s Jerome Powell) singing a similar tune, the new narrative is that a ~3% overnight lending rate will capsize inflation.
Please see below:
 Source: CTV News
Thus, while these developments should help uplift the GDXJ ETF in the short term, the Fed, the BoC, and investors are in fantasy land. To explain, I wrote on Jul. 25:
I noted on Jul. 22 that earnings calls from Blackstone, Hasbro, and Tractor Supply highlight how inflation is entrenched in the U.S. economy. In addition, with more earnings calls showcasing how the situation continues to worsen, market participants don’t realize that the U.S. federal funds rate needs to hit ~4.5% or more for the Fed to materially reduce inflation. For context, the consensus expects a figure in the 2.5% to 3.5% range.
Furthermore, I warned on May 26 that all three are betting on an outcome that hasn’t materialized in 70+ years. I wrote:
With annualized inflation of [9%+], calming price pressures with such little action is completely unrealistic. In fact, it’s never happened.
If you analyze the chart below, you can see that the U.S. federal funds rate (the green line) always rises above the year-over-year (YoY) percentage change in the headline Consumer Price Index (the red line) to curb inflation. Therefore, investors are kidding themselves if they think the Fed is about to re-write history.
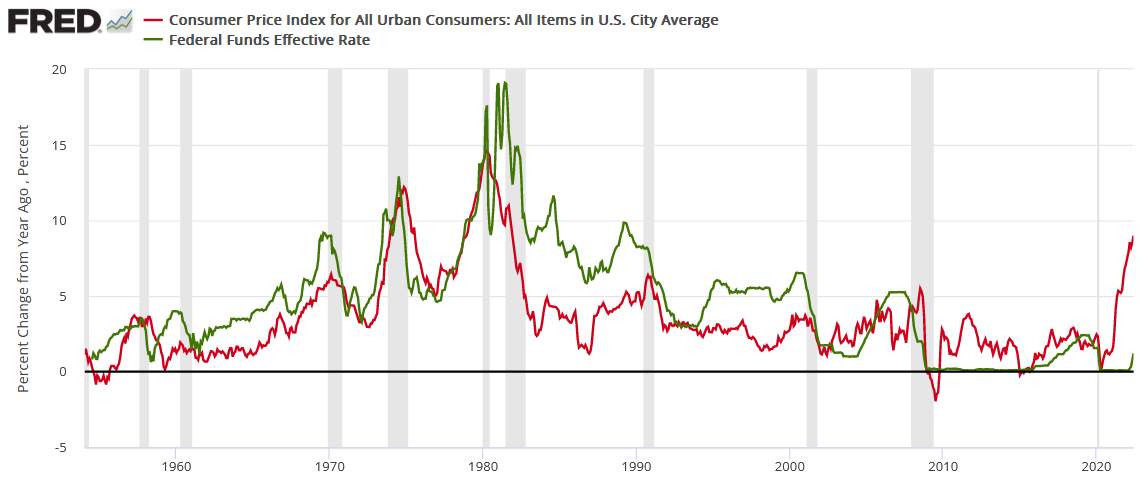
In addition, notice how every inflation spike leads to a higher U.S. federal funds rate and then a recession (the vertical gray bars)? As such, do you really think this time is different?
More Earnings Calls
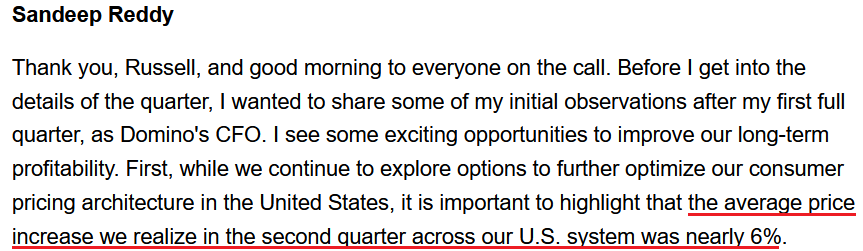
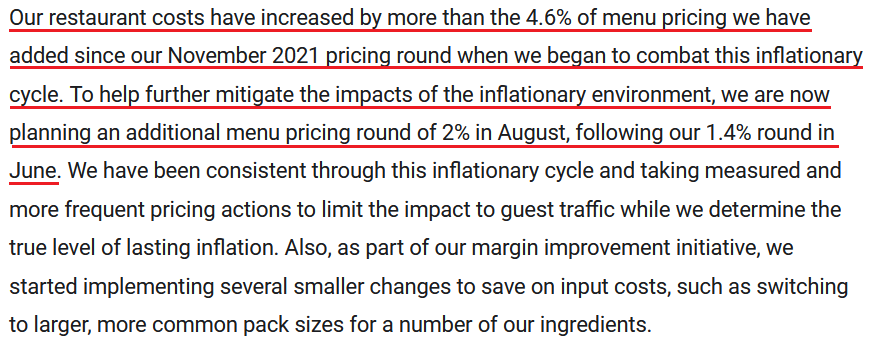
While I've noted in recent days how several earnings calls have been riddled with mentions of inflation and price increases, the chorus continues to sing. For example, Domino's Pizza released its second-quarter earnings on Jul. 21. For context, it's the largest pizza chain in the U.S.
Moreover, while Q1's pricing underperformance was notable, CFO Sandeep Reddy said during the Q2 earnings call:
“We have successfully pulled many pricing levers, including our standard menu pricing. Our national offers, our local offers and our delivery fees. This has helped us cover some of the cost increases we are incurring in both the food basket and labor market while also ensuring we continue to deliver terrific value to our consumers.”
As a result, it’s another sign that executives aren’t waiting around for the inflationary pressures to subside.
Please see below:
 Source: Domino’s Pizza/Seeking Alpha
Likewise, BJ’s Restaurants released its second-quarter earnings on Jul. 21. Moreover, while the company is smaller than Domino’s Pizza, the results are still material. During the Q2 earnings call, CEO Greg Levin said: “Inflationary pressure on our operating costs accelerated in the second quarter and is now running ahead of our earlier forecast (…). This food cost inflation equated to approximately 10% higher than in the second quarter of 2021 and 2% higher than what we experienced in the first quarter of this year.”
As a result:
 Source: BJ’s Restaurants/The Motley Fool
Also noteworthy, Levin said:
“In the second quarter, we began to more closely track the underlying patterns of our guests, so we can identify any shifts in our guest behavior early. We measure not only overall sales and traffic trends, but deeper layers such as how often certain categories of guests visit and what is being ordered from our menu, and we review and analyze this data regularly.”
“The good news is that, to date, through July, we have not yet found any measurable changes in our guest behavior. In fact, traffic patterns are following a typical seasonal trend, and our guests are continuing to enjoy the usual amount of appetizers, drinks, and desserts in our restaurants. And we haven't seen any uptick in the usage of our value offerings, including our Happy Hour and Daily Brewhouse special menus.”
Thus, while BJ’s Restaurants continues to raise prices, consumers are not pushing back. Moreover, with many companies experiencing spirited demand despite higher prices, investors materially underestimate the resiliency of inflation. Therefore, they also underestimate how far the Fed will have to go to rectify the problem.
The Bottom Line
With the bulls regaining their confidence, their willingness to overlook inflation and their position for a soft landing is bullish for the GDXJ ETF. Moreover, with the USD Index, the U.S. 10-Year real yield and high yield credit spreads all coming down, more than a few investors believe we’re closer to March 2009 than March 2008. As a result, a tactical buying opportunity remains in place.
In conclusion, the PMs declined on Jul. 25, as the waiting game continued. However, with investors increasingly excited about the market outlook, it will only take a small bout of fundamental optimism to spark a material rally. Therefore, while we expect one to occur, we also view it as an opportunity to re-enter our shorts at higher prices.
Overview of the Upcoming Part of the Decline
- It seems to me that we’re going to see a corrective upswing here (probably ending in the final week of July) that will then be followed by a very big decline in the precious metals sector.
- If we see a situation where miners slide in a meaningful and volatile way while silver doesn’t (it just declines moderately), I plan to – once again – switch from short positions in miners to short positions in silver. At this time, it’s too early to say at what price levels this could take place and if we get this kind of opportunity at all – perhaps with gold prices close to $1,600.
- If we see a situation where miners slide in a meaningful and volatile way while silver doesn’t (it just declines moderately), I plan to – once again – switch from short positions in miners to short positions in silver. At this time, it’s too early to say at what price levels this could take place and if we get this kind of opportunity at all – perhaps with gold prices close to $1,600.
- I plan to exit all remaining short positions once gold shows substantial strength relative to the USD Index while the latter is still rallying. This may be the case with gold close to $1,400. I expect silver to fall the hardest in the final part of the move. This moment (when gold performs very strongly against the rallying USD and miners are strong relative to gold after its substantial decline) is likely to be the best entry point for long-term investments, in my view. This can also happen with gold close to $1,400, but at the moment it’s too early to say with certainty.
- The above is based on the information available today, and it might change in the following days/weeks.
You will find my general overview of the outlook for gold on the chart below:
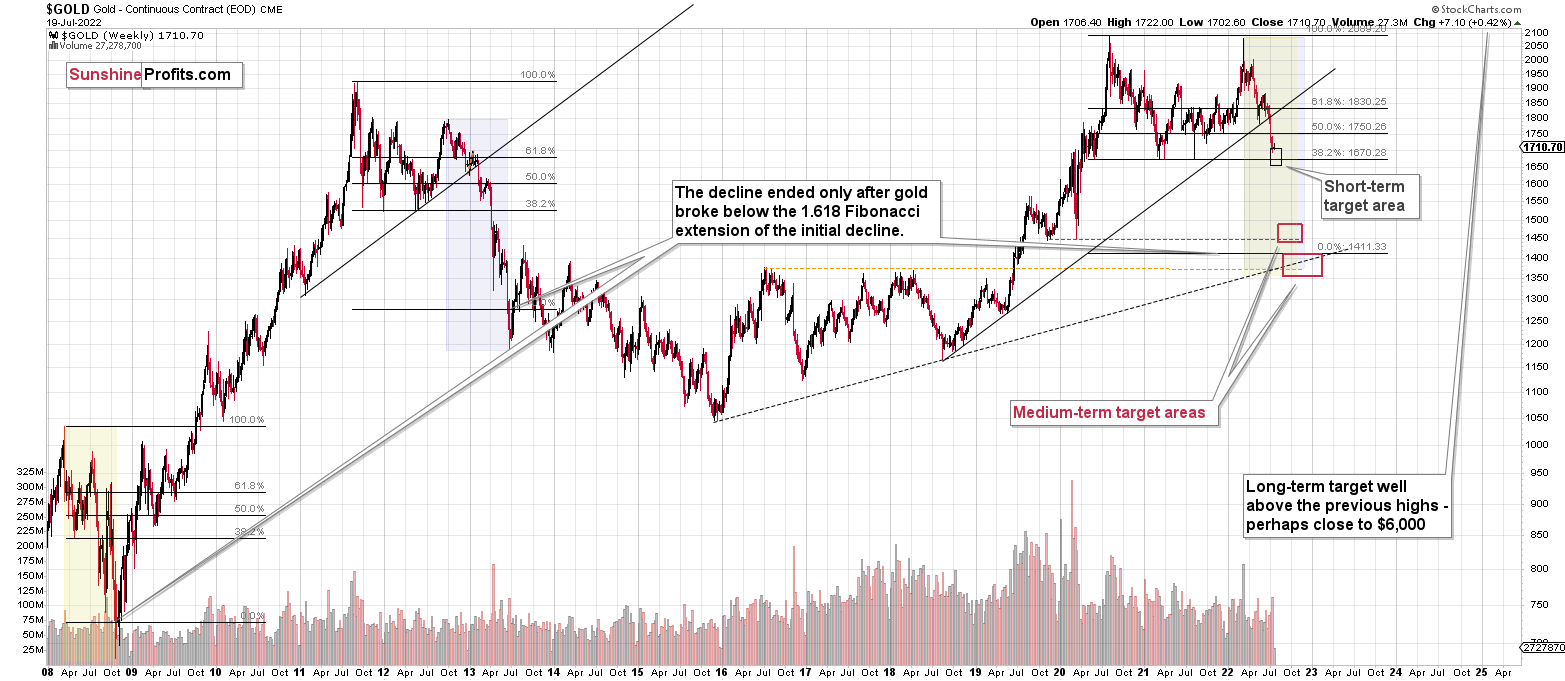
Please note that the above timing details are relatively broad and “for general overview only” – so that you know more or less what I think and how volatile I think the moves are likely to be – on an approximate basis. These time targets are not binding nor clear enough for me to think that they should be used for purchasing options, warrants, or similar instruments.
Summary
Summing up, it seems that while the medium-term trend in the precious metals sector remains down, we are likely to see a corrective upswing soon. Based on the confirmations that we have seen recently, the short-term outlook is bullish.
In my opinion, the GDXJ will most likely move higher and top sometime this week – perhaps close to the Fed’s interest rate decision.
It seems likely that the profits that we earned from the last couple of trades will increase even further in the near future.
After the final sell-off (that takes gold to about $1,350-$1,500), I expect the precious metals to rally significantly. The final part of the decline might take as little as 1-5 weeks, so it's important to stay alert to any changes.
As always, we'll keep you – our subscribers – informed.
To summarize:
Trading capital (supplementary part of the portfolio; our opinion): Full speculative long positions (200% of the full position) in junior mining stocks are justified from the risk to reward point of view with the following binding exit profit-take price levels:
Mining stocks (price levels for the GDXJ ETF): binding profit-take exit price: $33.87; stop-loss: none (the volatility is too big to justify a stop-loss order in case of this particular trade)
Alternatively, if one seeks leverage, we’re providing the binding profit-take levels for the JNUG (2x leveraged). The binding profit-take level for the JNUG: $36.78; stop-loss for the JNUG: none (the volatility is too big to justify a SL order in case of this particular trade).
For-your-information targets (our opinion; we continue to think that mining stocks are the preferred way of taking advantage of the upcoming price move, but if for whatever reason one wants / has to use silver or gold for this trade, we are providing the details anyway.):
Silver futures upside profit-take exit price: $20.28
SLV profit-take exit price: $18.78
AGQ profit-take exit price: $24.57
Gold futures upside profit-take exit price: $1,776
HGU.TO – alternative (Canadian) 2x leveraged gold stocks ETF – the upside profit-take exit price: $13.46
HZU.TO – alternative (Canadian) 2x leveraged silver ETF – the upside profit-take exit price: $9.18
Long-term capital (core part of the portfolio; our opinion): No positions (in other words: cash)
Insurance capital (core part of the portfolio; our opinion): Full position
Whether you’ve already subscribed or not, we encourage you to find out how to make the most of our alerts and read our replies to the most common alert-and-gold-trading-related-questions.
Please note that we describe the situation for the day that the alert is posted in the trading section. In other words, if we are writing about a speculative position, it means that it is up-to-date on the day it was posted. We are also featuring the initial target prices to decide whether keeping a position on a given day is in tune with your approach (some moves are too small for medium-term traders, and some might appear too big for day-traders).
Additionally, you might want to read why our stop-loss orders are usually relatively far from the current price.
Please note that a full position doesn't mean using all of the capital for a given trade. You will find details on our thoughts on gold portfolio structuring in the Key Insights section on our website.
As a reminder - "initial target price" means exactly that - an "initial" one. It's not a price level at which we suggest closing positions. If this becomes the case (as it did in the previous trade), we will refer to these levels as levels of exit orders (exactly as we've done previously). Stop-loss levels, however, are naturally not "initial", but something that, in our opinion, might be entered as an order.
Since it is impossible to synchronize target prices and stop-loss levels for all the ETFs and ETNs with the main markets that we provide these levels for (gold, silver and mining stocks - the GDX ETF), the stop-loss levels and target prices for other ETNs and ETF (among other: UGL, GLL, AGQ, ZSL, NUGT, DUST, JNUG, JDST) are provided as supplementary, and not as "final". This means that if a stop-loss or a target level is reached for any of the "additional instruments" (GLL for instance), but not for the "main instrument" (gold in this case), we will view positions in both gold and GLL as still open and the stop-loss for GLL would have to be moved lower. On the other hand, if gold moves to a stop-loss level but GLL doesn't, then we will view both positions (in gold and GLL) as closed. In other words, since it's not possible to be 100% certain that each related instrument moves to a given level when the underlying instrument does, we can't provide levels that would be binding. The levels that we do provide are our best estimate of the levels that will correspond to the levels in the underlying assets, but it will be the underlying assets that one will need to focus on regarding the signs pointing to closing a given position or keeping it open. We might adjust the levels in the "additional instruments" without adjusting the levels in the "main instruments", which will simply mean that we have improved our estimation of these levels, not that we changed our outlook on the markets. We are already working on a tool that would update these levels daily for the most popular ETFs, ETNs and individual mining stocks.
Our preferred ways to invest in and to trade gold along with the reasoning can be found in the how to buy gold section. Furthermore, our preferred ETFs and ETNs can be found in our Gold & Silver ETF Ranking.
As a reminder, Gold & Silver Trading Alerts are posted before or on each trading day (we usually post them before the opening bell, but we don't promise doing that each day). If there's anything urgent, we will send you an additional small alert before posting the main one.
Thank you.
Przemyslaw Radomski, CFA
Founder, Editor-in-chief

