

Briefly: in our opinion, full (300% of the regular position size) speculative short positions in junior mining stocks are justified from the risk/reward point of view at the moment of publishing this Alert.
In short, yesterday’s session developed practically exactly in tune with my yesterday’s analysis. PMs declined, but not substantially so. The back-and-forth movement simply continued.
What didn’t happen in the gold market is most important. Namely, gold didn’t move back above $1,700. This breakdown is now more than verified for the first time since mid-2020.
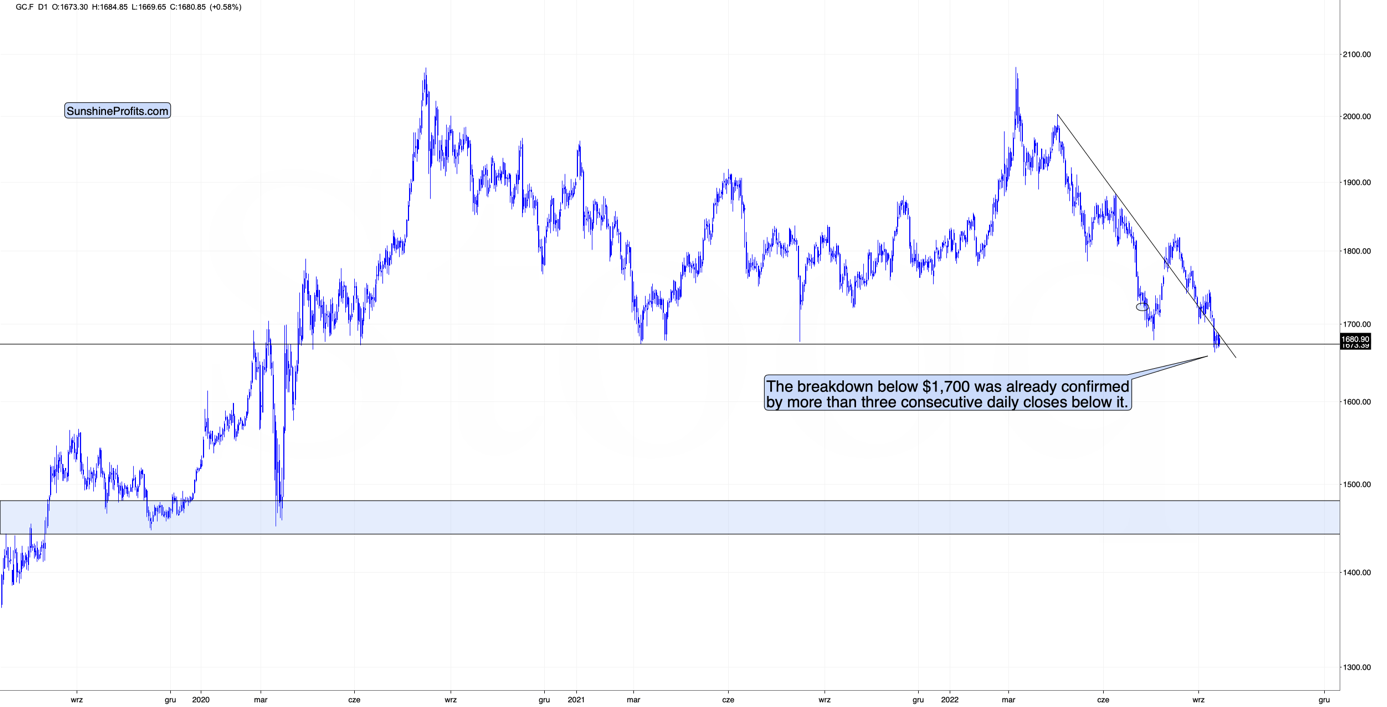
This means that gold is now very likely to slide. It probably hasn’t declined yet because the markets are waiting for the Fed. Either way, after the rate hike is announced, after/during the press conference, or once the dust settles (so in a few days), gold is likely to plunge – similarly to how it declined in 2013.
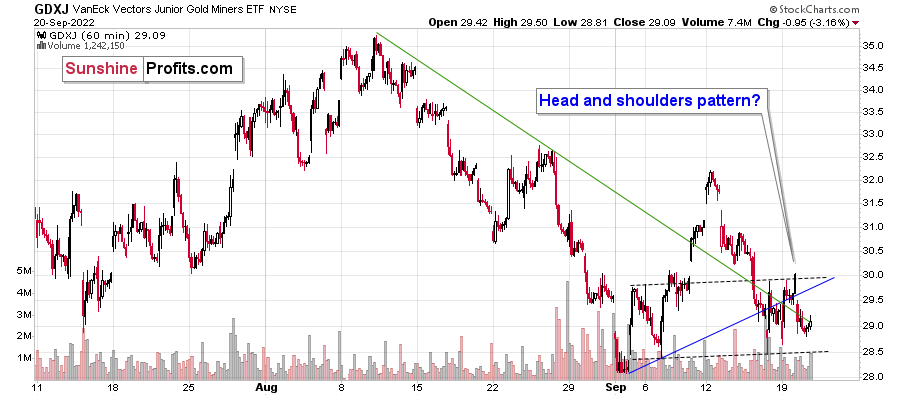
In yesterday’s analysis, I wrote that juniors (the GDXJ ETF) are now moving sideways and that they might create a head-and-shoulders pattern once they break below $28.5. Based on yesterday’s decline, they are now quite close.
The above will imply a decline to at least $25. The emphasis here is on “at least,” because there’s strong support at the 2020 lows. Such a move would likely correspond to a move to the 2020 low in gold.
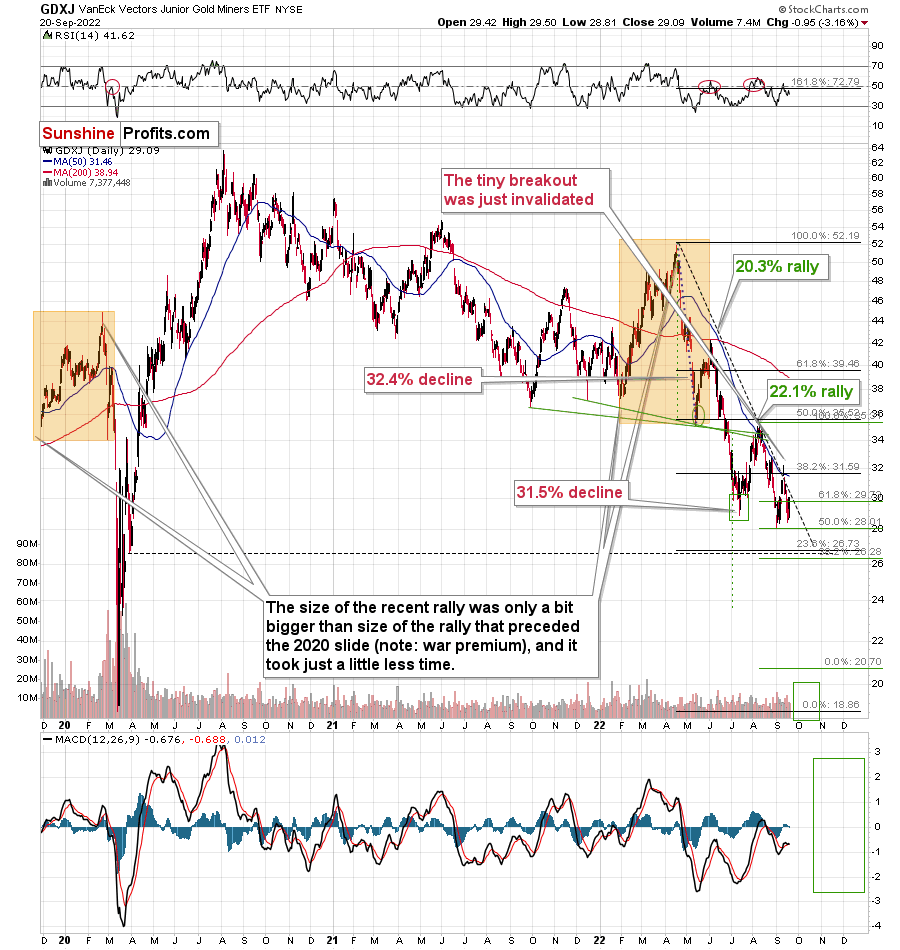
If the self-similarity to 2013 continues, then it seems that we won’t have to wait much longer for this kind of sharp decline.
All in all, the profits on our short positions in the junior mining stocks are likely to increase profoundly in the coming weeks.
Having said that, let’s take a look at the markets from a more fundamental angle.
Awaiting Powell
With risk assets suffering mightily on Sep. 20, gold, silver, mining stocks, and the S&P 500 remain under pressure. Moreover, with the bond market sell-off continuing in advance of today’s FOMC meeting, higher interest rates are problematic for the liquidity beneficiaries.
To that point, with the U.S. 10-Year Treasury yield hitting another 2022 high on Sep. 20, the benchmark has rallied substantially over the last month and a half.
Please see below:
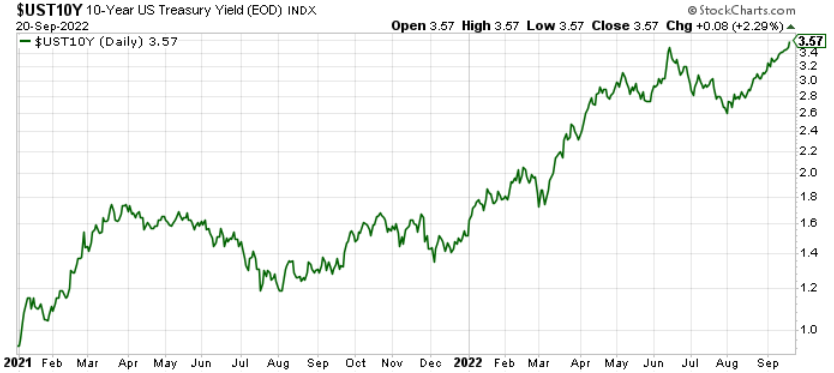
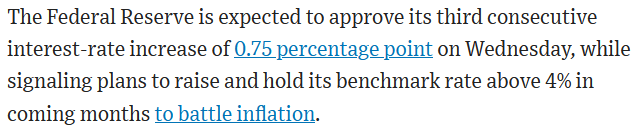
More importantly, with the U.S. 10-Year real yield hitting yet another 2022 high of 1.17%, inflation-adjusted interest rates continue to haunt the PMs. Likewise, while uncertainty reigns about whether the FOMC will opt for a 75 or a 100 basis point rate hike today, I noted previously that the former is the most likely outcome.
As such, with the Wall Street Journal’s (WSJ) Nick Timiraos – Fed Chairman Jerome Powell’s right-hand man in the press – writing on Sep. 20 that 75 basis points are expected, a shock-and-awe event may not materialize in the hours ahead.
Please see below:
 Source: WSJ
Thus, while the financial markets may celebrate the 25 basis point respite, it's more important to watch where the U.S. federal funds rate (FFR) peaks. For example, roughly two months ago, the consensus assumed the FFR would settle in the 2.5% to 3.5% range. However, with that outcome extremely unrealistic given the 8%+ Consumer Price Index (CPI), expectations have re-priced to roughly 4.5%.
Therefore, with the Fed scheduled to release its latest Summary of Economic Projections (SEP) today, the median FFR projection is immensely important. With Fed officials materially wrong about inflation and interest rates throughout 2021 and 2022, they have plenty of work to do to restore credibility.
Furthermore, Powell helped ignite a risk rally during his last FOMC press conference, which loosened financial conditions and made inflation worse. However, if he instead builds on his message from Jackson Hole and reiterates his commitment to reducing inflation, he'll avoid making the same mistake.
The Hawkish U.S. Labor Market
With the U.S. labor market far from crisis levels, employment strength should allow the Fed to focus squarely on inflation. To explain, I wrote on Sep. 20:
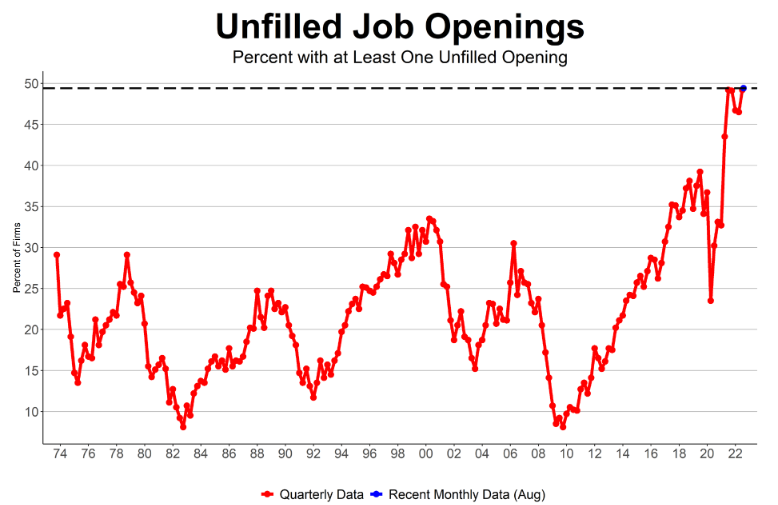
The NFIB released its Small Business Optimism Index on Sep. 13. The headline index increased from 89.9 in July to 91.8 in August. NFIB Chief Economist Bill Dunkelberg said during the earlier released jobs report.
“The labor market continues to be a significant challenge for small business owners. Owners are managing several economic headwinds and continue to make business adjustments to mitigate lost sales opportunities due to staffing shortages. Almost half of owners are raising compensation to attract workers for their open positions.”
The report added:
“Small business owners’ plans to fill open positions remain elevated, with a seasonally adjusted net 21% planning to create new jobs in the next three months, up one point from July.”
Thus, while the crowd hopes the Fed is near the end of its rate hike cycle, U.S. small businesses’ labor demand increased month-over-month (MoM), which is bullish for wage inflation.
Please see below:
 Source: NFIB
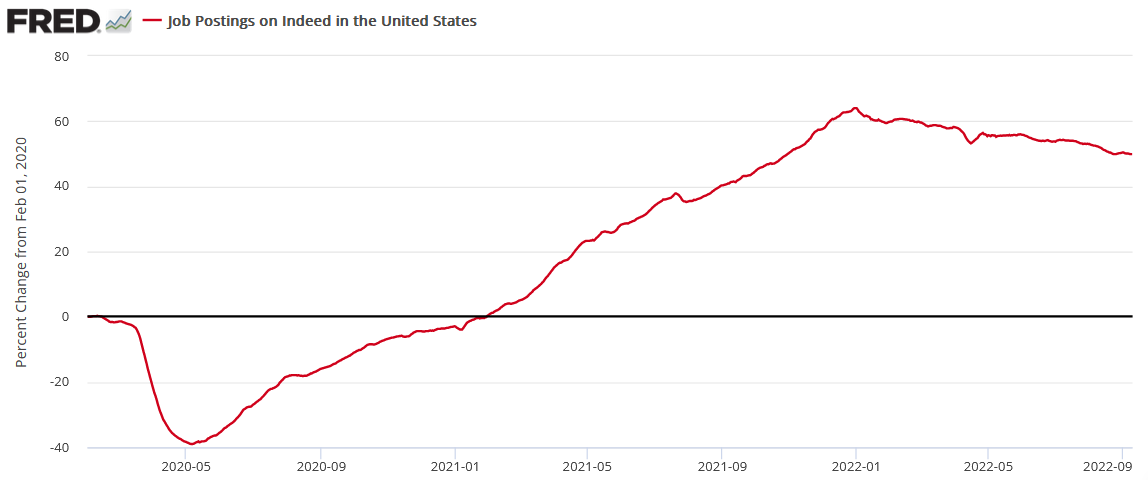
Likewise, Indeed updated its job postings data on Sep. 14. Moreover, while employment opportunities have decreased from their January high, there are still 49.9% more job openings on Indeed than before the pandemic struck (as of the week ending Sep. 9). As a result, the labor market resilience allows the Fed to keep hammering inflation.
Please see below:
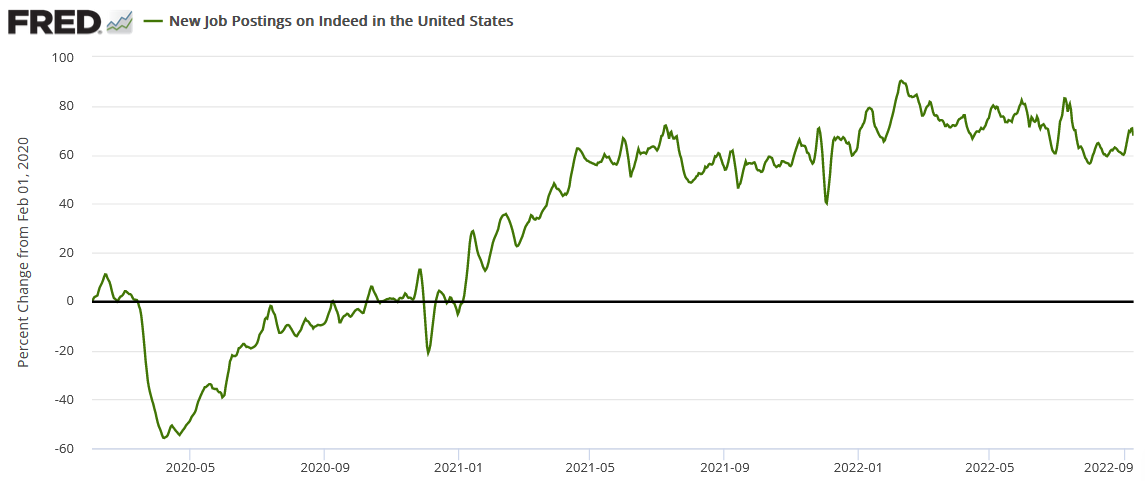
On top of that, new job postings on Indeed continue to hold up relatively well. For example, when a position is filled and the job posting is removed, new postings are needed to keep the overall data elevated. However, with new listings still 67.8% above their pre-pandemic baseline (as of the week ending Sep. 9), the U.S. labor market is not falling off a cliff.
Also, after bottoming at 56.4% on Jul. 31, the percentage change in new job postings on Indeed has increased over the last ~two months. As such, the employment backdrop is profoundly bullish for Fed policy.
Please see below:
In addition, Americans’ behavior highlights their confidence in the U.S. labor market. Indeed, it noted on Aug. 29 how ~46% of employees received raises exceeding the inflation rate.
Please see below:
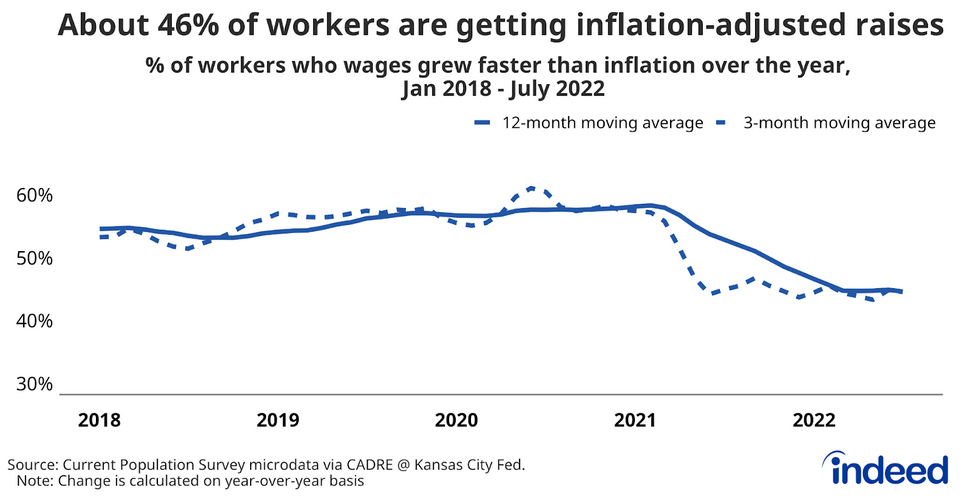
To explain, the solid and dashed lines above track the 12 and three-month moving averages of the percentage of Americans whose wages exceed the year-over-year (YoY) inflation rate. If you analyze the right side of the chart, you can see that the metric has declined from its pre-pandemic highs.
However, please remember that the pre-pandemic (2018 to early 2020) headline CPI ranged from a high of 2.90% YoY to a low of 1.48% YoY. Therefore, it was easy for employees to secure wage increases that exceeded inflation. In contrast, with the headline CPI above 8% for the last six months, it’s remarkable that nearly half of Americans are experiencing greater wage growth.
As a result, we’re nowhere near the level of employment destruction that would alleviate wage inflation and allow for a dovish pivot.
As further evidence, Indeed found that Americans are searching for jobs that pay more than they asked for pre-pandemic. The report revealed:
“Throughout 2019 and much of 2020, the share of searches on Indeed mentioning ‘$15’ was greater than those mentioning ‘$20.’ But that trend reversed in April 2021. Since then, the share of $20-related searches has outpaced searches mentioning $15. Moreover, as of August 14, the share of $20-related searches has grown 35.5% YoY. By contrast, searches related to $15 have declined 57.3% over the same time period.”
“Job seeker searches for ‘$25’ have risen as well. While still smaller than those for $20, the share of $25-related searches has increased 122% YoY as of August 14. Additionally, the share of searches for $25 has outstripped the share of $15-related searches as of mid-June 2022.”
Please see below:
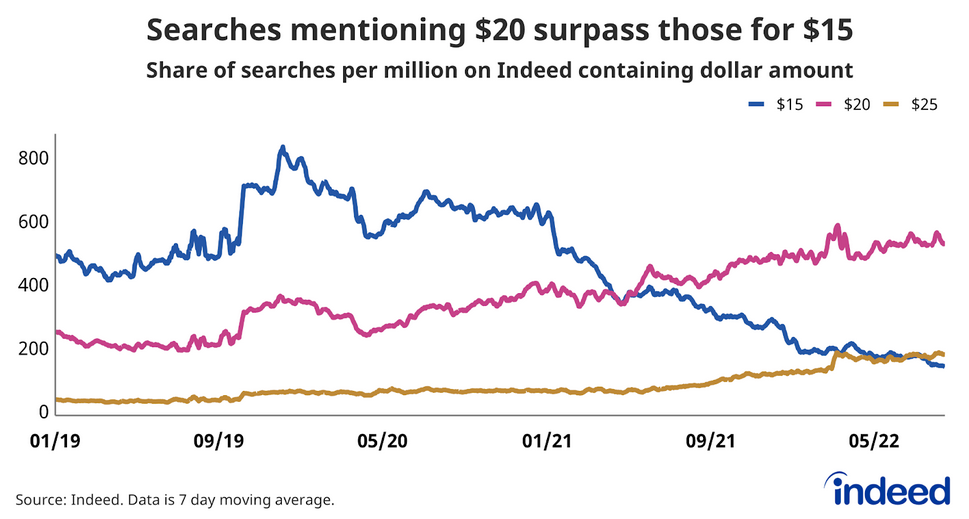
To explain, the blue, purple, and brown lines above track Americans’ $15, $20 and $25 per hour job searches. If you analyze the drop in the blue line and the rises in the purple and brown lines, you can see that Americans expect higher pay for the same work. This is profoundly inflationary.
Likewise, this is not what the Fed expected to see after nine 25-basis-point rate hikes in 2022. Moreover, I warned during our post-FOMC recap on Nov. 4, 2021 that wage inflation would prove problematic for the “transitory” crowd. I wrote:
Powell said during his press conference that “the inflation that we’re seeing is really not due to a tight labor market. It’s due to bottlenecks and it’s due to shortages and it’s due to very strong demand meeting those…. We don’t see troubling increases in wages, and we don’t expect those to emerge.”
The bottom line? While the USD Index endured a ‘sell the news’ event on Nov. 3, the greenback’s fundamentals are stronger now than at any other point in 2021; and with Powell’s lack of foresight poised to elicit more hawkish shifts over the medium term, the dollar basket’s uptrend should remain in place for the foreseeable future. What’s more, with U.S. Treasury yields likely to resume their uptrends as well, more downside should confront the PMs over the next few months.
Thus, with the U.S. 2-Year, 5-Year, 10-Year, and 30-Year Treasury yields hitting new 2022 highs on Sep. 20, the forecast has proved prescient. Furthermore, with the USD Index one of the best-performing assets in 2022, it’s likely only a matter of time before the dollar basket surpasses 111. Conversely, the GDXJ ETF has been one of the worst-performing assets in 2022.
Therefore, while the crowd considers the difference between 75 and 100 basis points important, it’s largely immaterial from a medium-term perspective. In reality, the peak FFR is much more critical, and the state of inflation and the U.S. labor market support higher short-term interest rates in the months ahead.
The Bottom Line
With the U.S. 10-Year real yield matching its 2018 high, the development is profoundly bearish for gold, silver, mining stocks and the S&P 500. Moreover, while the sell-off on Sep. 20 may turn into a ‘sell the rumor, buy the news’ event today, short-term sentiment highs have been a dime a dozen. In contrast, the re-emergence of reality has helped the USD Index and the U.S. 10-Year real yield hit new highs and the GDXJ ETF hit new lows. As such, we expect similar outcomes over the medium term.
In conclusion, the PMs declined on Sep. 20, as the financial markets remained highly volatile. However, with the technicals and the fundamentals signaling more precious metals pain, their medium-term outlooks remain profoundly bearish. Thus, while the daily price action is unpredictable, the PMs should continue their downtrends until the Fed turns dovish and the long-term charts turn bullish.
Overview of the Upcoming Part of the Decline
- It seems to me that the corrective upswing is over, and that the next big move lower is already underway.
- If we see a situation where miners slide in a meaningful and volatile way while silver doesn’t (it just declines moderately), I plan to – once again – switch from short positions in miners to short positions in silver. At this time, it’s too early to say at what price levels this could take place and if we get this kind of opportunity at all – perhaps with gold prices close to $1,600.
- I plan to switch from the short positions in junior mining stocks or silver (whichever I’ll have at that moment) to long positions in junior mining stocks when gold / mining stocks move to their 2020 lows (approximately). While I’m probably not going to write about it at this stage yet, this is when some investors might consider getting back in with their long-term investing capital (or perhaps 1/3 or 1/2 thereof).
- I plan to return to short positions in junior mining stocks after a rebound – and the rebound could take gold from about $1,450 to about $1,550, and it could take the GDXJ from about $20 to about $24.
- I plan to exit all remaining short positions once gold shows substantial strength relative to the USD Index while the latter is still rallying. This may be the case with gold prices close to $1,400 and GDXJ close to $15 . This moment (when gold performs very strongly against the rallying USD and miners are strong relative to gold after its substantial decline) is likely to be the best entry point for long-term investments, in my view. This can also happen with gold close to $1,400, but at the moment it’s too early to say with certainty.
- The above is based on the information available today, and it might change in the following days/weeks.
You will find my general overview of the outlook for gold on the chart below:
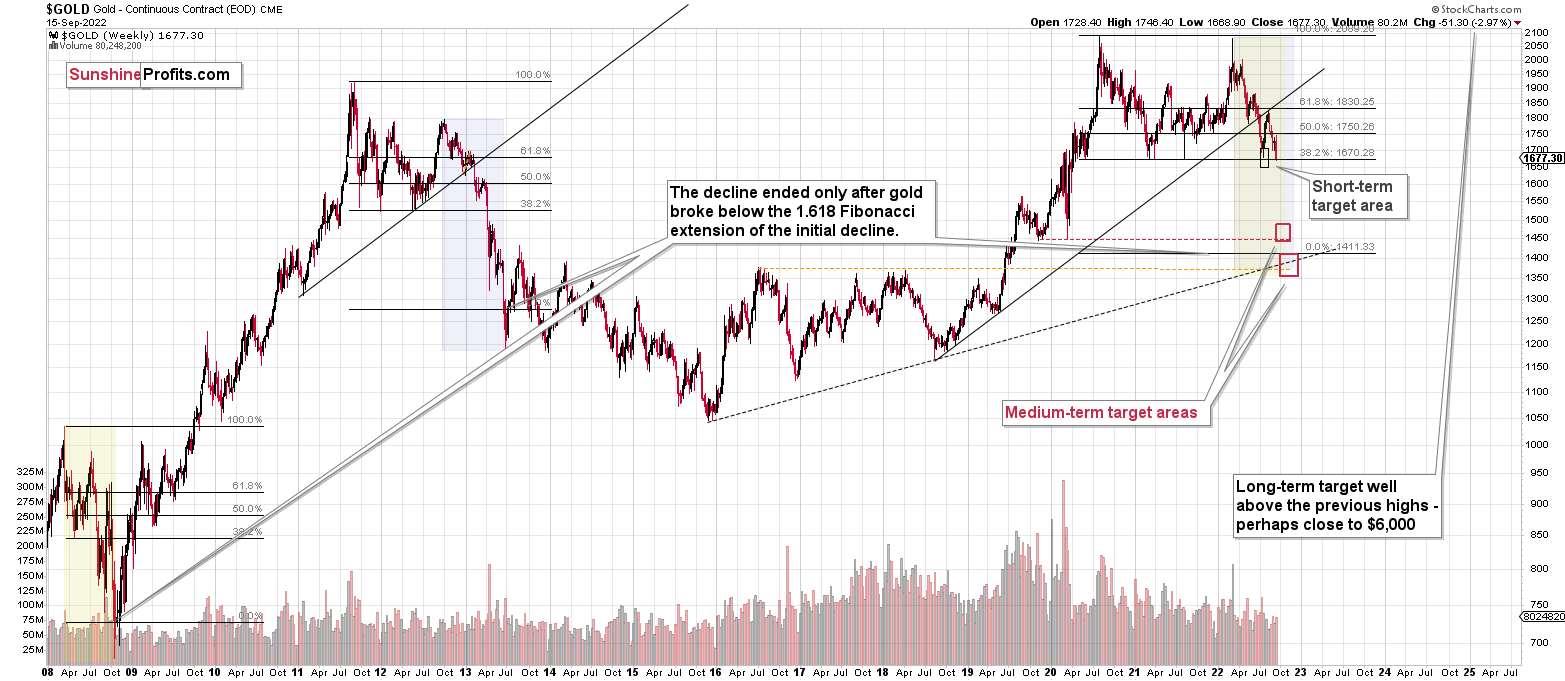
Please note that the above timing details are relatively broad and “for general overview only” – so that you know more or less what I think and how volatile I think the moves are likely to be – on an approximate basis. These time targets are not binding nor clear enough for me to think that they should be used for purchasing options, warrants, or similar instruments.
Summary
Summing up, it seems that the biggest part of the 2013-like decline is taking place right now, and – while I can’t make any promises regarding performance - it seems likely to me that our big profits are about to become huge, and then ridiculously big in the relatively near future.
Things might happen very fast in the coming days, and if I plan to make any adjustments, I’ll keep you informed. Still, if the targets that I’m mentioning in the “Trading” part of the summary are reached, I think that profits should be taken off the table without an additional confirmation from me. I will probably get on the long side of the market at that time, but I’ll send a confirmation if I decide to do so.
After the final sell-off (that takes gold to about $1,350-$1,500), I expect the precious metals to rally significantly. The final part of the decline might take as little as 1-5 weeks, so it's important to stay alert to any changes.
As always, we'll keep you – our subscribers – informed.
To summarize:
Trading capital (supplementary part of the portfolio; our opinion): Full speculative short positions (300% of the full position) in junior mining stocks are justified from the risk to reward point of view with the following binding exit profit-take price levels:
Mining stocks (price levels for the GDXJ ETF): binding profit-take exit price: $20.32; stop-loss: none (the volatility is too big to justify a stop-loss order in case of this particular trade)
Alternatively, if one seeks leverage, we’re providing the binding profit-take levels for the JDST (2x leveraged). The binding profit-take level for the JDST: $29.87; stop-loss for the JDST: none (the volatility is too big to justify a SL order in case of this particular trade).
For-your-information targets (our opinion; we continue to think that mining stocks are the preferred way of taking advantage of the upcoming price move, but if for whatever reason one wants / has to use silver or gold for this trade, we are providing the details anyway.):
Silver futures downside profit-take exit price: $12.32
SLV profit-take exit price: $11.32
ZSL profit-take exit price: $79.87
Gold futures downside profit-take exit price: $1,504
HGD.TO – alternative (Canadian) 2x inverse leveraged gold stocks ETF – the upside profit-take exit price: $19.87
HZD.TO – alternative (Canadian) 2x inverse leveraged silver ETF – the upside profit-take exit price: $49.87
Long-term capital (core part of the portfolio; our opinion): No positions (in other words: cash)
Insurance capital (core part of the portfolio; our opinion): Full position
Whether you’ve already subscribed or not, we encourage you to find out how to make the most of our alerts and read our replies to the most common alert-and-gold-trading-related-questions.
Please note that we describe the situation for the day that the alert is posted in the trading section. In other words, if we are writing about a speculative position, it means that it is up-to-date on the day it was posted. We are also featuring the initial target prices to decide whether keeping a position on a given day is in tune with your approach (some moves are too small for medium-term traders, and some might appear too big for day-traders).
Additionally, you might want to read why our stop-loss orders are usually relatively far from the current price.
Please note that a full position doesn't mean using all of the capital for a given trade. You will find details on our thoughts on gold portfolio structuring in the Key Insights section on our website.
As a reminder - "initial target price" means exactly that - an "initial" one. It's not a price level at which we suggest closing positions. If this becomes the case (as it did in the previous trade), we will refer to these levels as levels of exit orders (exactly as we've done previously). Stop-loss levels, however, are naturally not "initial", but something that, in our opinion, might be entered as an order.
Since it is impossible to synchronize target prices and stop-loss levels for all the ETFs and ETNs with the main markets that we provide these levels for (gold, silver and mining stocks - the GDX ETF), the stop-loss levels and target prices for other ETNs and ETF (among other: UGL, GLL, AGQ, ZSL, NUGT, DUST, JNUG, JDST) are provided as supplementary, and not as "final". This means that if a stop-loss or a target level is reached for any of the "additional instruments" (GLL for instance), but not for the "main instrument" (gold in this case), we will view positions in both gold and GLL as still open and the stop-loss for GLL would have to be moved lower. On the other hand, if gold moves to a stop-loss level but GLL doesn't, then we will view both positions (in gold and GLL) as closed. In other words, since it's not possible to be 100% certain that each related instrument moves to a given level when the underlying instrument does, we can't provide levels that would be binding. The levels that we do provide are our best estimate of the levels that will correspond to the levels in the underlying assets, but it will be the underlying assets that one will need to focus on regarding the signs pointing to closing a given position or keeping it open. We might adjust the levels in the "additional instruments" without adjusting the levels in the "main instruments", which will simply mean that we have improved our estimation of these levels, not that we changed our outlook on the markets. We are already working on a tool that would update these levels daily for the most popular ETFs, ETNs and individual mining stocks.
Our preferred ways to invest in and to trade gold along with the reasoning can be found in the how to buy gold section. Furthermore, our preferred ETFs and ETNs can be found in our Gold & Silver ETF Ranking.
As a reminder, Gold & Silver Trading Alerts are posted before or on each trading day (we usually post them before the opening bell, but we don't promise doing that each day). If there's anything urgent, we will send you an additional small alert before posting the main one.
Thank you.
Przemyslaw Radomski, CFA
Founder, Editor-in-chief

