

Briefly: in our opinion, full (300% of the regular position size) speculative short positions in junior mining stocks are justified from the risk/reward point of view at the moment of publishing this Alert. I’m adjusting the exit prices for our short positions.
Yesterday’s session was somewhat opposite to what we had seen on Tuesday. Yesterday, gold fell, while silver and mining stocks were almost untouched. Why would this be the case, and what are the implications?
It was likely due to the stock market’s bounce. Stocks moved higher on an immediate-term basis, and since silver and miners are more linked with it than gold is, they were affected to a greater extent.
Most of what I wrote about the charts yesterday remains up-to-date, but today I will add some extra details.
Let’s start with gold and what I wrote about it previously.
The triangle-vertex-based turning point is several days away, and so is gold’s combination of strong support levels.
Gold has a triangle-vertex-based reversal point nearby, which confirms the analogous point in the GDXJ. They both confirm each other.
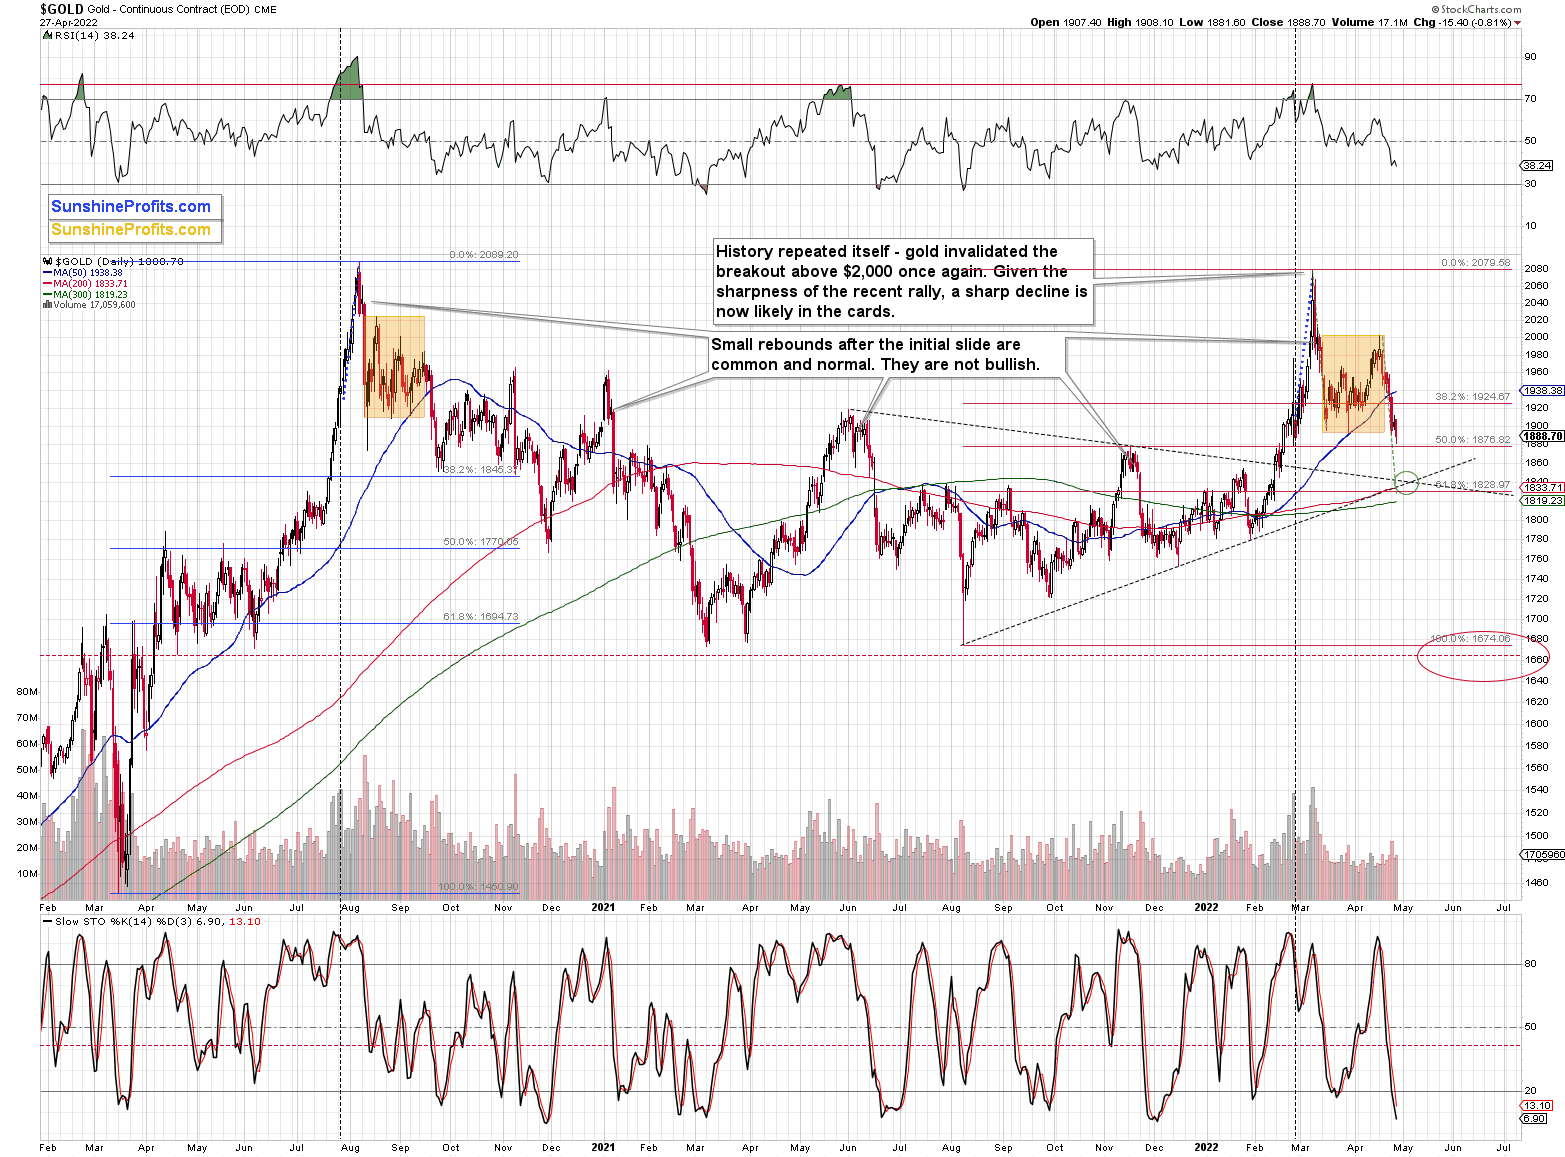
In the case of gold, please note how it followed its self-similarity to the post-2020 top trading patterns. The yellow metal moved slightly above its initial post-top bottom, and then it immediately turned south.
The support lines cross at about $1,845, so that’s where we might see the next short-term rebound, but let’s keep in mind that it’s not likely to be anything more than that – a corrective rebound that is then followed by another move lower.
The ~$1,845 target is additionally supported by the markets’ tendency to repeat the move that took place before a given consolidation. In this case, a decline preceded the consolidation (marked in orange), so the consolidation is likely to be followed by one too.
In addition, this is what we saw in 2020, after the analogous top. I also marked the previous consolidation with an orange rectangle, and, as you can see, the move that preceded the consolidation was similar to the one that followed it.
In the current situation, the above supports the move to about $1,840, which is in perfect tune with the above-mentioned short-term target.
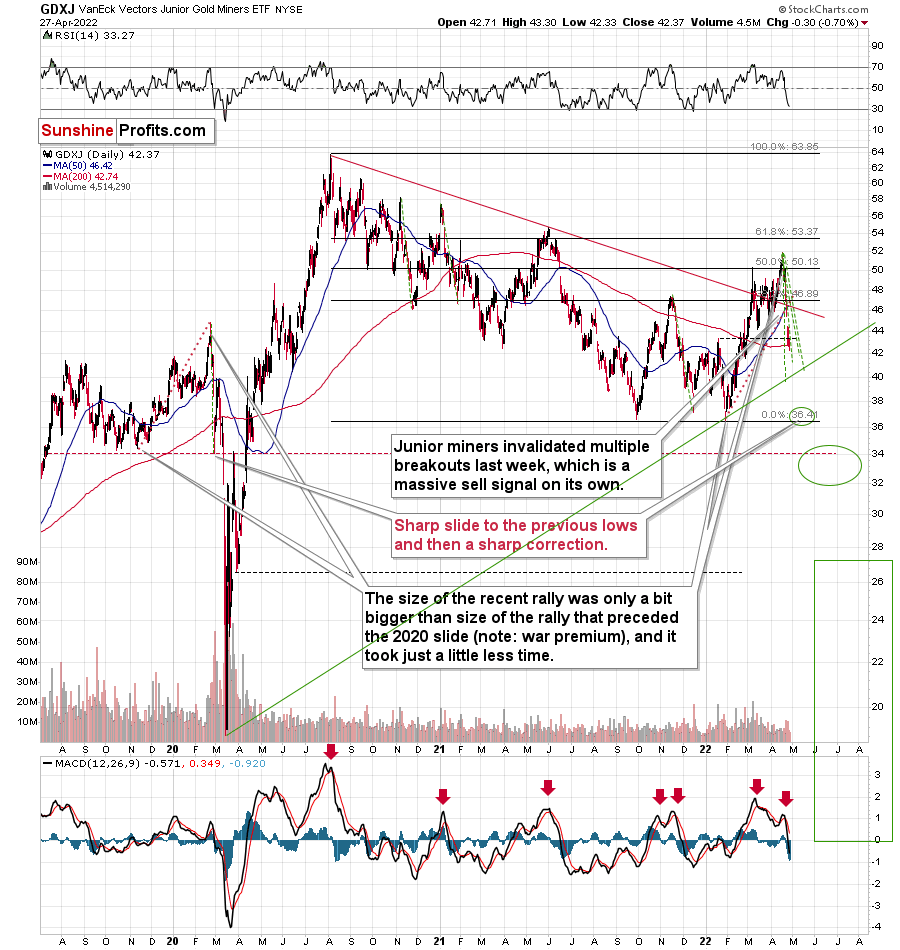
Speaking of junior miners, please note that they just closed back below their January low high for the second consecutive day. A third close below this level will confirm the breakdown , and it will pave the way for further declines.
Now, having said that, I would like to point out one of the facts that emphasizes why I think that a corrective, very short-term upswing might be just around the corner.
The green, dashed lines represent the sharpest short-term declines that we saw in the GDXJ in the recent past. Only the final March 2020 slide was bigger. As you can see, the GDXJ is now quite close to the levels that imply this kind of excessiveness. You can also notice that the ~$37 target is visibly below those levels. This has two important implications:
- If the GDXJ drops to ~$37 without correcting first, it will be extremely oversold on a very short-term basis, making a very short-term rally very likely.
- There is a possibility that the GDXJ will correct before moving to ~$37, perhaps closer to the $40 level, where the rising, green support line is located.
When we zoom in, we see that the triangle-vertex-based reversal is just around the corner.
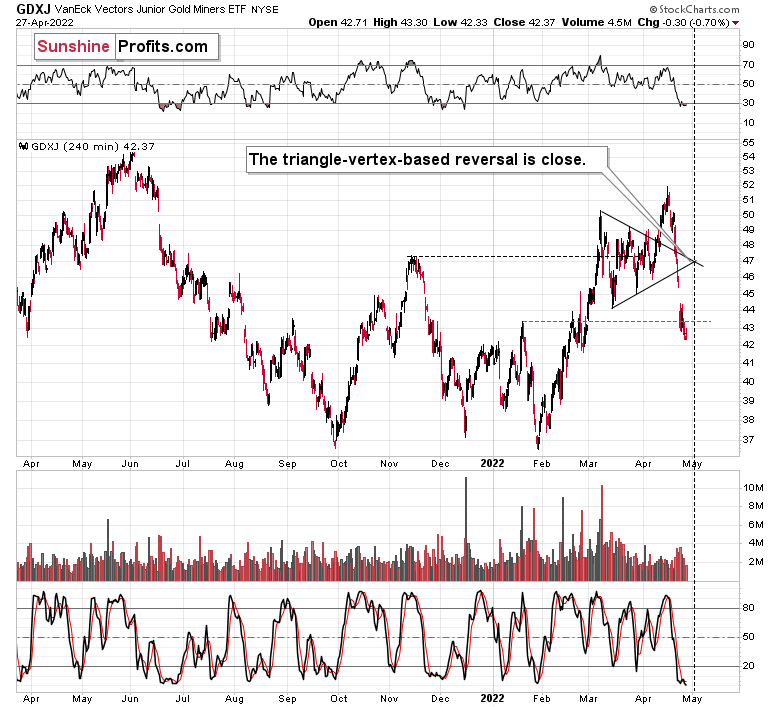
After adjusting the lines to make them 100% precise, the vertex is at the beginning of May, on Tuesday (May 3) or Wednesday (May 4). Let’s not forget that Wednesday is the Fed’s interest rate decision day.
Consequently, it seems that we have about 4 sessions until the end of this short-term decline. When will the GDXJ go off during this time? Will it really be able to drop more than it did in the previous cases (green lines on the previous chart) and follow its 2020 analogy to the letter?
As a reminder, the 2022 rally is somewhat similar to what we saw in late 2019 and early 2020. I marked it with red dotted lines on the first GDXJ chart. The rally was a bit bigger this year (the war premium would explain that) and it was a bit shorter. However, the thing that I would like to emphasize is that back in 2020, the decline didn’t end until the GDXJ erased its entire rally, and the road to the initial lows was very rapid.
So, if the analogy described in point 2 continues, we might see another huge wave down before seeing a corrective upswing.
Back in 2020, the corrective upswing was very sharp, and if we see a decline that’s very volatile beforehand, I would expect to see a similarly volatile upswing.
Can GDXJ really decline to $37 within a week? That seems unlikely at first, but when one considers that it was trading above $50 about a week ago, it becomes quite possible.
Will it really happen? After all, gold is only about $40 away from its short-term downside target. This might depend on the stock market.
In 2020 and 2008, mining stocks fell like stones in water because both gold and stocks were declining. If both gold and stocks decline, the mining stock bears will simply take no prisoners.
Therefore, the question is: what about the stock market?
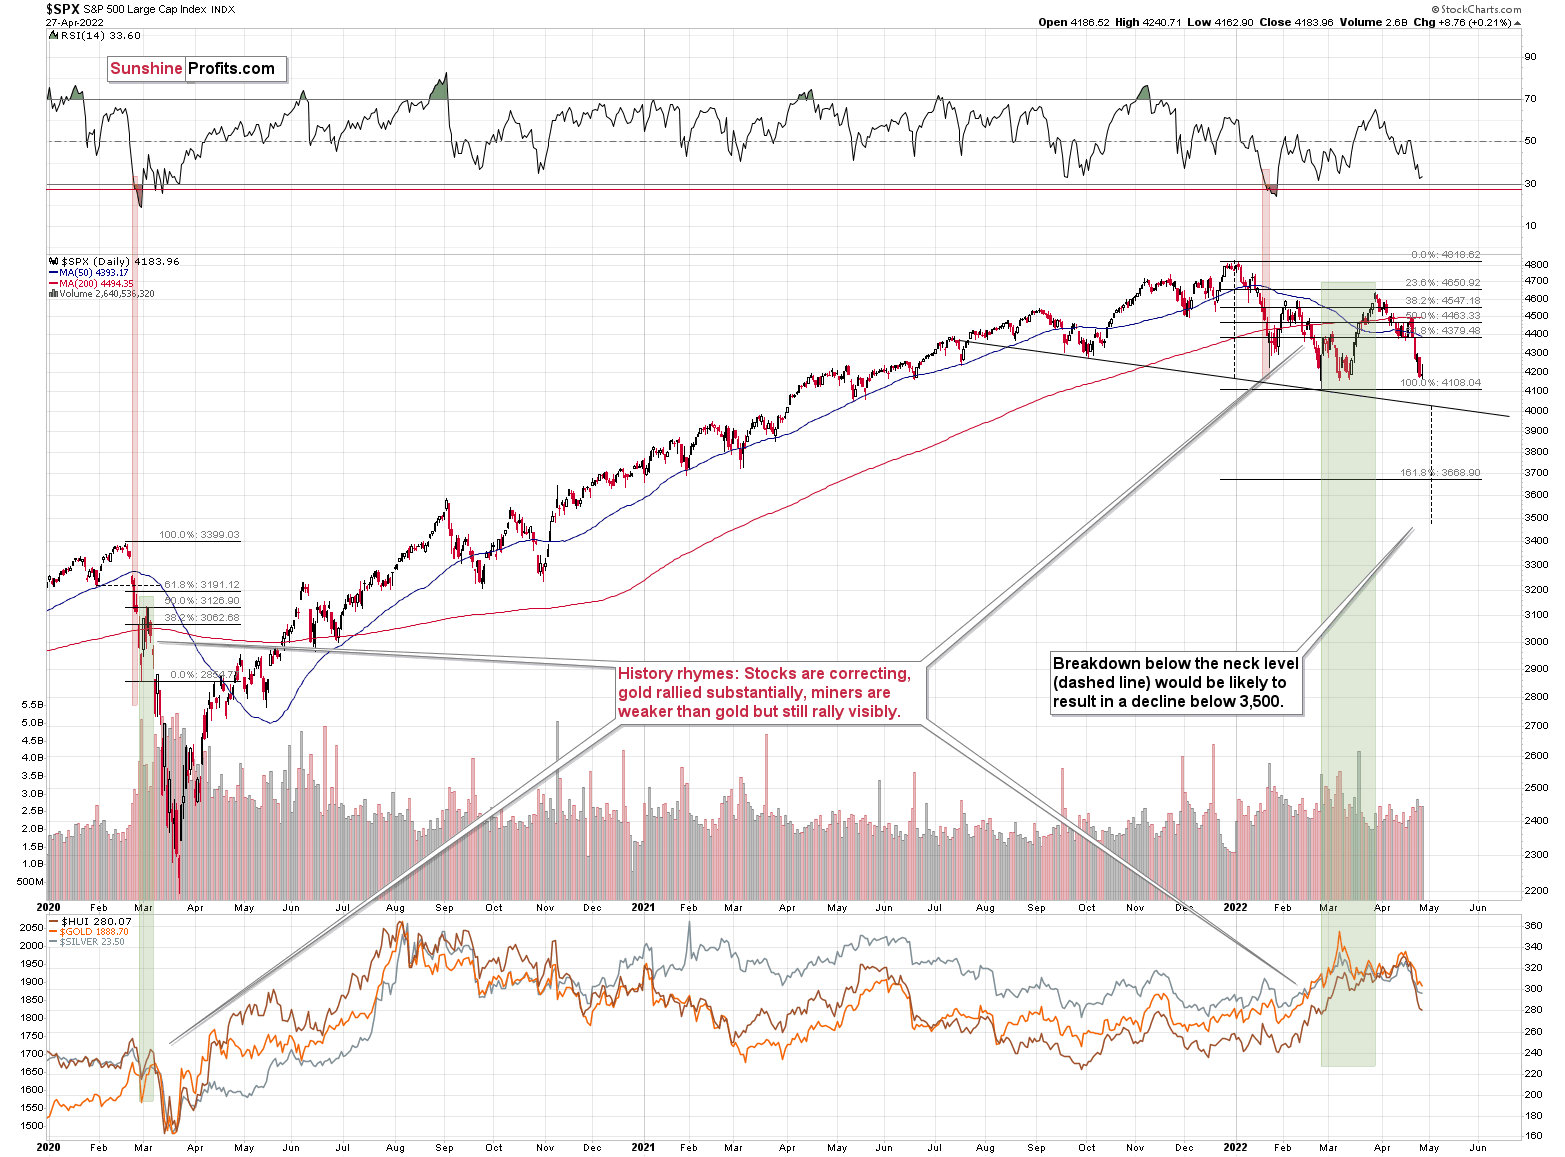
The general stock market moved back up yesterday (only a bit, but still), and the S&P 500 futures are up in today’s overnight trading as well.
In other words, stocks are either taking a breather or they are bottoming close to their previous lows. Which is more likely? Based on the financial tightness and how it’s growing all over the world, the “breather scenario” is more likely. The analogy to 2020 provides another confirmation.
If what we’re seeing right now is similar to what we saw then – and it is, but only to some extent – then we could see a move below the initial lows followed by a corrective upswing – a verification of the breakdown. That’s what we saw on March 9 and 10, 2020.
Since the current decline is taking much more time, what took just one day then (the March 9, 2020 decline), could take several days now. For instance… 4-5 days. This would be in perfect tune with what I wrote above about the triangle-vertex-based reversals and about the Fed’s decision.
So, will stocks and PMs (including miners) decline for the next 4 days or so and then launch a corrective upswing? That’s quite possible, but it’s not imminent. It would work differently, and I’ll keep my eyes open for clues and indications, and I’ll report to you if another scenario becomes more probable.
Meanwhile, silver didn’t do much yesterday, and my previous comments on it remain up-to-date:
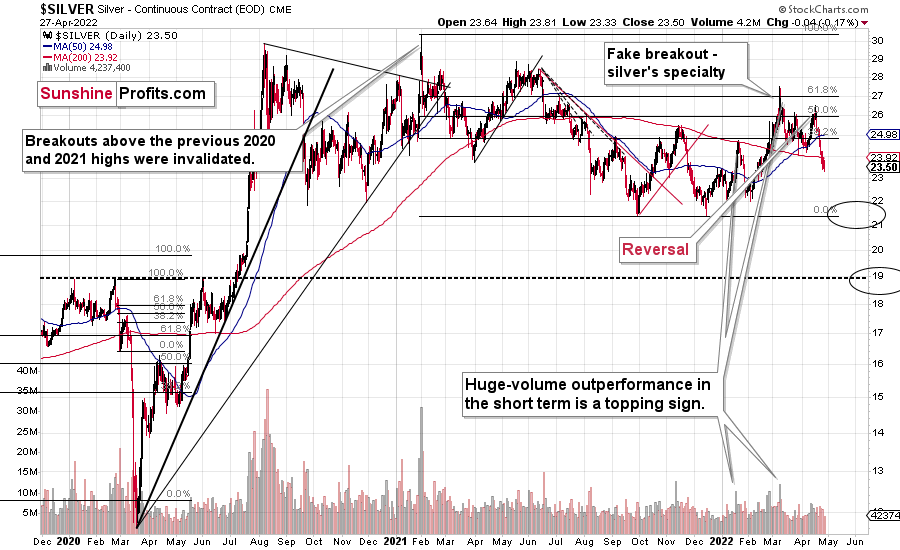
Silver declined profoundly recently, and just like miners, it invalidated multiple previous breakouts. Most interestingly, though, it now clearly invalidates the breakout above its January 2022 high.
The next strong support is based on the previous lows, close to the $22 level. That’s where silver might correct before moving much lower.
Provided that stocks continue to decline, silver and miners are likely to fall even more than gold.
Let’s keep in mind what happened in the previous cases when stocks declined profoundly – in early 2020 and in 2008. Miners and silver declined in a truly epic manner, and yes, the same is likely to take place in the following months, as markets wake up to the reality, which is that the USD Index and real interest rates are going up.
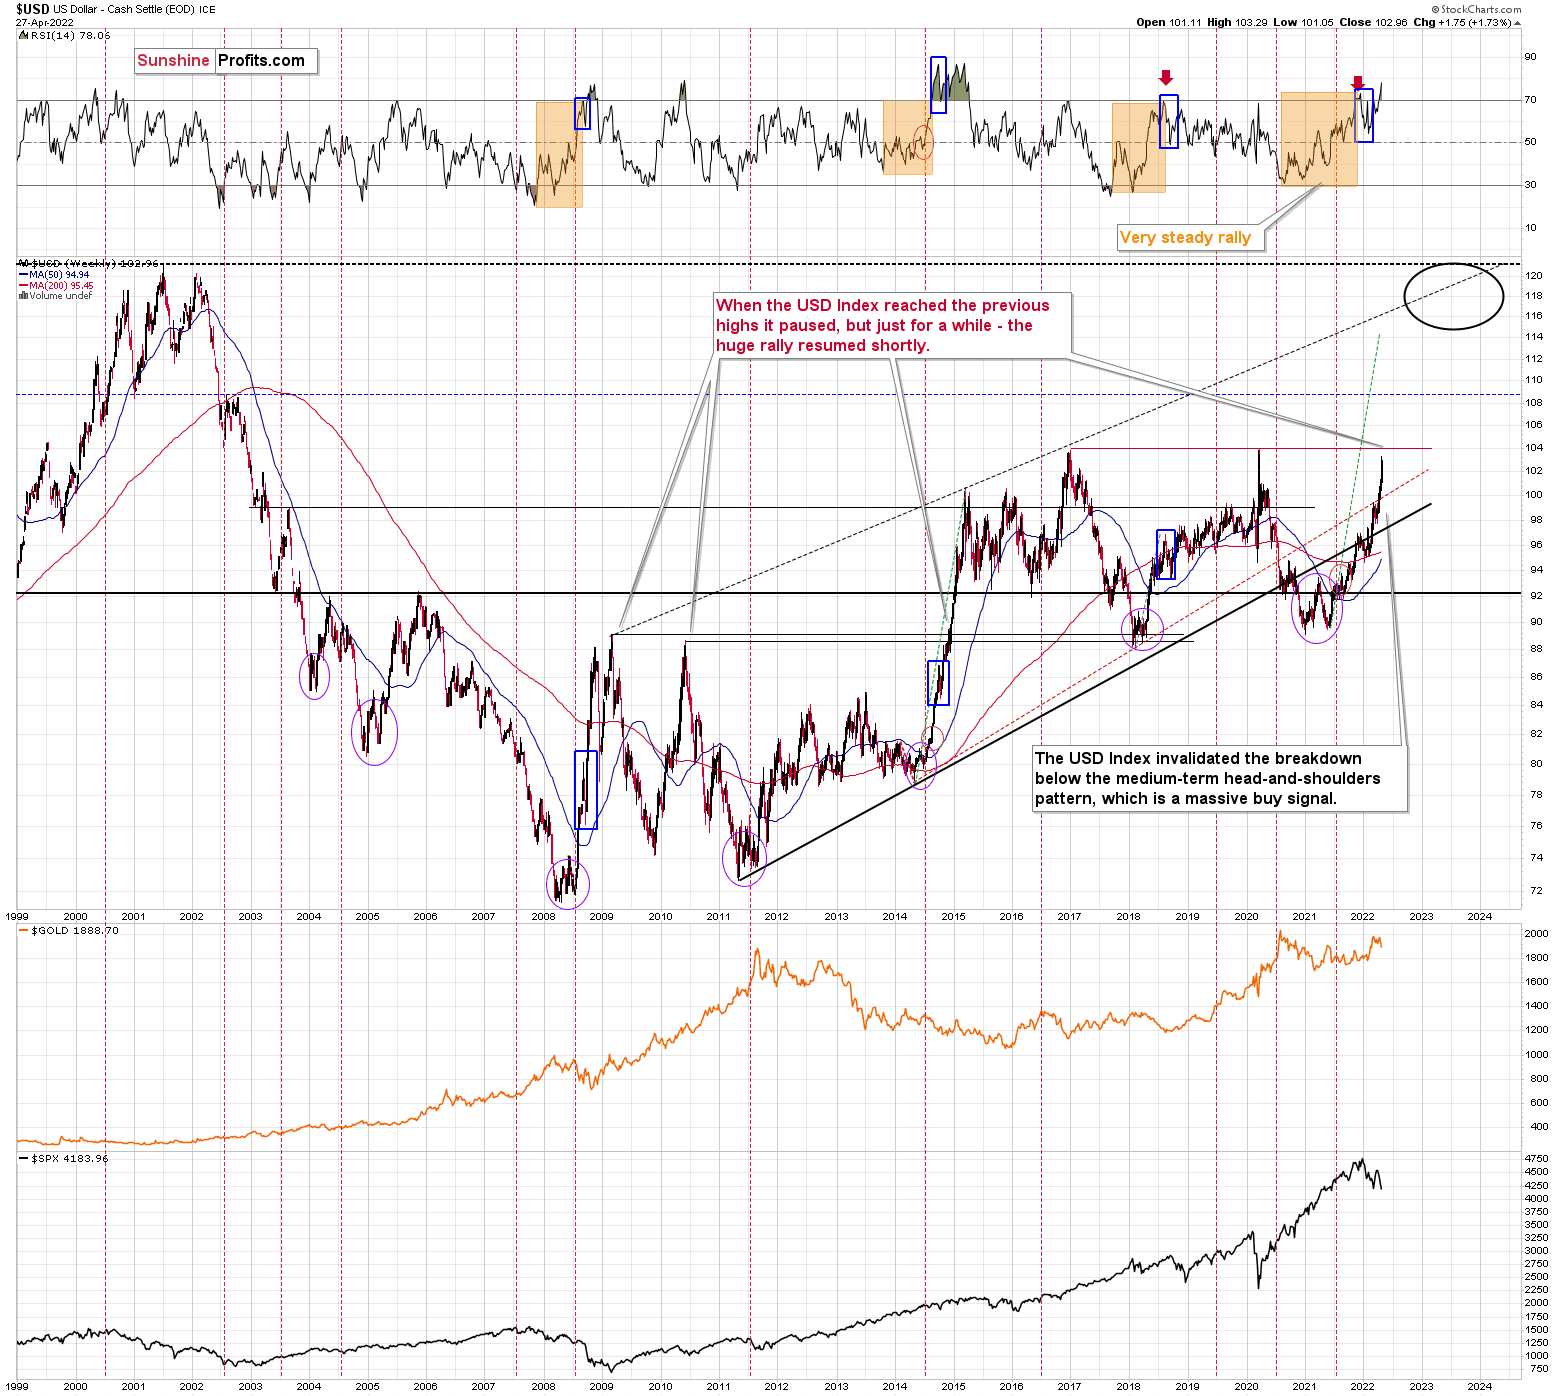
Speaking of the USD Index, after invalidating the breakout below the multi-year head-and-shoulders pattern, the USDX is poised to soar, just like I’ve been expecting it to do for more than a year.
The RSI is above 70, but since the USDX is in a medium-term rally and is already after a visible correction, it can rally further. Please note that we saw the same thing in 2008 and 2014. I marked the corrections with blue rectangles.
The next strong resistance is at the previous highs – close to the 104 level.
I previously wrote the following about this target:
It doesn’t mean that the USD Index’s rally is likely to end there. It’s not – but the USDX could take a breather when it reaches 104. Then, after many investors think that the top has been reached as the USDX corrects, the big rally is likely to continue.
The important detail here is that the consolidation close to the 104 level doesn’t have to be really significant (perhaps 1-2 index points of back-and-forth movement?) and it definitely doesn’t have to take long. The interest rates are going higher, and investors appear to have just woken up to this reality – it will take some time before everyone digests what’s going on. Before the late-reality-adopters join in, the USD Index could be trading much, much higher.
Back in 2014, when the USD Index approached its previous highs (close to 89), it consolidated so quickly that it’s almost not visible on the above chart – it took just a bit more than a week (from Dec. 8, 2014 – 89.56 to Dec. 16, 2014 – 87.83).
We could see something similar this time – and as the USD Index corrects for about a week, the same thing could take place in other markets as well: stocks and PMs. If junior miners were after a very sharp slide at that time, they would be likely to correct sharply as well.
I would like to add one important detail. Back in 2014, the USD Index didn’t correct after reaching its previous high. It corrected after moving above it. The higher of the highs was the March 2009 high, at 89.11.
The higher of the recent highs is at 103.96 right now, so if the analogy to 2014 is to remain intact, the USD Index could now top at close to 104.5 or even 105.
Consequently, there’s still room for an additional sizable short-term rally, even though the USD Index is trading at 103.12 at the moment of writing these words. Perhaps the USD Index will try to move above 104 within the next 4-5 sessions, triggering final short-term (!) declines in the stock market and in the precious metals market.
All in all, the technical picture for mining stocks is extremely bearish for the following months, even though we might see a short-term correction close to the beginning of May.
Do I plan to trade this correction? It depends on how likely it is and where the prices of gold, silver, and mining stocks are. If they are close to relatively strong support levels while gold and miners are at their reversal points, I might indeed temporarily get out of the short positions. Of course, I’ll keep you informed.
Having said that, let’s take a look at the markets from a more fundamental point of view.
When You Gain, the Fed Inflicts Pain
With the GDXJ ETF suffering a mild drawdown on Apr. 27, the recent rout has calmed for the time being. However, with the medium-term fundamental outlook remaining profoundly bearish, the junior miners and the S&P 500 are fighting a losing battle.
To explain, the Fed needs to lower asset prices to help calm inflation. Moreover, with the earnings season delivering some hit-and-miss results, market participants are dumping the losers and holding on to the winners for dear life. However, while investors rotate from one scarred corner of the stock market to another, the hiding places are shrinking. Therefore, when the walls close in, the only place left to go is down.
For example, Microsoft hit, Alphabet missed, and RBC Capital Markets analysts said that Microsoft’s “solid” fourth-quarter guidance “should allay investor fears of a macro slowdown.” As a result, the bull is alive and well.
Please see below:
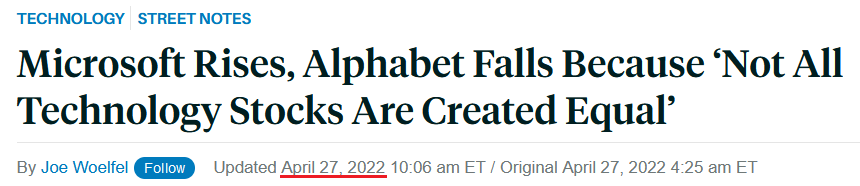 Source: Barrons
Missing the forest through the trees, investors fail to realize that some companies have succumbed to the medium-term realities sooner than others. For context, I’ve been bullish on the U.S. economy for some time, and I still am RIGHT NOW. However, with each Fed rate hike and each passing quarter, that will change materially, and so should investors’ optimism.
Please see below:
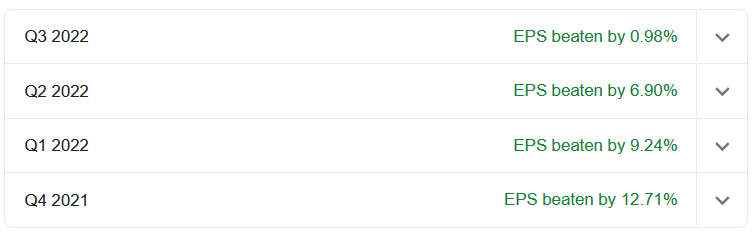 Source: Google Finance
To explain, the figures above represent Google Finance’s tally of how much Microsoft outperformed analysts’ earnings per share (EPS) estimates over the last four quarters. Notice the trend? After beating estimates by 12.71% in Q4 2021, Microsoft’s EPS outperformance declined sequentially to a slight 0.98% in Q3 2022. Moreover, its revenue outperformance showcased a similar pattern.
Furthermore, the decelerating trend is also present with Alphabet, only ahead of schedule. As a result, with the Fed poised to slow the U.S. economy to calm inflation, it’s only a matter of time before the stock market’s winners (Microsoft) turn into losers (Alphabet).
 Source: Google Finance
Speaking of winners, Visa reported its second-quarter earnings on Apr. 26. CEO Al Kelly said during the Q2 earnings call:
“After the short four to five-week impact of Omicron in December and January in the United States and many other parts of the world, the recovery continues to be robust…. In the U.S., payments volume index to 2019 was 144 in the quarter. Volume growth relative to three years ago has been stable and strong now for four quarters in a row.”
“When looking at specific spend categories for credit cards, we saw greater than a 10-percentage point improvement in the three-year index from Q1 to Q2 in travel, retail goods, food and drug, restaurant, QSR and fuel.”
As a result, while investors hope that a slowing U.S. economy will allow a dovish 180 by the Fed, Visa hasn’t seen any demand description.
Please see below:
 Source: Visa/The Motley Fool
Furthermore, with consumers eager to spend, companies are eager to raise prices. For example, Mondelez released its first-quarter earnings on Apr. 26. The company is home to confectionary brands like Oreo, Cadbury, Ritz and Toblerone. CFO Luca Zaramella said during the Q1 earnings call:
“We now expect input cost inflation in the low double-digit range for 2022 versus our prior view of approximately 8%, despite our coverage is approaching 90% for the year. The revise view of inflation reflects the war in the Ukraine and the related step-up in cost pressure to our commodity basket, including energy, wheat, oil and packaging.”
He added:
“We continue to expect pricing to be a larger driver of top line growth, given its impact in Q1 and we are also announcing price increases across a number of markets for the rest of the year tied to inflation.”
As a result, the Fed can’t wish its problems away, and these hawkish realities should spook investors over the next few months.
Please see below:
 Source: Mondelez/Seeking Alpha
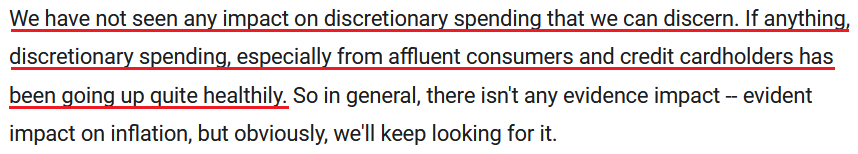
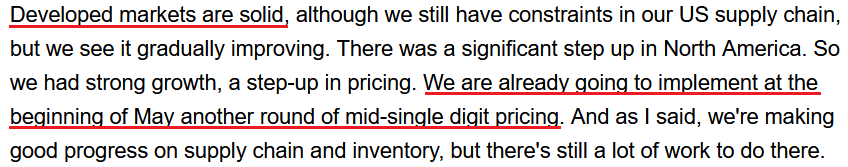
Singing a similar tune, PepsiCo released its first-quarter earnings on Apr. 26. CFO Hugh Johnston said during the Q1 earnings call:
“Inflation has clearly gotten a bit more challenging for the year. No question about that. We had previously indicated it was low teens. It’s several points higher than that now (…).”
“We think the consumer is very early in this process of adjusting to the new inflationary environment. I think there’s going to be new behaviors adapting to the new realities.”
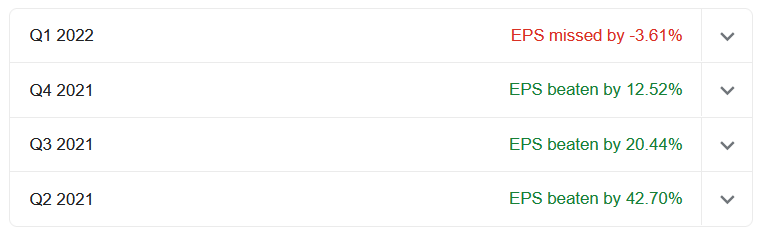
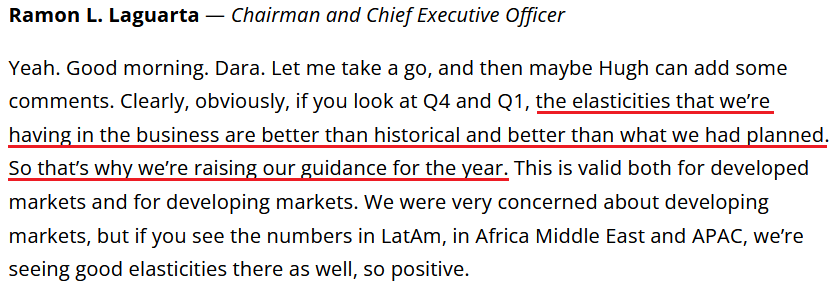
As such, while Johnston didn’t mention any specifics on pricing, “new realities” are not what the Fed had in mind. Moreover, CEO Ramon Laguarta raised PepsiCo’s full-year guidance and added that elasticities are still outperforming. Therefore, with inflation “several points higher” than previously expected, would you bet that PepsiCo isn’t riding the inflationary merry-go-round?
For context, positive elasticities mean that when PepsiCo increases prices, it’s not seeing a drop-off in demand.
Please see below:
 Source: PepsiCo/Alpha Street
Thus, while the U.S. economy remains on solid footing RIGHT NOW, the reality is that all of this data is bullish for Fed policy. With companies still raising prices and receiving little pushback from consumers, we're nowhere near the demand destruction needed to reduce annualized inflation from 8.6% to 2%. As such, the Fed will have to do the heavy lifting.
Moreover, while investors breathe a sigh of relief that corporate profits haven't collapsed, the optimism is short-sighted. Of course, a recession isn't upon us; the Fed has only hiked interest rates once. The damage occurs after the fourth, fifth, sixth, etc., rate hike, as higher interest rates eat away at consumers' disposable income and depress corporate profits. Therefore, the current environment is full of clear skies. However, if you want to get 8.6% annualized inflation down, everything else likely goes down with it.
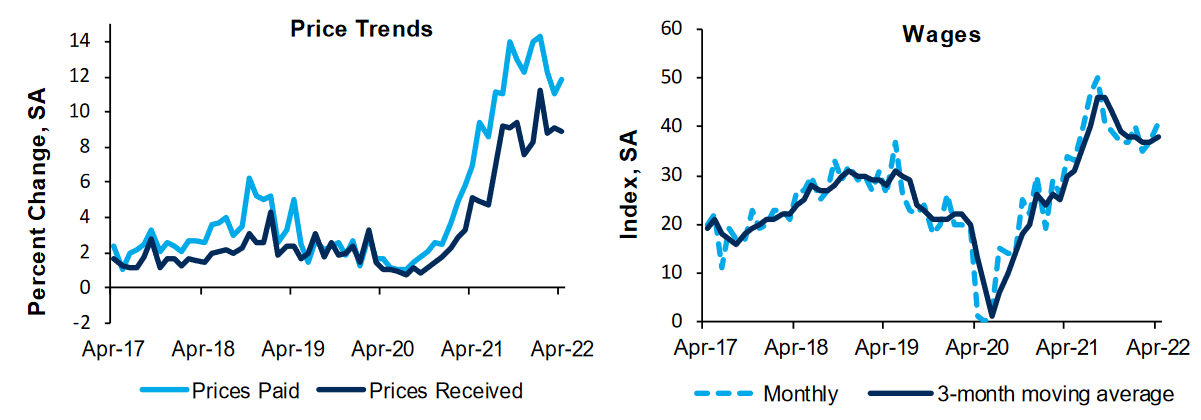
Also noteworthy, the Richmond Fed released its Fifth District Survey of Manufacturing Activity on Apr. 26. The data was largely bullish for Fed policy. The report revealed:
“Our wage index increased to 41 in April from 37, and firms don’t expect the increase in wages to let up. The average growth rate of prices paid increased slightly in April while the growth rate of prices received from customers edged down slightly. Firms expect growth rates for both prices paid and prices received to decrease somewhat in the next 12 months.”
Please see below:
 Source: Richmond Fed
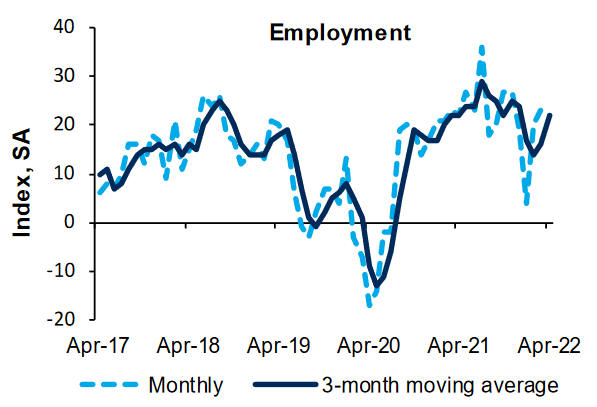
Likewise, with employment also moving higher, continued strength in the U.S. labor market is also bullish for Fed policy.
 Source: Richmond Fed
In addition, the Dallas Fed released its Texas Manufacturing Outlook Survey on Apr. 25. Showcasing similar results, the data is also supportive of Fed policy. An excerpt from the report read:
“Prices and wages continued to increase strongly in April, though the indexes eased off their historical highs. The raw materials prices index fell 13 points to 61.5, its lowest reading in more than a year, though still well above its average of 27.7. The finished goods prices index moved down from 47.8 to 43.5. The wages and benefits index came in at 50.9, down slightly from its high last month of 55.2 but still markedly elevated from its average reading of 20.1.”
Finally, the Dallas Fed released its Texas Service Sector Outlook Survey on Apr. 26. Similar to the other reports above, inflation increased, though at a slower pace in April. The report stated:
“April saw continued upward pressure on wages and prices, though growth in wages and input prices eased slightly. The wages and benefits index fell from 36.5 to 33.0, still near a record high. The selling prices index was unchanged at 33.7, with 37 percent of respondents noting monthly price increases, while the input prices index declined five points to 54.2.”
The bottom line? While investors are supposed to be forward-looking, they fail to realize that current earnings and guidance don’t reflect the impact of future rate hikes. Moreover, with the Fed on a mission to curb inflation, quarterly price increases and robust elasticities are not helping the situation. As a result, once this reality hits home, the PMs will suffer mightily as the negativity cascades across Wall Street.
In conclusion, the PMs declined on Apr. 27, as commodities have lost some of their mojo. Moreover, while technical conditions may present an opportunity for a short-term rally, both technicals and fundamentals signal lower lows over a medium-term time horizon. As such, long-term buying opportunities will likely present themselves later in 2022.
Overview of the Upcoming Part of the Decline
- It seems to me that the post-decline consolidation is now over or very close to being over , and that gold, silver, and mining stocks are now likely to continue their medium-term decline.
- It seems that the first ( bigger ) stop for gold will be close to its previous 2021 lows, slightly below $1,800 . Then it will likely correct a bit, but it’s unclear if I want to exit or reverse the current short position based on that – it depends on the number and the nature of the bullish indications that we get at that time.
- After the above-mentioned correction, we’re likely to see a powerful slide, perhaps close to the 2020 low ($1,450 - $1,500).
- If we see a situation where miners slide in a meaningful and volatile way while silver doesn’t (it just declines moderately), I plan to – once again – switch from short positions in miners to short positions in silver. At this time, it’s too early to say at what price levels this could take place, and if we get this kind of opportunity at all – perhaps with gold close to $1,600.
- I plan to exit all remaining short positions once gold shows substantial strength relative to the USD Index while the latter is still rallying. This may be the case with gold close to $1,350 - $1,400. I expect silver to fall the hardest in the final part of the move. This moment (when gold performs very strongly against the rallying USD and miners are strong relative to gold after its substantial decline) is likely to be the best entry point for long-term investments, in my view. This can also happen with gold close to $1,375, but at the moment it’s too early to say with certainty.
- As a confirmation for the above, I will use the (upcoming or perhaps we have already seen it?) top in the general stock market as the starting point for the three-month countdown. The reason is that after the 1929 top, gold miners declined for about three months after the general stock market started to slide. We also saw some confirmations of this theory based on the analogy to 2008. All in all, the precious metals sector is likely to bottom about three months after the general stock market tops.
- The above is based on the information available today, and it might change in the following days/weeks.
You will find my general overview of the outlook for gold on the chart below:
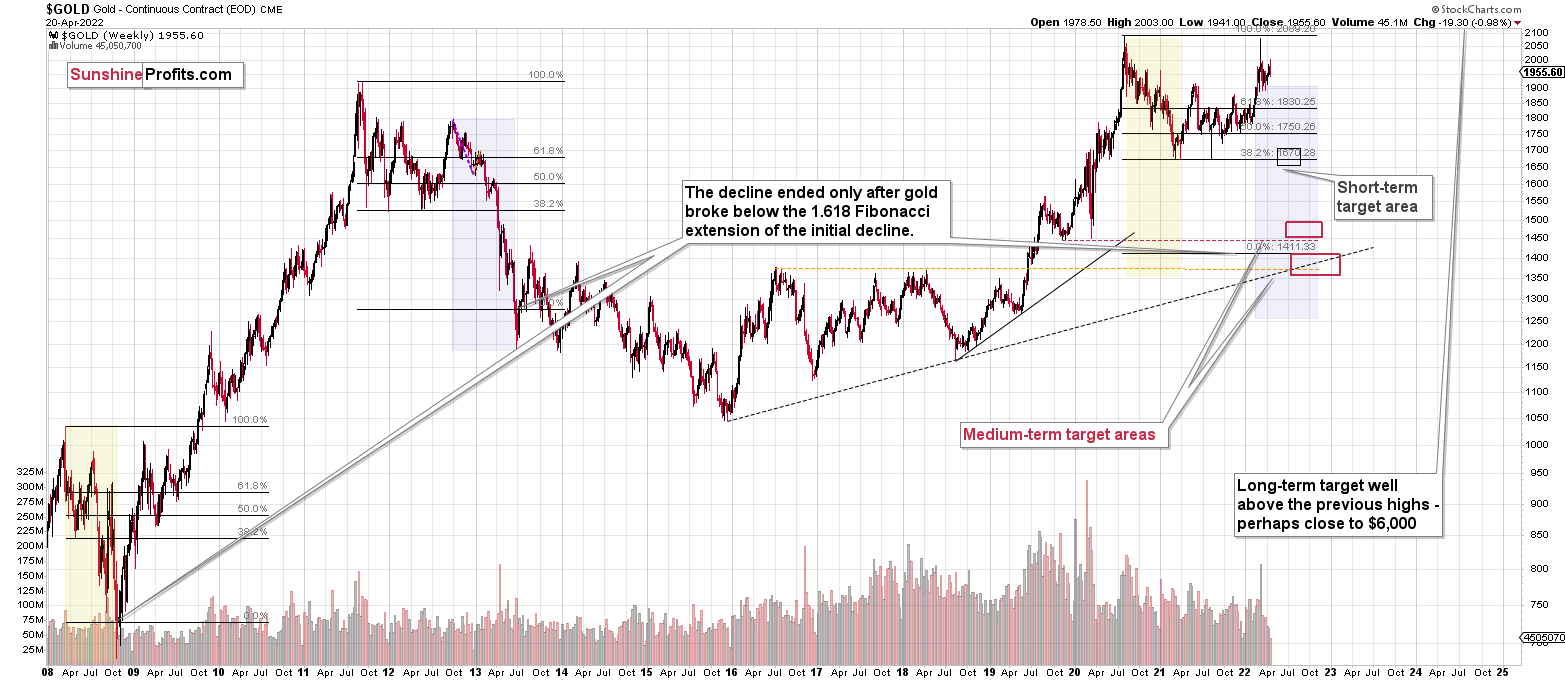
Please note that the above timing details are relatively broad and “for general overview only” – so that you know more or less what I think and how volatile I think the moves are likely to be – on an approximate basis. These time targets are not binding or clear enough for me to think that they should be used for purchasing options, warrants or similar instruments.
Summary
Summing up, as investors are starting to wake up to the reality, the precious metals sector (in particular junior mining stocks) are declining sharply. The key parts of the reality that the market participants have been ignoring are:
- rising real interest rates,
- rising USD Index values.
Both of the aforementioned are the two most important fundamental drivers of the gold price. Since neither the USD Index nor real interest rates are likely to stop rising anytime soon (especially now that inflation has become highly political), the gold price is likely to fall sooner or later. Given the analogy to 2012 in gold, silver, and mining stocks, “sooner” is the more likely outcome.
It seems that our profits from short positions are going to become truly epic in the coming months.
I recently adjusted the trading positions as I plan to temporarily (perhaps for just a week or so) switch from a short to long position IF we get a sharp decline in junior mining prices soon. In other words, if the short-term decline gets too excessive, it seems that it would be justified from the risk to reward perspective to very briefly (for probably no longer than a week) get out of the short position and enter a long one.
At this point, it seems likely that if juniors decline all the way down to their recent lows (about $37), then they would be likely to come back to more or less that current levels (about $43 in GDXJ)
Of course, the medium-term trend remains down, so if one wants to simply wait out the near-term corrections, it’s also fine. The upside potential for the inversely trading instruments is likely enormous, anyway.
After the final sell-off (that takes gold to about $1,350-$1,500), I expect the precious metals to rally significantly. The final part of the decline might take as little as 1-5 weeks, so it's important to stay alert to any changes.
As always, we'll keep you – our subscribers – informed.
To summarize:
Trading capital (supplementary part of the portfolio; our opinion): Full speculative short positions (300% of the full position) in junior mining stocks are justified from the risk to reward point of view with the following binding exit profit-take price levels:
Mining stocks (price levels for the GDXJ ETF): binding profit-take exit price: $37.52; stop-loss: none (the volatility is too big to justify a stop-loss order in case of this particular trade)
Alternatively, if one seeks leverage, we’re providing the binding profit-take levels for the JDST (2x leveraged) and GDXD (3x leveraged – which is not suggested for most traders/investors due to the significant leverage). The binding profit-take level for the JDST: $11.49; stop-loss for the JDST: none (the volatility is too big to justify a SL order in case of this particular trade); binding profit-take level for the GDXD: $15.68; stop-loss for the GDXD: none (the volatility is too big to justify a SL order in case of this particular trade).
For-your-information targets (our opinion; we continue to think that mining stocks are the preferred way of taking advantage of the upcoming price move, but if for whatever reason one wants / has to use silver or gold for this trade, we are providing the details anyway.):
Silver futures downside profit-take exit price: $21.63
SLV profit-take exit price: $20.14
ZSL profit-take exit price: $27.89
Gold futures downside profit-take exit price: $1,853
HGD.TO – alternative (Canadian) inverse 2x leveraged gold stocks ETF – the upside profit-take exit price: $7.68
HZD.TO – alternative (Canadian) inverse 2x leveraged silver ETF – the upside profit-take exit price: $21.47
Long-term capital (core part of the portfolio; our opinion): No positions (in other words: cash
Insurance capital (core part of the portfolio; our opinion): Full position
Whether you already subscribed or not, we encourage you to find out how to make the most of our alerts and read our replies to the most common alert-and-gold-trading-related-questions.
Please note that we describe the situation for the day that the alert is posted in the trading section. In other words, if we are writing about a speculative position, it means that it is up-to-date on the day it was posted. We are also featuring the initial target prices to decide whether keeping a position on a given day is in tune with your approach (some moves are too small for medium-term traders, and some might appear too big for day-traders).
Additionally, you might want to read why our stop-loss orders are usually relatively far from the current price.
Please note that a full position doesn't mean using all of the capital for a given trade. You will find details on our thoughts on gold portfolio structuring in the Key Insights section on our website.
As a reminder - "initial target price" means exactly that - an "initial" one. It's not a price level at which we suggest closing positions. If this becomes the case (like it did in the previous trade), we will refer to these levels as levels of exit orders (exactly as we've done previously). Stop-loss levels, however, are naturally not "initial", but something that, in our opinion, might be entered as an order.
Since it is impossible to synchronize target prices and stop-loss levels for all the ETFs and ETNs with the main markets that we provide these levels for (gold, silver and mining stocks - the GDX ETF), the stop-loss levels and target prices for other ETNs and ETF (among other: UGL, GLL, AGQ, ZSL, NUGT, DUST, JNUG, JDST) are provided as supplementary, and not as "final". This means that if a stop-loss or a target level is reached for any of the "additional instruments" (GLL for instance), but not for the "main instrument" (gold in this case), we will view positions in both gold and GLL as still open and the stop-loss for GLL would have to be moved lower. On the other hand, if gold moves to a stop-loss level but GLL doesn't, then we will view both positions (in gold and GLL) as closed. In other words, since it's not possible to be 100% certain that each related instrument moves to a given level when the underlying instrument does, we can't provide levels that would be binding. The levels that we do provide are our best estimate of the levels that will correspond to the levels in the underlying assets, but it will be the underlying assets that one will need to focus on regarding the signs pointing to closing a given position or keeping it open. We might adjust the levels in the "additional instruments" without adjusting the levels in the "main instruments", which will simply mean that we have improved our estimation of these levels, not that we changed our outlook on the markets. We are already working on a tool that would update these levels daily for the most popular ETFs, ETNs and individual mining stocks.
Our preferred ways to invest in and to trade gold along with the reasoning can be found in the how to buy gold section. Furthermore, our preferred ETFs and ETNs can be found in our Gold & Silver ETF Ranking.
As a reminder, Gold & Silver Trading Alerts are posted before or on each trading day (we usually post them before the opening bell, but we don't promise doing that each day). If there's anything urgent, we will send you an additional small alert before posting the main one.
Thank you.
Przemyslaw Radomski, CFA
Founder, Editor-in-chief

