

Briefly: In our opinion, full (150% of the regular full position) speculative short positions in gold, silver and mining stocks are justified from the risk/reward perspective.
Silver soared yesterday and the rest of the precious metals market moved higher as well. The way silver moved higher and the price level that it reached, however, tells us something about the likely future movement of the entire sector. Let’s take a look at the charts for details (charts courtesy of http://stockcharts.com).
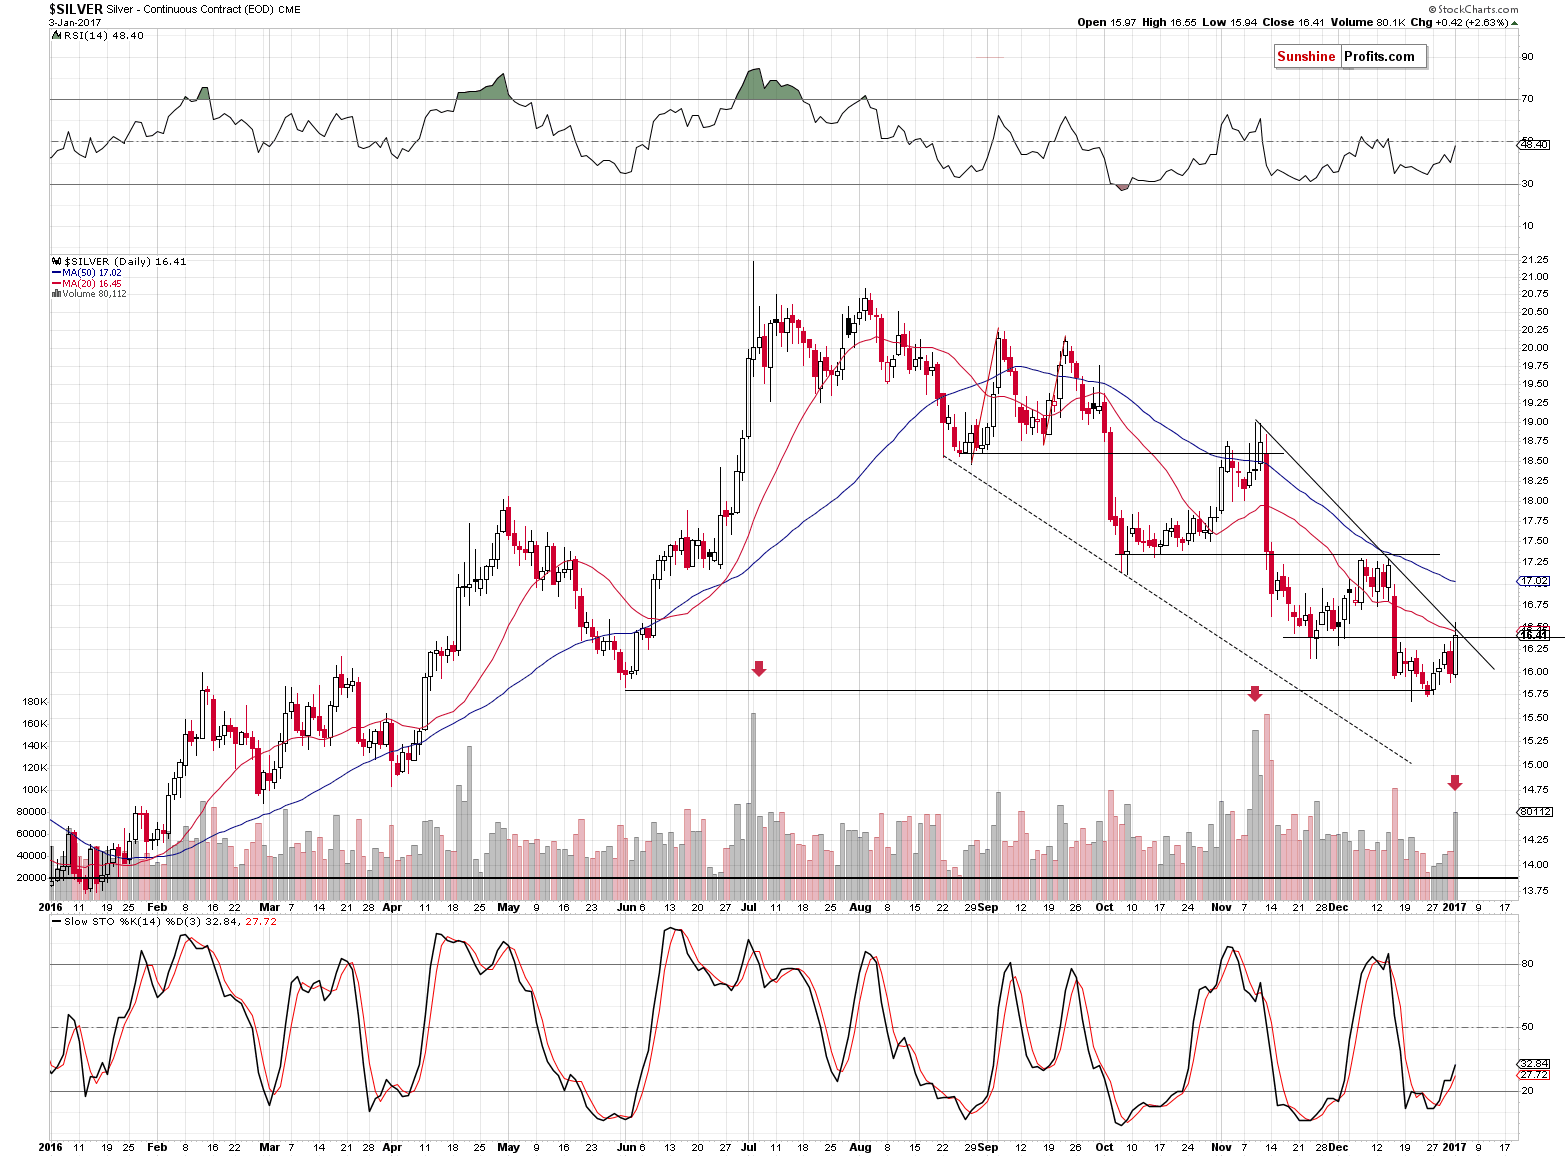
Silver moved to the declining resistance line based on the previous two tops and it moved a little above its 20-day moving average. The latter was seen before practically all important short-term tops after August 2016 – whenever silver moved above the 20-day MA and we saw a sizable daily rally, it meant that the rally was over or almost over.
We can say the same about the huge daily volume – the volume that we saw yesterday was huge and that’s also what accompanied two of the previous important tops.
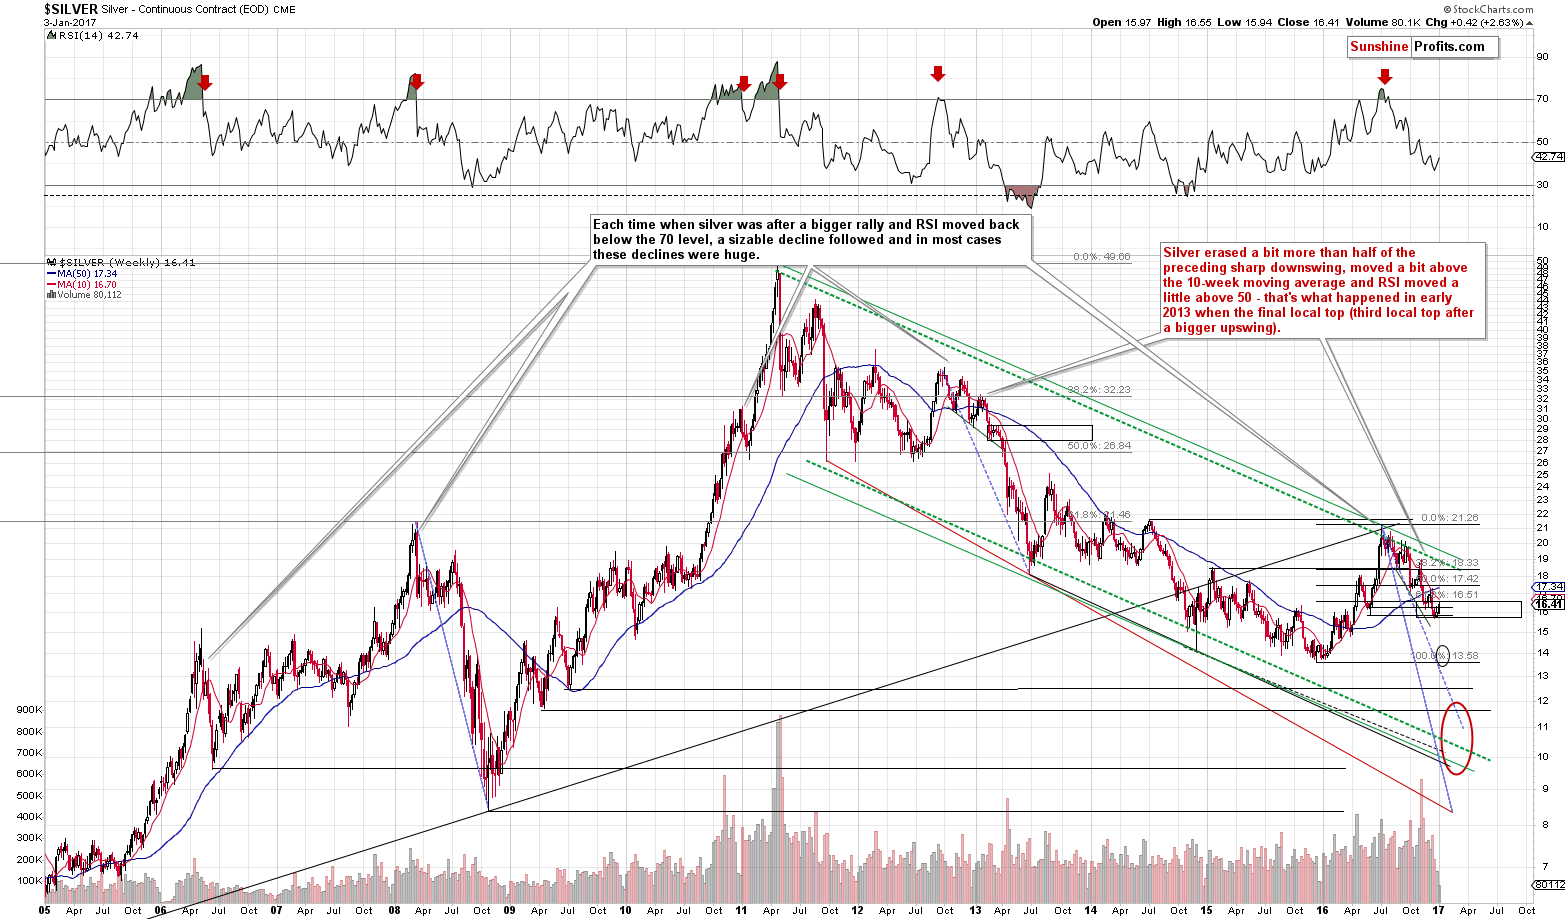
The bearish implications don’t end here – silver’s outperformance relative to gold is a bearish sign by itself and we can say the same about the price level that was reached in light of the analogy to the 2013 decline and the correction that we saw within it.
In other words, our previous comments on the $16.50 level as the target, remain up-to-date:
Silver’s chart has more implications that the one of gold. Let’s start with the possible (but not guaranteed, or even probable) short-term upside target. For silver it’s at about $16.50 – at its 61.8% Fibonacci retracement level (just like what we described for gold). In other words, it’s about $0.30 higher than the current price.
The above level is not only supported by the 61.8% Fibonacci retracement. It is also supported by the analogy to the 2013 decline (by the way, this analogy can be best seen on the above chart). We marked silver’s final consolidation before the big plunge with a black rectangle and we applied it to the current situation – it perfectly fits the target based on the 61.8% Fibonacci retracement.
Please note that the above target is based on the intra-day lows and intra-day highs and it could be imprecise (after all history doesn’t have to repeat itself to the letter, only more or less). So, the above could play out in a way that we will get silver 19 cents higher but only for a few seconds after which it plunges. The above is naturally not a prediction but an example of how risky a bet on a move to the 61.8% retracement would be.
Moreover, please note the alignment of the 10-week and 50-week moving averages. The red line moved below the blue one and the distance between them is increasing. During its final pause in 2013, silver didn’t reach the red line – instead it topped more or less after moving half of the distance between the bottom and the moving average. If the same happens also this time, it means that silver has either already topped today or that the top is only several cents away.
Also, please note that the value of the RSI indicator (and the shape of its decline) confirms that the analogy to the 2013 decline remains in place and we are indeed in the moment when silver is taking a breather for the final time before the big plunge. Based on the above, this doesn’t seem like a good moment to be waiting for additional confirmations before opening a short position (thus the one that we have appears to be well justified from the risk to reward point of view).
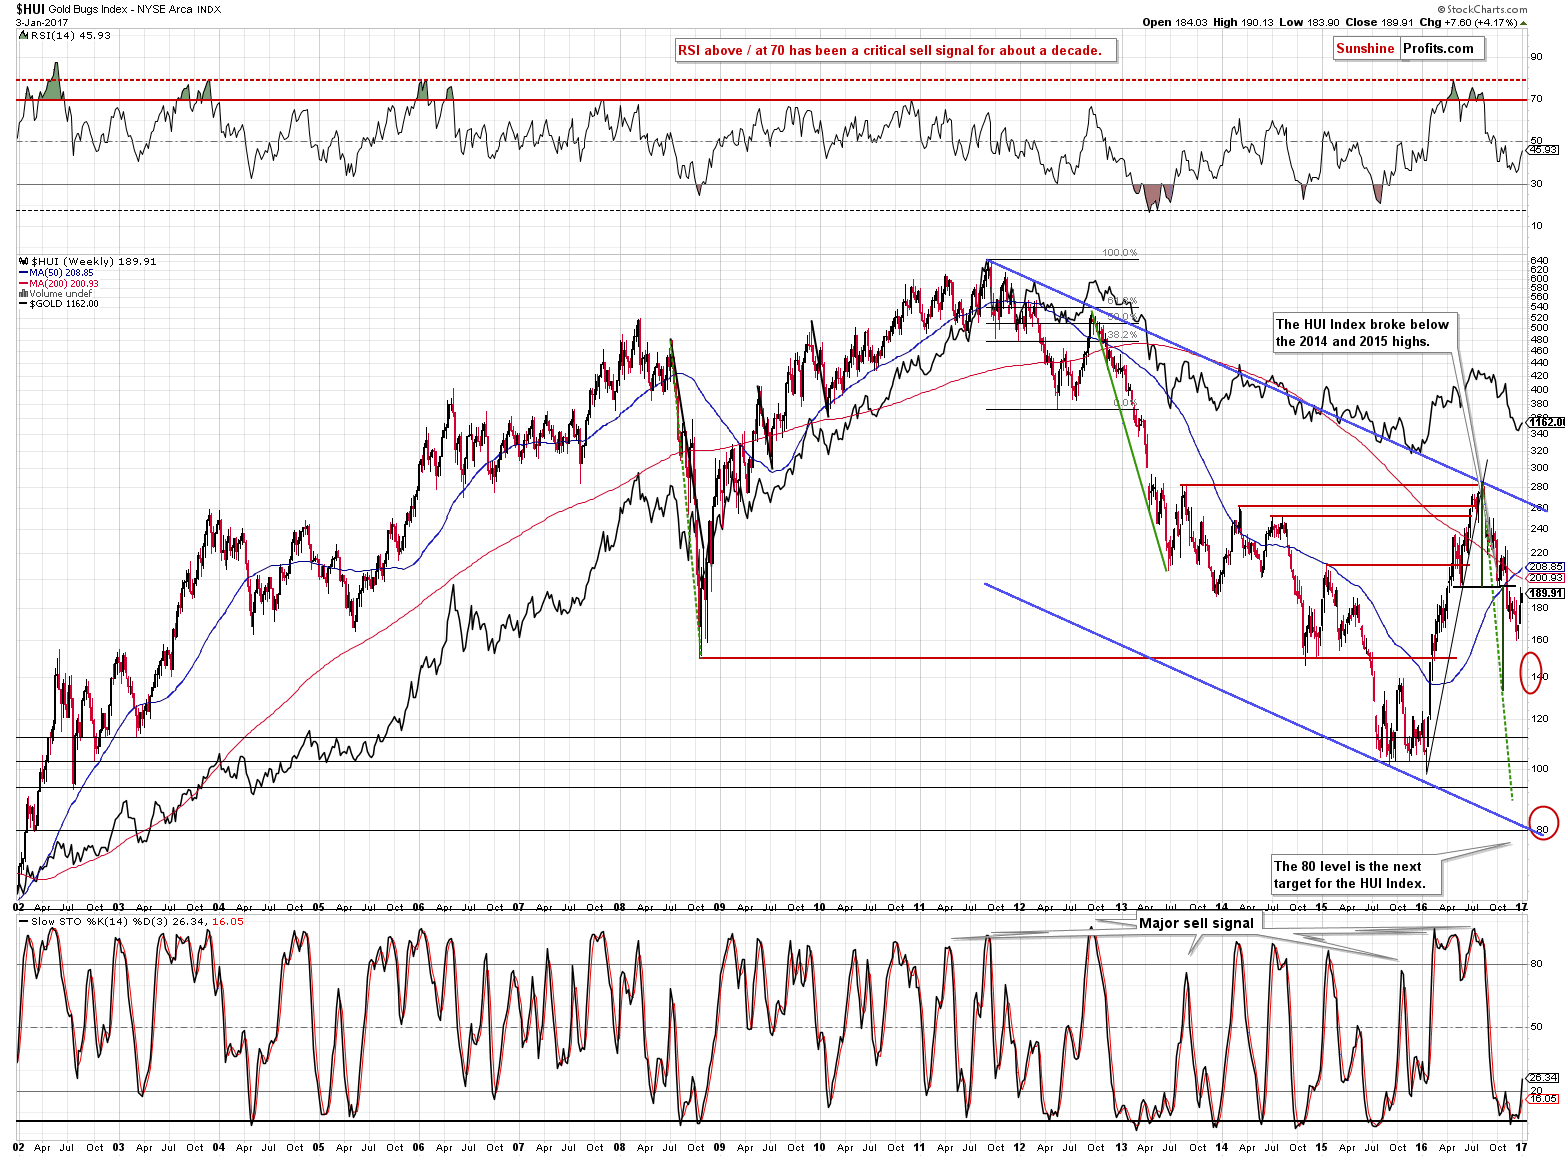
Our previous comments on the head and shoulders pattern in the HUI Index remain up-to-date as well:
The HUI Index (proxy for gold stocks) appears to be verifying the breakdown below the head-and-shoulders pattern that it completed earlier this year.
It seems that this verification was already completed. Let’s zoom in for more details.
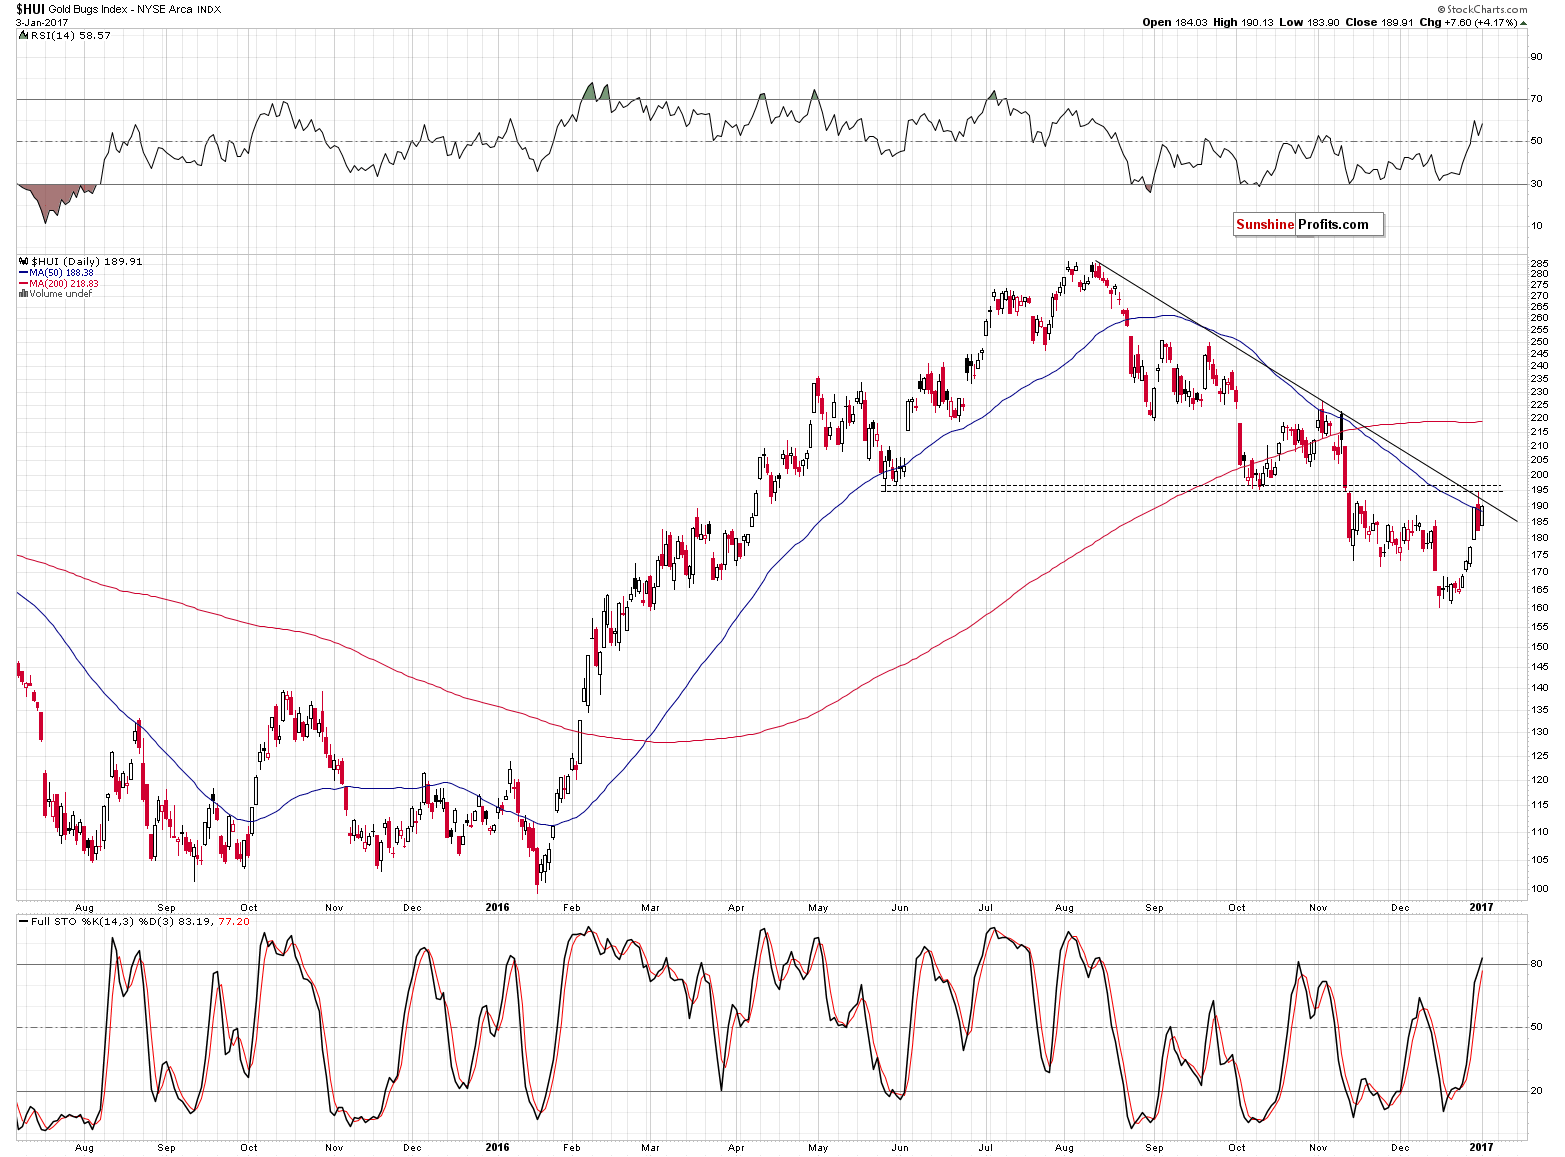
Gold stocks moved once again higher, but not above the declining resistance line or to the previous high. Please note that back in November 2016, the same happened after the final top – we saw a move back up before the decline really started. When it indeed started, the size of the move was significant enough to make the previous corrective upswing insignificant. The same is likely to be the case also this time.
Summing up, the outlook for the precious metals market remain bearish and silver’s strength seems to confirm it. In yesterday’s alert, we wrote that it could be the case that gold, silver and mining stocks would move a little higher before moving much lower and it indeed happened, however, it didn’t change the bearish outlook.
As always, we will keep you – our subscribers – updated.
To summarize:
Trading capital (supplementary part of the portfolio; our opinion): Short positions (150% of the full position) in gold, silver and mining stocks are justified from the risk/reward perspective with the following stop-loss orders and initial target price levels / profit-take orders:
- Gold: exit-profit-take level: $1,063; stop-loss: $1,183; initial target price for the DGLD ETN: $81.88; stop-loss for the DGLD ETN $58.77
- Silver: initial target price: $13.12; stop-loss: $17.53; initial target price for the DSLV ETN: $46.18; stop-loss for the DSLV ETN $24.86
- Mining stocks (price levels for the GDX ETF): initial target price: $9.34; stop-loss: $23.32; initial target price for the DUST ETF: $143.56; stop-loss for the DUST ETF $34.40
In case one wants to bet on junior mining stocks' prices (we do not suggest doing so – we think senior mining stocks are more predictable in the case of short-term trades – if one wants to do it anyway, we provide the details), here are the stop-loss details and initial target prices:
- GDXJ ETF: initial target price: $14.13; stop-loss: $37.12
- JDST ETF: initial target price: $104.26; stop-loss: $20.86
Long-term capital (core part of the portfolio; our opinion): No positions (in other words: cash)
Insurance capital (core part of the portfolio; our opinion): Full position
Please note that the in the trading section we describe the situation for the day that the alert is posted. In other words, it we are writing about a speculative position, it means that it is up-to-date on the day it was posted. We are also featuring the initial target prices, so that you can decide whether keeping a position on a given day is something that is in tune with your approach (some moves are too small for medium-term traders and some might appear too big for day-traders).
Plus, you might want to read why our stop-loss orders are usually relatively far from the current price.
Please note that a full position doesn’t mean using all of the capital for a given trade. You will find details on our thoughts on gold portfolio structuring in the Key Insights section on our website.
As a reminder – “initial target price” means exactly that – an “initial” one, it’s not a price level at which we suggest closing positions. If this becomes the case (like it did in the previous trade) we will refer to these levels as levels of exit orders (exactly as we’ve done previously). Stop-loss levels, however, are naturally not “initial”, but something that, in our opinion, might be entered as an order.
Since it is impossible to synchronize target prices and stop-loss levels for all the ETFs and ETNs with the main markets that we provide these levels for (gold, silver and mining stocks – the GDX ETF), the stop-loss levels and target prices for other ETNs and ETF (among other: UGLD, DGLD, USLV, DSLV, NUGT, DUST, JNUG, JDST) are provided as supplementary, and not as “final”. This means that if a stop-loss or a target level is reached for any of the “additional instruments” (DGLD for instance), but not for the “main instrument” (gold in this case), we will view positions in both gold and DGLD as still open and the stop-loss for DGLD would have to be moved lower. On the other hand, if gold moves to a stop-loss level but DGLD doesn’t, then we will view both positions (in gold and DGLD) as closed. In other words, since it’s not possible to be 100% certain that each related instrument moves to a given level when the underlying instrument does, we can’t provide levels that would be binding. The levels that we do provide are our best estimate of the levels that will correspond to the levels in the underlying assets, but it will be the underlying assets that one will need to focus on regarding the signs pointing to closing a given position or keeping it open. We might adjust the levels in the “additional instruments” without adjusting the levels in the “main instruments”, which will simply mean that we have improved our estimation of these levels, not that we changed our outlook on the markets. We are already working on a tool that would update these levels on a daily basis for the most popular ETFs, ETNs and individual mining stocks.
Our preferred ways to invest in and to trade gold along with the reasoning can be found in the how to buy gold section. Additionally, our preferred ETFs and ETNs can be found in our Gold & Silver ETF Ranking.
As always, we'll keep you - our subscribers - updated should our views on the market change. We will continue to send out Gold & Silver Trading Alerts on each trading day and we will send additional Alerts whenever appropriate.
The trading position presented above is the netted version of positions based on subjective signals (opinion) from your Editor, and the Tools and Indicators.
As a reminder, Gold & Silver Trading Alerts are posted before or on each trading day (we usually post them before the opening bell, but we don't promise doing that each day). If there's anything urgent, we will send you an additional small alert before posting the main one.
=====
Latest Free Trading Alerts:
The gold-to-copper ratio has declined recently. What does it mean for the gold market?
=====
Hand-picked precious-metals-related links:
Investors in ETFs to Hedge Funds Bail on Gold as Equities Rally
PRECIOUS-Gold hits near 4-week high as dollar retreats, demand surges
Infographic: Gold ETF Mechanics
=====
In other news:
Dollar edges down from 14-year high as euro gets data boost
Eurozone Inflation Hits Fastest Pace in More Than 3 Years
Japan must respond firmly to excessive currency moves: government spokesman
U.S. banks gear up to fight Dodd-Frank Act's Volcker rule
No One Questioned This Hedge Fund’s Madoff-Like Returns
UK credit binge approaching levels not seen since 2008 crash
Brexit bedlam? Key negotiator’s resignation fuels fears that UK is not ready to quit Europe
The Year Ahead: Where to Invest in 2017
=====
Thank you.
Sincerely,
Przemyslaw Radomski, CFA
Founder, Editor-in-chief, Gold & Silver Fund Manager
Gold & Silver Trading Alerts
Forex Trading Alerts
Oil Investment Updates
Oil Trading Alerts

