

Briefly: In our opinion, no speculative positions in gold, silver and mining stocks are justified from the risk/reward perspective.
Gold, silver and mining stocks moved higher last week – gold rallied over $30, while silver moved higher by almost $1. Should we expect this trend to continue?
Assuming that the trend is down, then yes, a continuation of the trend is likely. As far as last week’s rallies are concerned, it seems that they could be already over, but there are not enough bearish confirmations to justify opening short positions just yet.
Let’s take a look at the charts (charts courtesy of http://stockcharts.com).
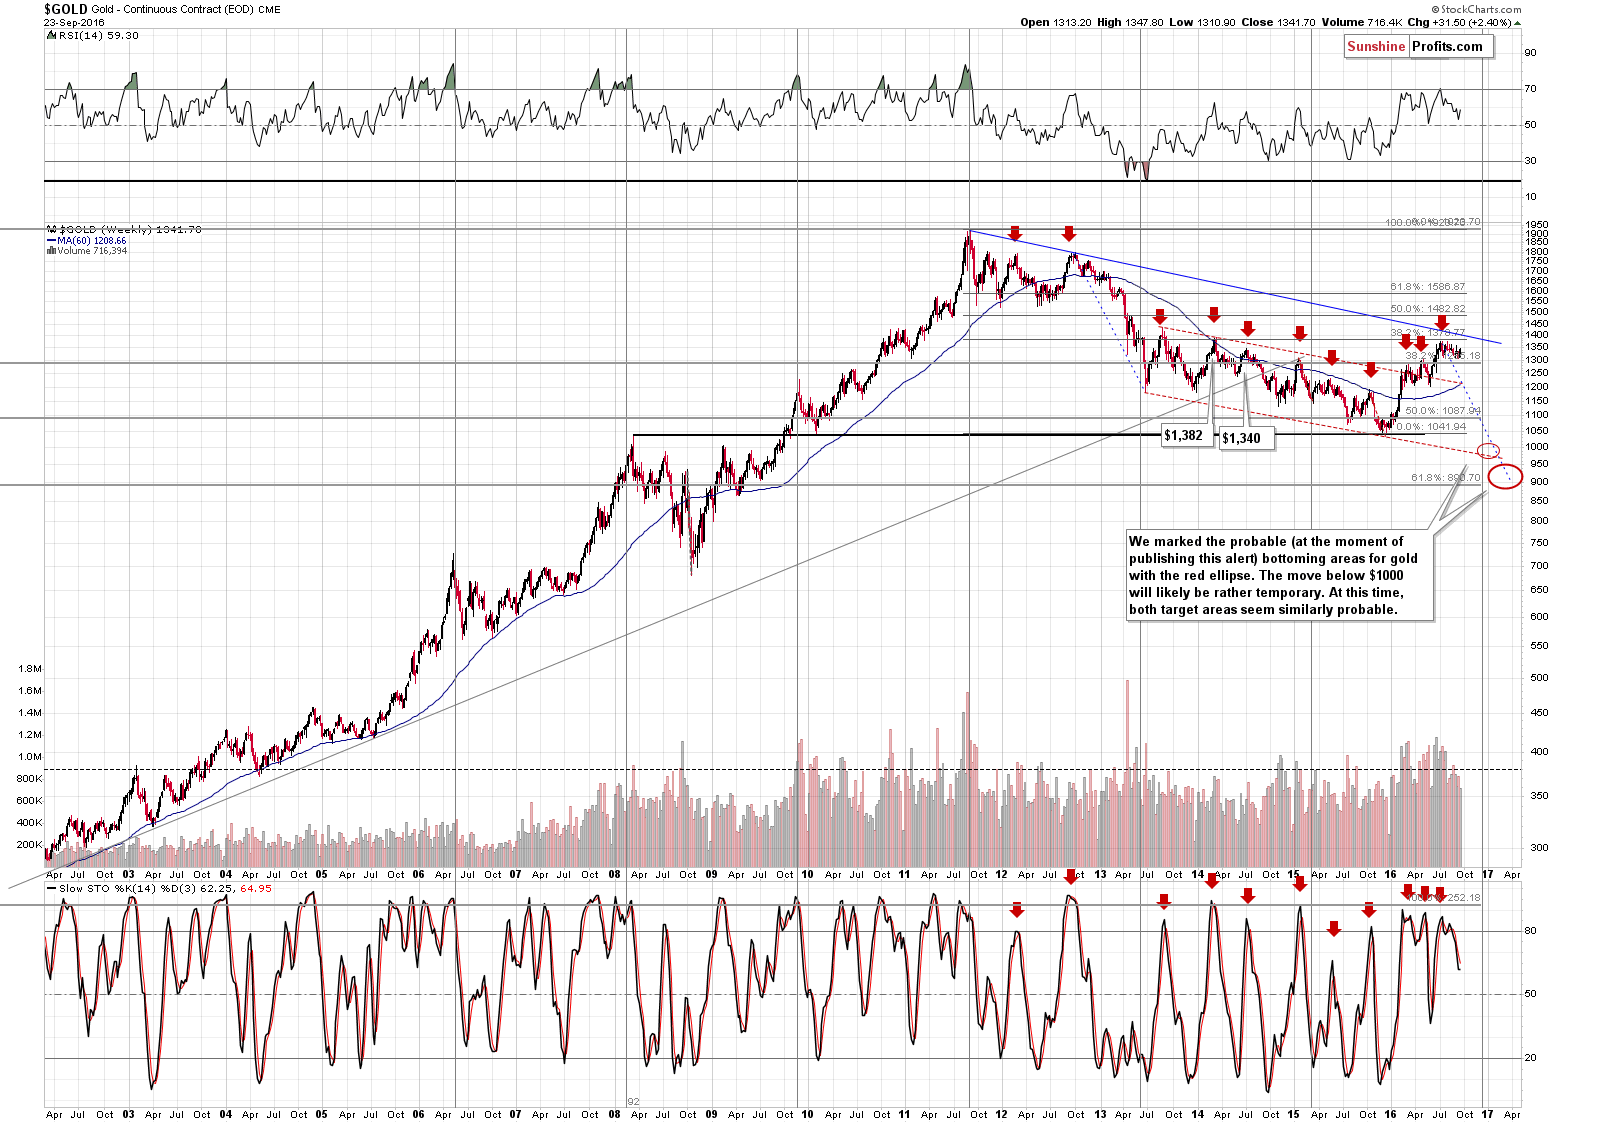
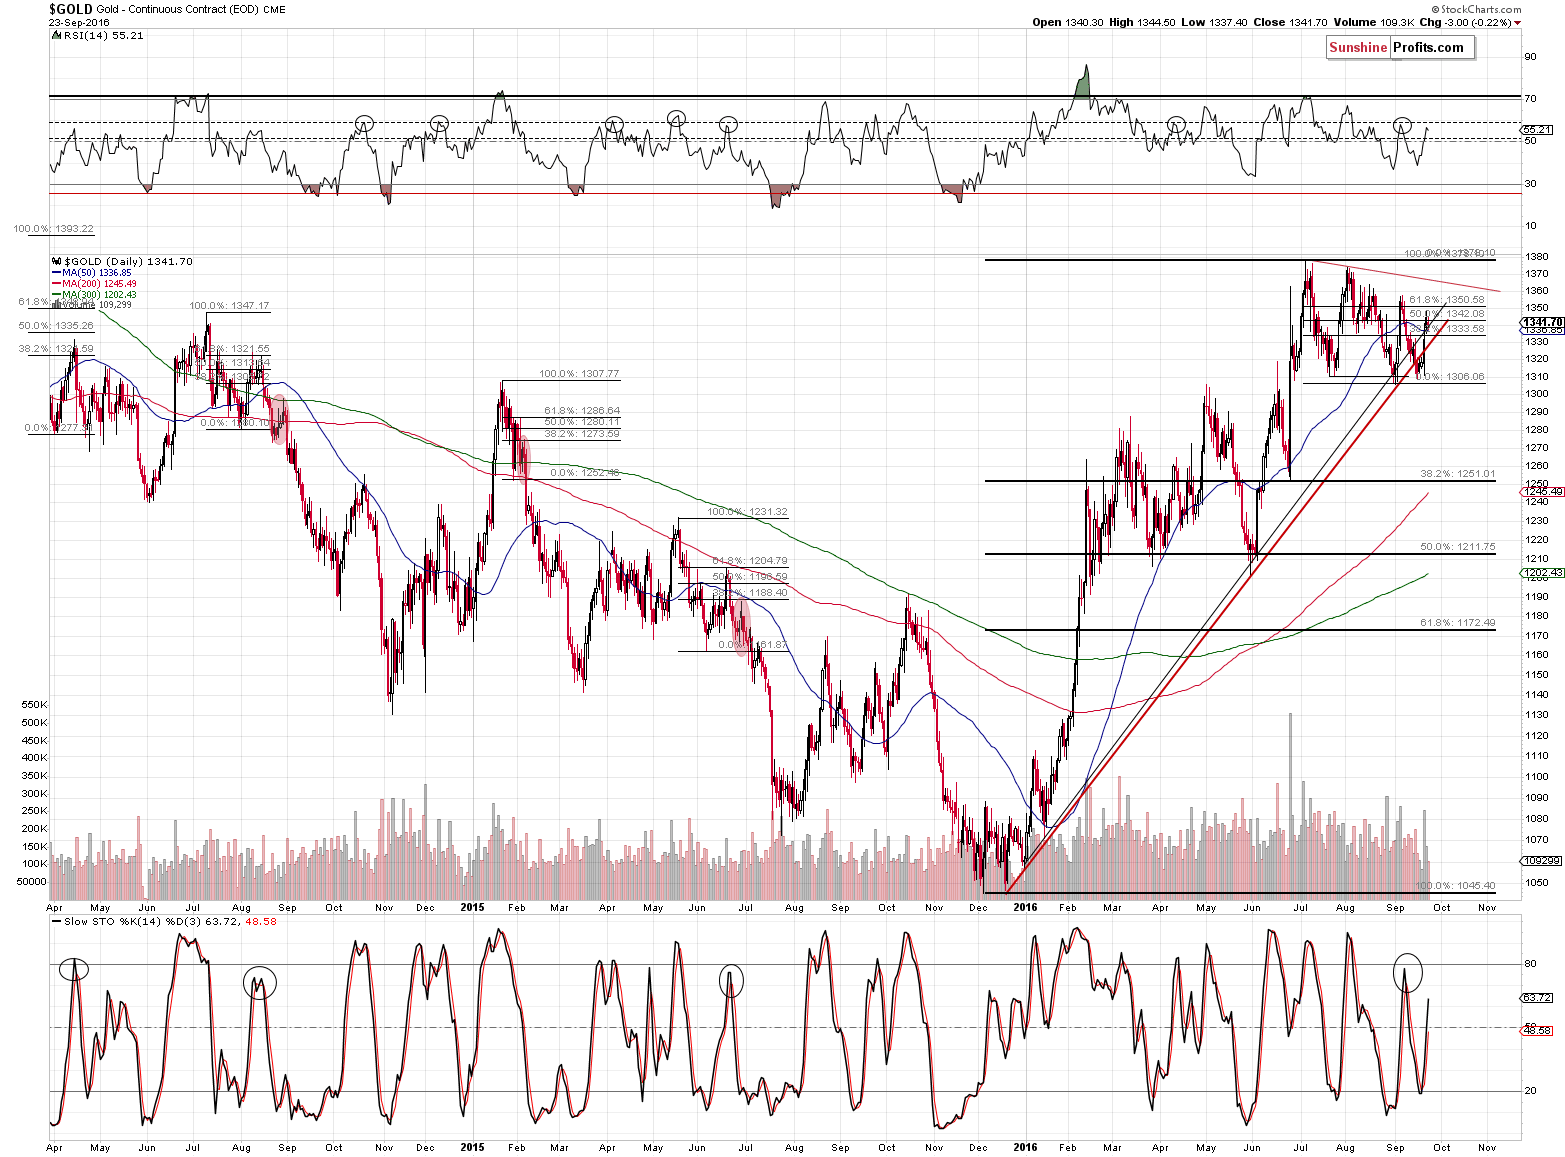
From the long-term point of view, not much changed despite a $30 rally. Gold is still consolidating and it’s quite likely to move much lower as this year’s entire rally was simply a correction to the 38.2% Fibonacci retracement level (based on the 2011 – 2015 decline).
Please note that gold’s weekly rally took place on relatively low volume, which is a bearish sign for the following weeks.
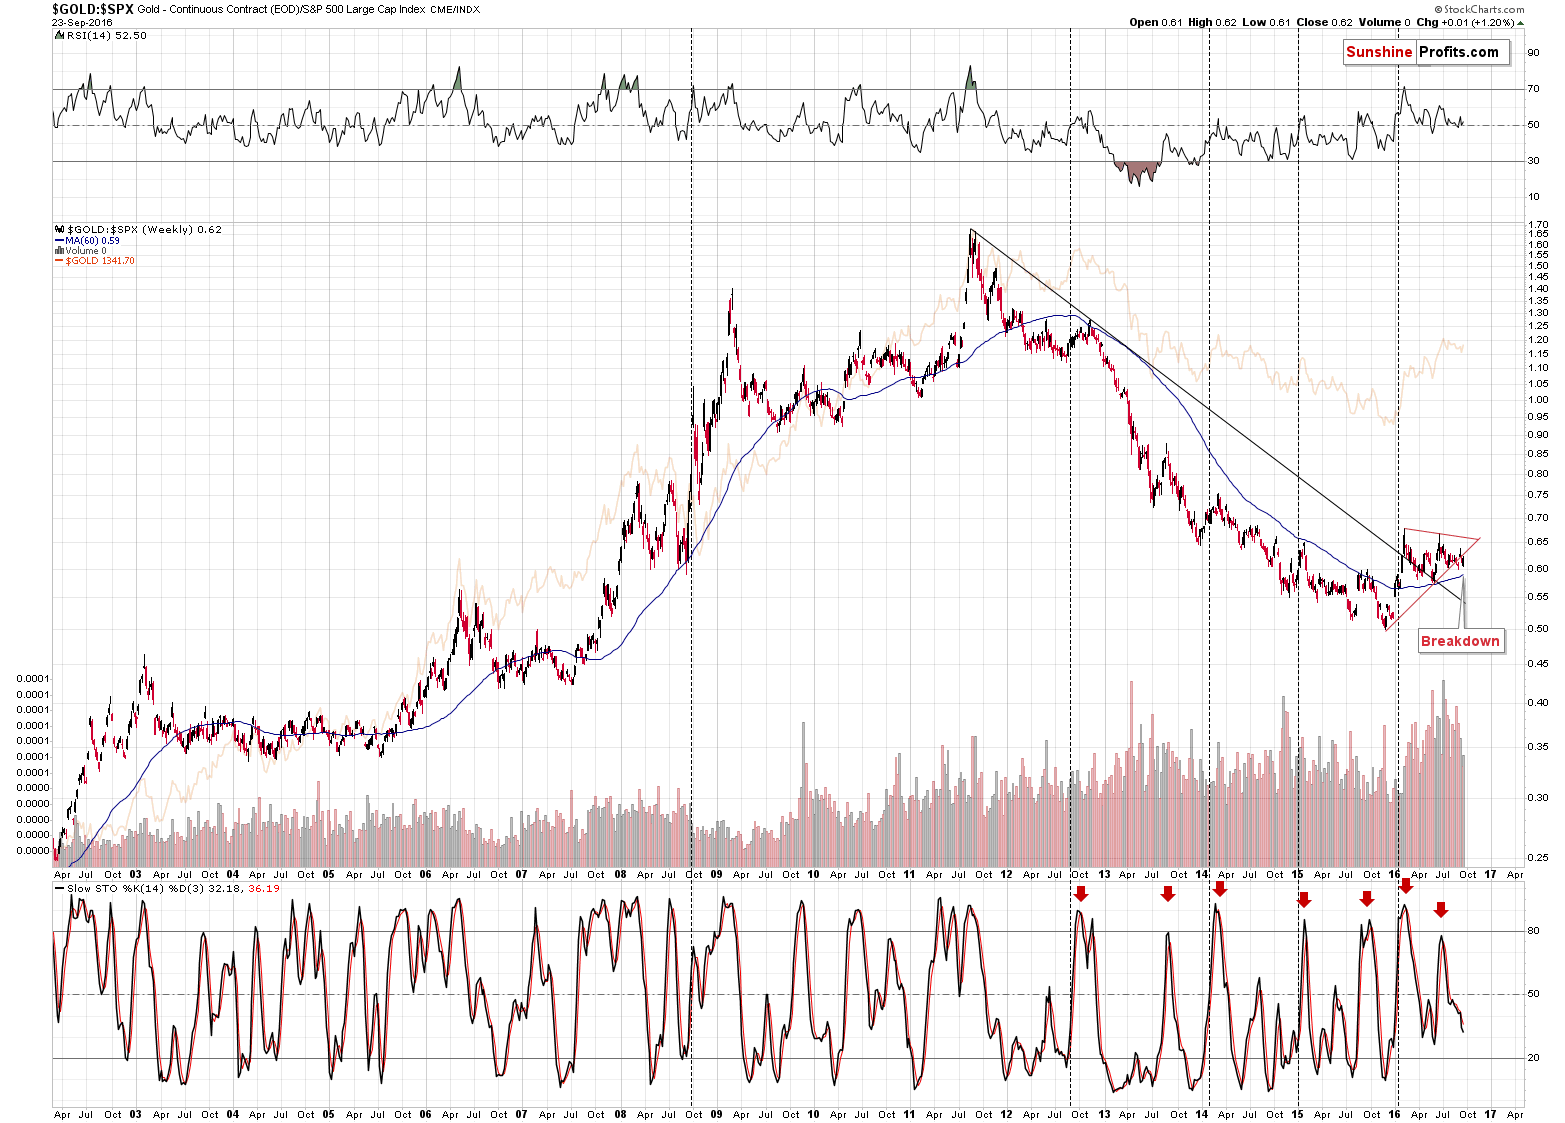
Comparing gold prices to stock prices shows that gold is already after a medium-term breakdown and the implications are bearish for the following weeks.
Before moving on to silver, we would like to once again move back to gold’s long-term chart to reply to a question that we just received. The question is if it is a meaningful long-term buy signal when gold’s 24-week moving average moves above the 104-week moving average.
Even before looking at the chart, it seems quite doubtful that this particular set of moving averages would be effective as it appears rather artificial (24 and 104). The thing is that if a dataset is “tortured” long enough, it will confess to anything. So, if one keeps searching for the “optimal” version of the moving averages (or any other variable), they will ultimately find it, but it doesn’t mean that it is really the best one. Similarly, (as Nassim Taleb described in his Fooled by Randomness book) if you have an infinite number of monkeys with typewrites pressing the buttons, you will ultimately find a monkey (among many billions of other monkeys) that was able to write the exact copy of Homer’s Iliad. Would that make it likely to expect that this exact monkey will write Homer’s Odyssey next? No. There are techniques that can greatly increase the chance of obtaining the optimal values for moving averages and other variables (such as indicator parameters), but most traders and analysts are not aware of them and are not applying them. Consequently, we are always suspicious when presented with a “special”, non-standard number in case of moving averages or indicators.
The second thing that the above resembles is the myth of supposedly bullish implications of the golden cross in gold and the bearish implications of the death cross in gold. You will find details under the above links (alternatively, search for these terms in our Dictionary section), but to make a long story short, they don’t work as they are supposed to and as it is commonly believed.
Still, let’s take a look at the chart.
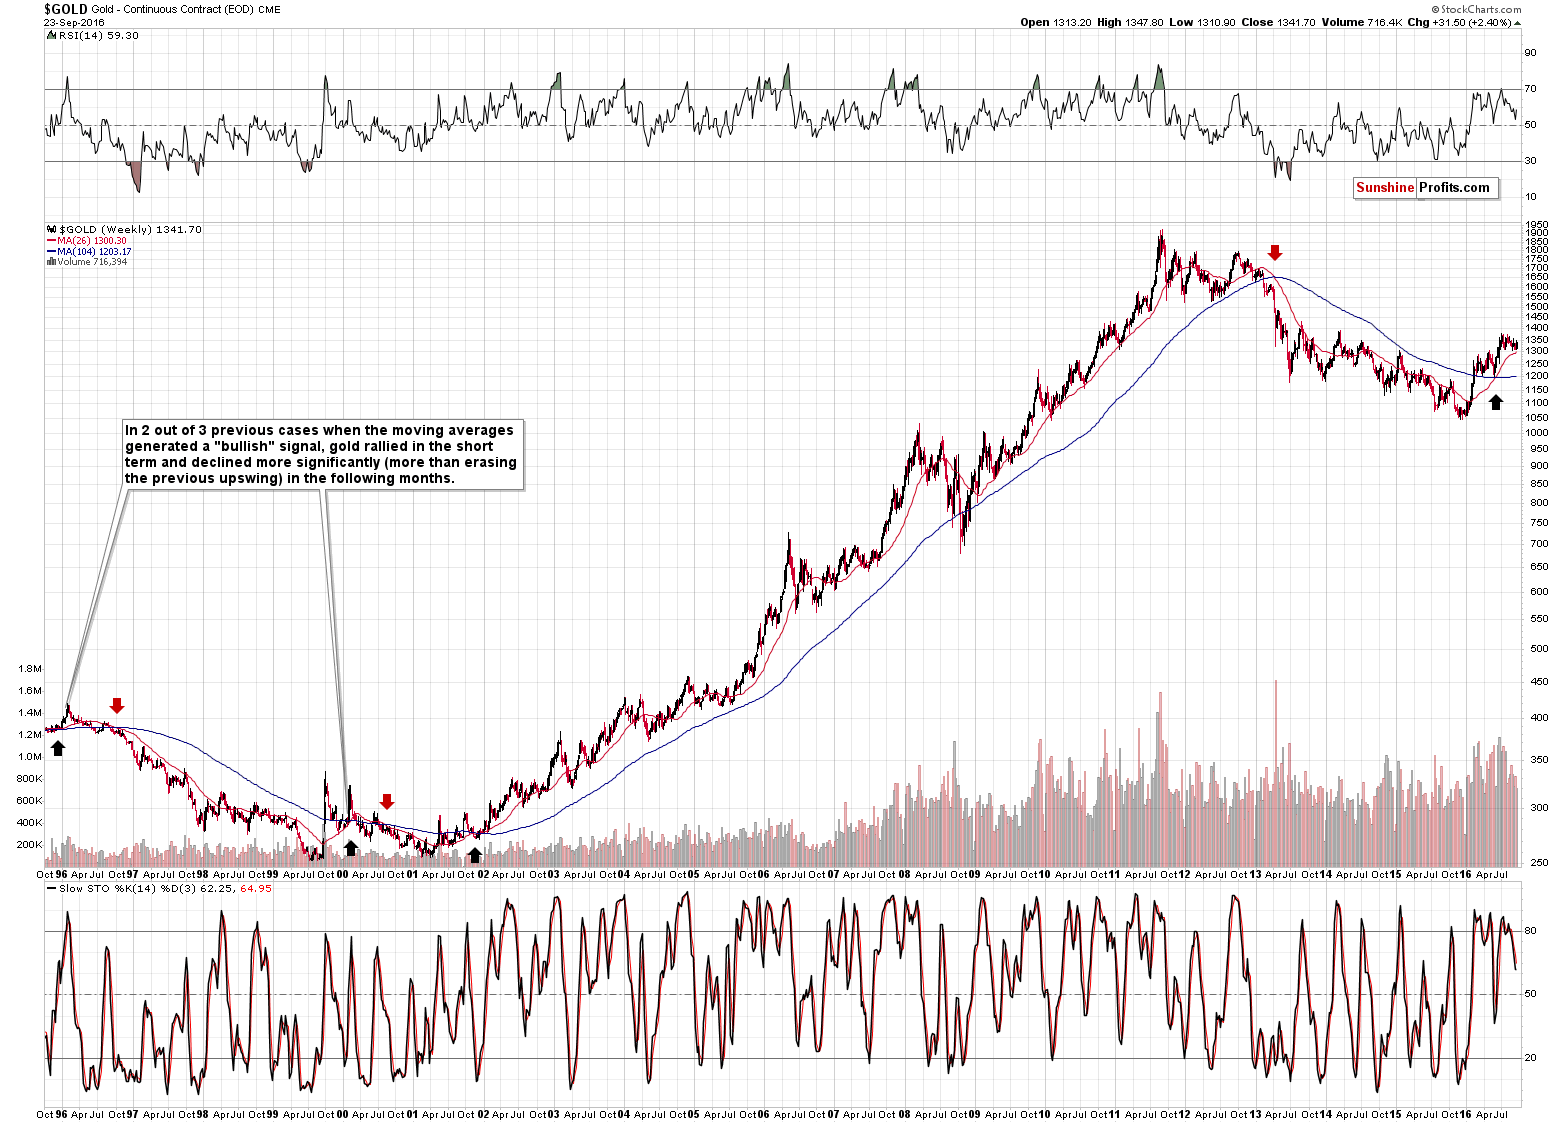
The “buy signal” is theoretically seen when the shorter moving average moves above the longer-term one. We saw 3 such cases in the past decades. One in late 1995, one in early 2000 and one in late 2001. In 2 out of 3 cases, we saw the following: gold rallied initially, then erased the entire rally and kept on declining for months. In the first case, gold moved below the previous lows (and moved to the final low of the bear market) and in the second case, gold moved very close to the previous bottom.
After the third time, gold rallied.
What happened after this signal this year? Gold rallied on a short-term basis, just like what happened in all 3 previous cases. However, in most previous cases, such a rally was followed by even bigger declines, so the implications are somewhat bearish, not bullish. Why only somewhat? Because we have only 3 previous cases – it could simply be a more or less random kind of link, and it seems that we should focus on other signals and use the above only as a small confirmation of the bearish scenario. However, if we insist on implying something from it, the implications should not be bullish.
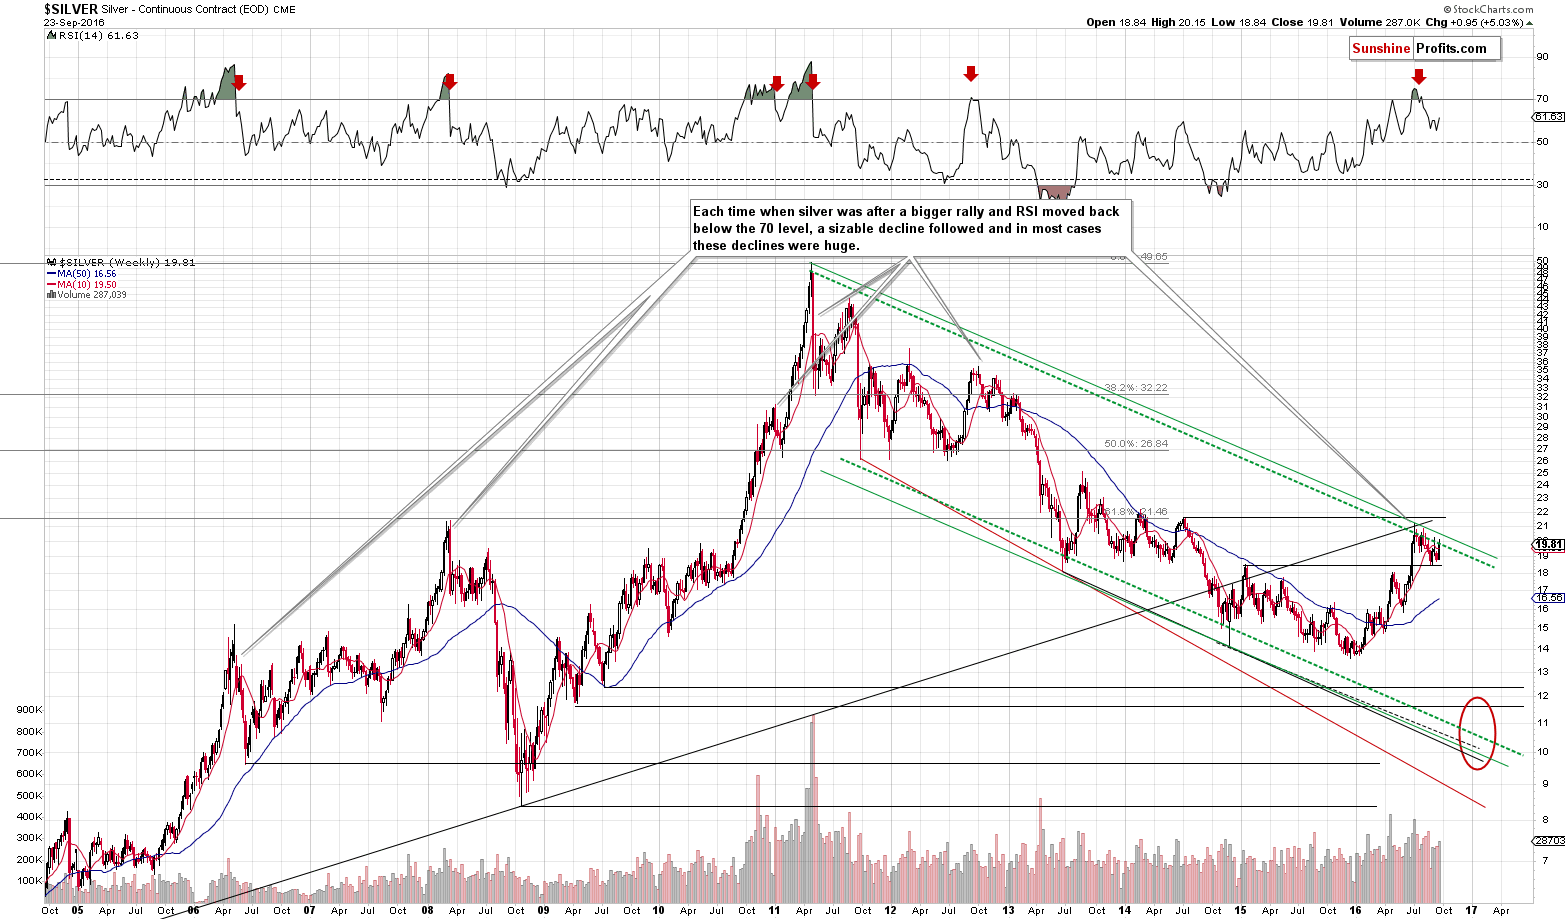
In the case of silver, the long-term picture shows no changes, just like the one in gold. Silver remains below the declining green resistance lines and the main trend remains down.
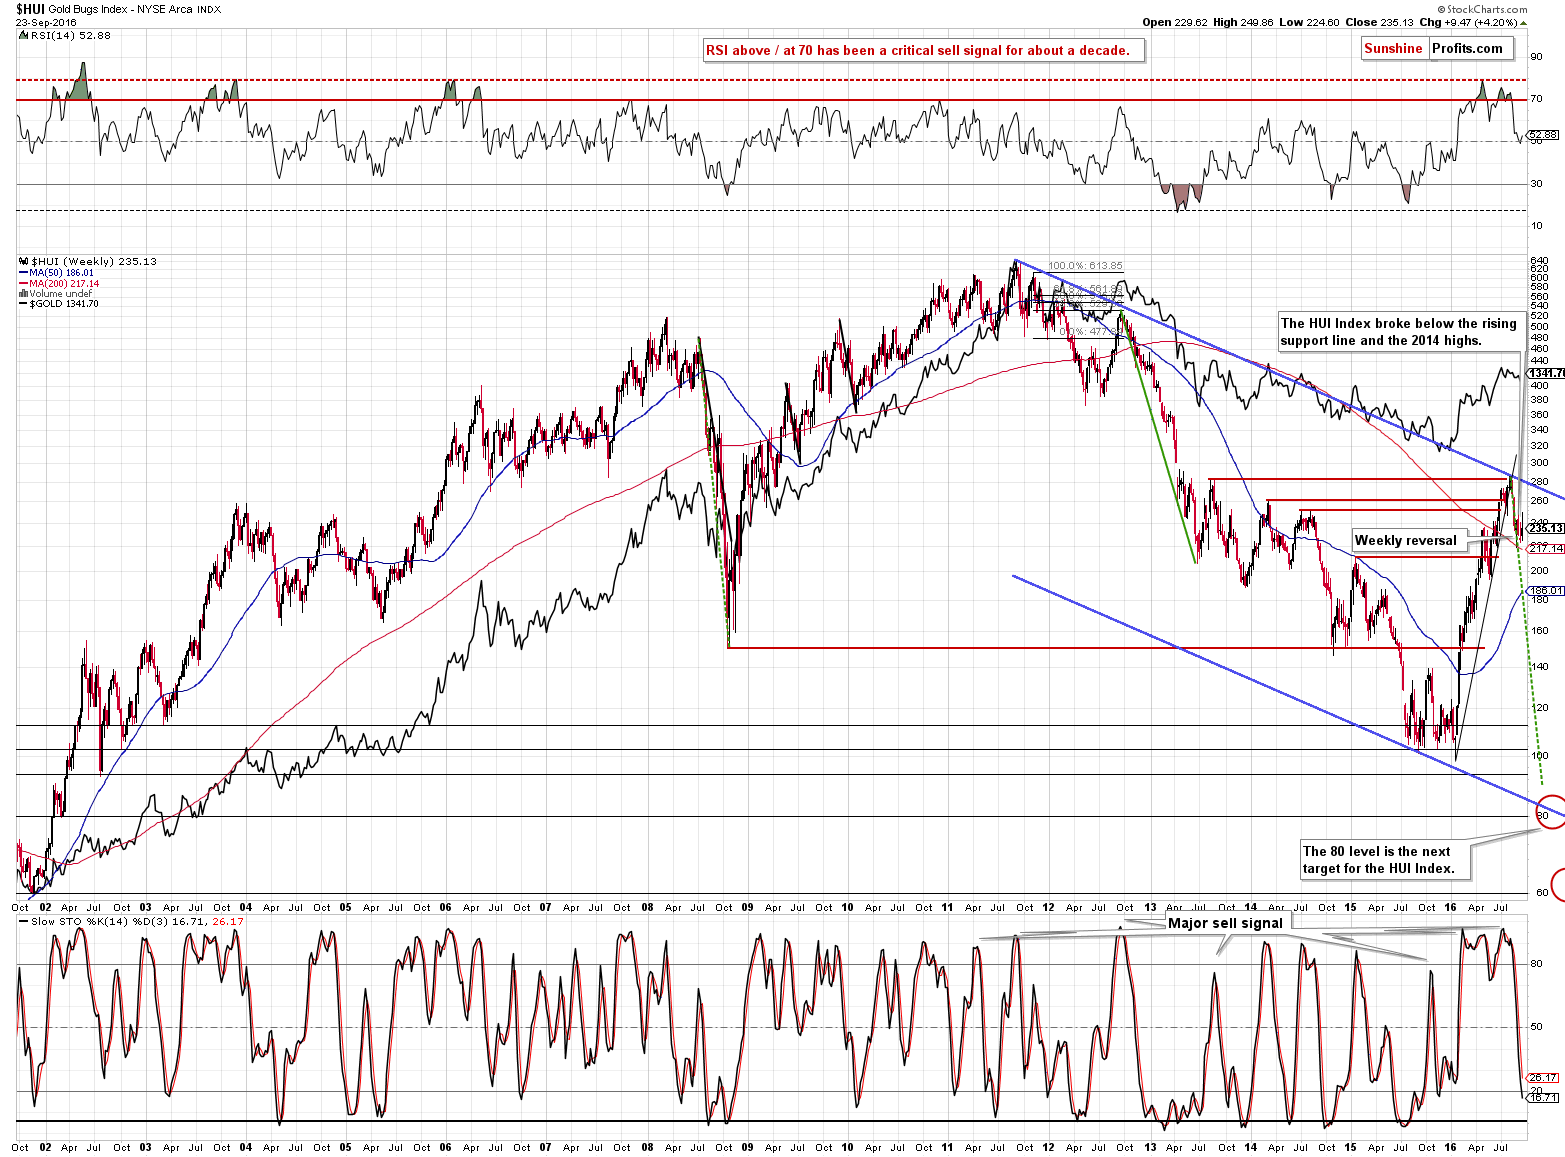
In case of the HUI Index, we can see that miners moved higher last week, but gave away most of the gains before the end of the week. The intra-week high was almost 250 and the HUI closed at 235. Since the HUI had closed the previous week at about 226, it means that it erased more than 60% of its gains (15 points of the 24-index-point rally) before closing the week. That’s bearish on its own and also when compared with the performance of gold, which didn’t really give away its gains before the end of the week. The latter shows that gold stocks are once again underperforming gold, which is another bearish sign.

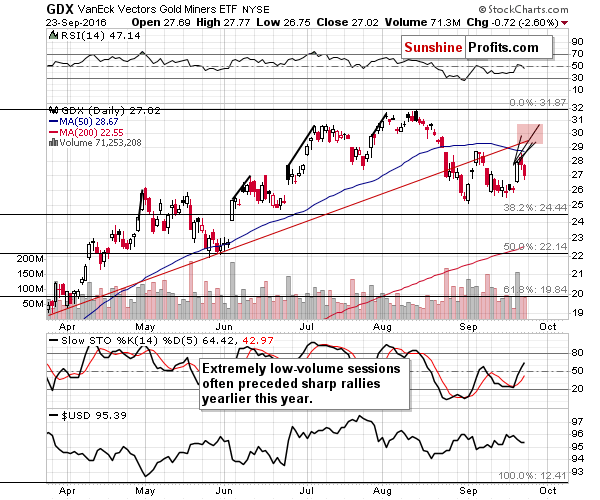
We expected to see a sudden jump in mining stocks and we saw it – consequently, what was about to happen, could already be behind us and yesterday’s intra-day reversal and a decline in miners despite rallying gold, silver and the general stock market certainly suggest so. Still, based on the previous rallies, we should not be shocked or surprised by an additional upswing (to the area marked in red) and the reasons due to which this could take place remain up-to-date:
How high can miners rally? Earlier this month, we compared the sizes of the previous post-sudden-jump rallies and applied this analogy to the early-September one, creating the $28 price target. Applying the same analogy this time provides us with price targets close to the $29 - $30 range. This area also includes the rising red support / resistance line and the 50-day moving average and they both could stop the rally.
But, is it inevitable that miners will rally here? Of course not, and the gold chart shows why.
Moreover, the underperformance of miners vs. metals was only seen for one trading day – it could have simply been miners taking a breather after an exceptional daily rally (which we saw on Wednesday). Consequently, the signals are not very bearish just yet.
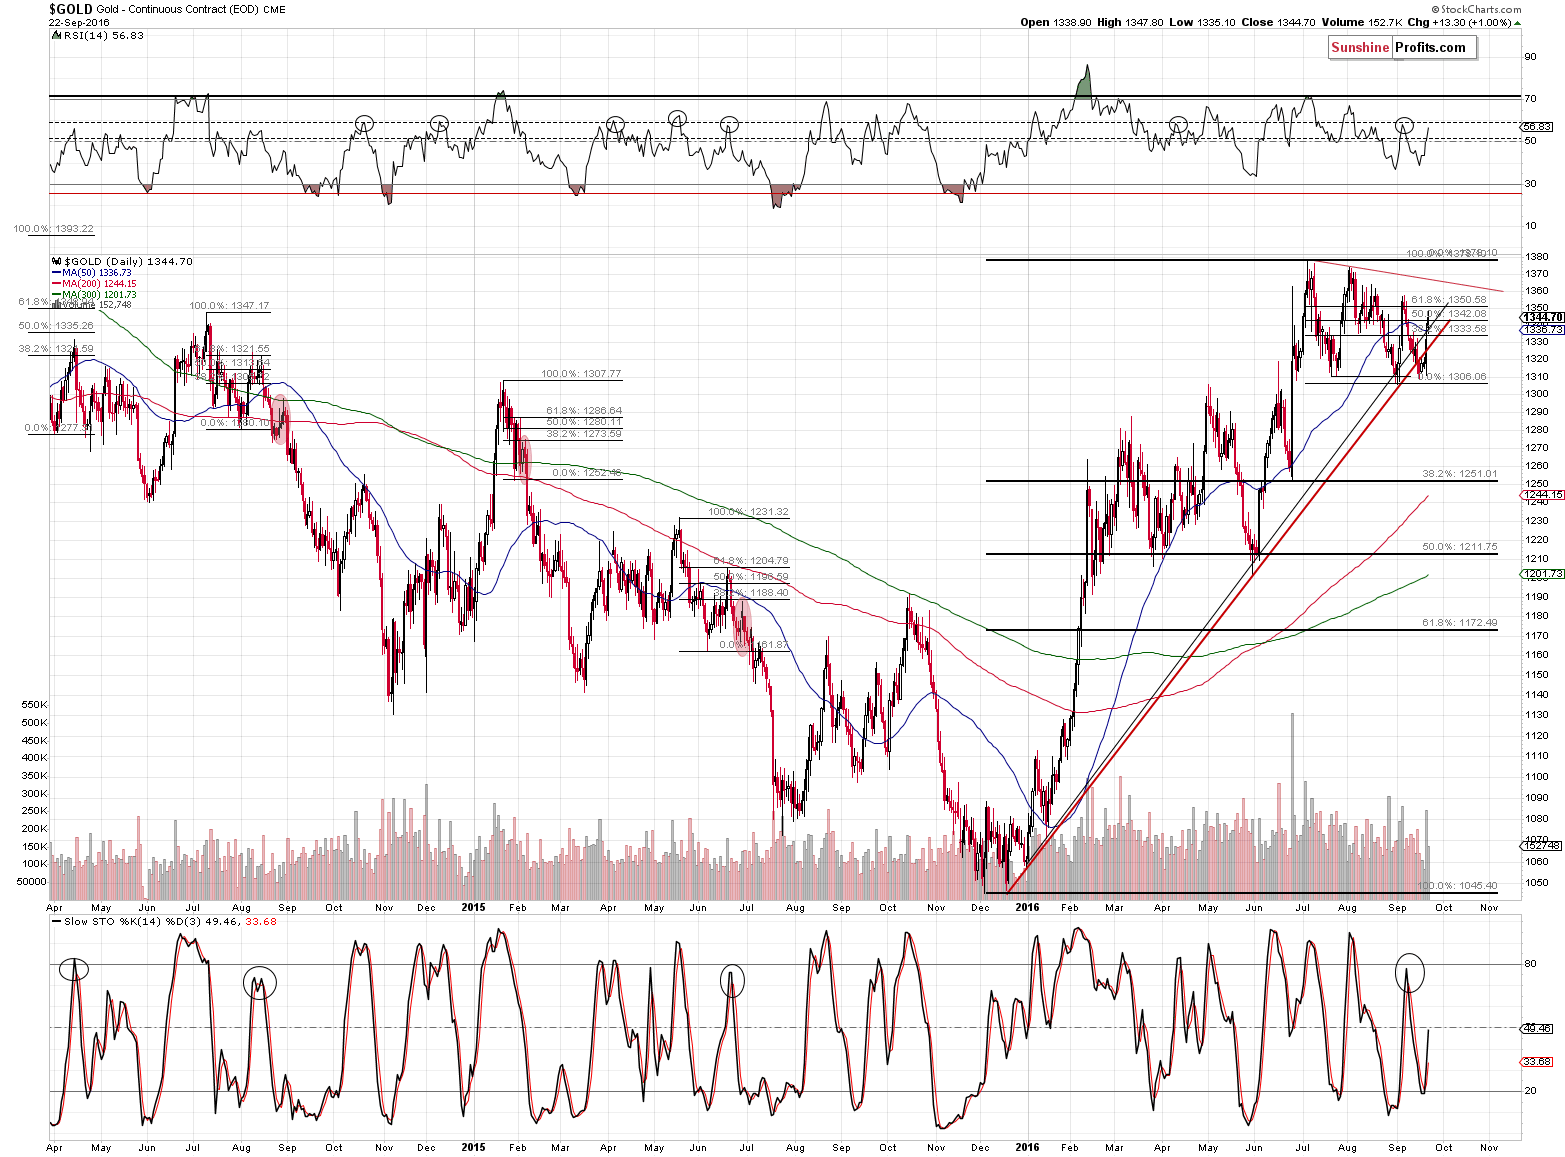
Moving on to gold’s short-term chart, we can say that once again the above gold price appears to be off by a few dollars (with the actual closing price being $1,337.10). Given the latter price, there was no move back above the rising resistance line based on the previous lows in terms of the closing prices. Consequently, the outlook didn’t improve.
In fact, in terms of time, the outlook deteriorated. In Friday’s alert we wrote the following:
Moreover, if we consider how long it took gold to top after previous local bottoms close to $1,300, it seems that the time for this rally may be over or is very close to being over.
The rally that started on September 1 took only 3 days to complete (in terms of closing prices). The rally that started on July 26 took 6 days. The rally that started on June 29 took 5-7 days (with the intra-day high after 5 days). If this rally is similar to the previous ones, then one should expect it to take about 4-6 days. Today – if gold closes higher – would be the 5th day of the rally. Consequently, the top could already be in, we can see it today, or on Monday.
Still, let’s keep in mind that even if gold rallies to $1,365, it wouldn’t invalidate the bearish outlook in general as that would be a move to a resistance line (the declining red line) and not a breakout above it.
The above remains up-to-date and thus we can expect the top to be formed very shortly or that it is already in. The mining stocks’ underperformance relative to gold suggests that the latter is the case.
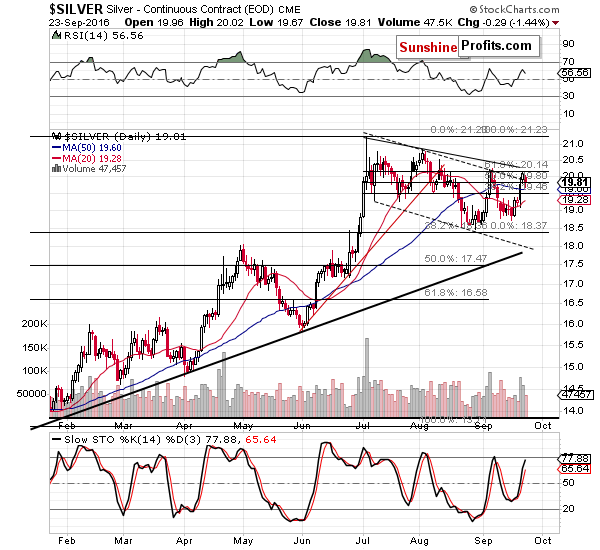
As far as silver’s short-term chart is concerned, our previous comments remain up-to-date:
The white metal rallied sharply, but not yet sharply enough (relative to gold) for this to be a bearish sign on its own. At this time, it doesn’t seem that we have any specific signs from the white metal. However, based on the declining resistance lines, we can say something about the possible price targets. Namely, it seems that silver would not visibly exceed $20.50 (more or less the August high) and perhaps it would not exceed $20.20 as that’s where it topped previously and this level is further supported by the proximity of the 61.8% Fibonacci retracement and the declining resistance line.
Other than that, there’s not much that we can currently say about the above chart. On a side note, the buy signal from the Stochastic indicator is not significant – please note how fake these signals were in mid-May and in August (except for the last one).
The above remains up-to-date. Silver still didn’t outperform gold in an extreme manner, so we have seen no sell confirmation so far.
Silver topped at $20.15 yesterday, a bit below the lower of our target levels, so the top may be in, but the problem here is that we don’t have enough confirmations yet to view this as very likely (likely – yes, but not likely enough to open a speculative position).
The short-term chart featuring mining stocks once again shows their underperformance. It also shows that the volume that accompanied the declines was not big, but that’s not a bullish sign – it’s rather normal for the first days of the decline.
Summing up, there’s more and more bearish signs emerging each day and we’re close to re-opening the short positions in the precious metals sector, but so far we have not received confirmations from silver and the gold-USD link, so entering positions now seems to be too risky. Moreover, the situation in case of the USD Index appears rather unclear for the very short term. Still, the medium-term outlook was bearish and it remains bearish also today. We are monitoring the markets for signs and confirmations of weakness or strength and we will report to you accordingly.
As always, we will keep you – our subscribers – updated.
To summarize:
Trading capital (supplementary part of the portfolio; our opinion): No positions
Long-term capital (core part of the portfolio; our opinion): No positions
Insurance capital (core part of the portfolio; our opinion): Full position
Plus, you might want to read why our stop-loss orders are usually relatively far from the current price.
Please note that a full position doesn’t mean using all of the capital for a given trade. You will find details on our thoughts on gold portfolio structuring in the Key Insights section on our website.
As a reminder – “initial target price” means exactly that – an “initial” one, it’s not a price level at which we suggest closing positions. If this becomes the case (like it did in the previous trade) we will refer to these levels as levels of exit orders (exactly as we’ve done previously). Stop-loss levels, however, are naturally not “initial”, but something that, in our opinion, might be entered as an order.
Since it is impossible to synchronize target prices and stop-loss levels for all the ETFs and ETNs with the main markets that we provide these levels for (gold, silver and mining stocks – the GDX ETF), the stop-loss levels and target prices for other ETNs and ETF (among other: UGLD, DGLD, USLV, DSLV, NUGT, DUST, JNUG, JDST) are provided as supplementary, and not as “final”. This means that if a stop-loss or a target level is reached for any of the “additional instruments” (DGLD for instance), but not for the “main instrument” (gold in this case), we will view positions in both gold and DGLD as still open and the stop-loss for DGLD would have to be moved lower. On the other hand, if gold moves to a stop-loss level but DGLD doesn’t, then we will view both positions (in gold and DGLD) as closed. In other words, since it’s not possible to be 100% certain that each related instrument moves to a given level when the underlying instrument does, we can’t provide levels that would be binding. The levels that we do provide are our best estimate of the levels that will correspond to the levels in the underlying assets, but it will be the underlying assets that one will need to focus on regarding the signs pointing to closing a given position or keeping it open. We might adjust the levels in the “additional instruments” without adjusting the levels in the “main instruments”, which will simply mean that we have improved our estimation of these levels, not that we changed our outlook on the markets. We are already working on a tool that would update these levels on a daily basis for the most popular ETFs, ETNs and individual mining stocks.
Our preferred ways to invest in and to trade gold along with the reasoning can be found in the how to buy gold section. Additionally, our preferred ETFs and ETNs can be found in our Gold & Silver ETF Ranking.
As always, we'll keep you - our subscribers - updated should our views on the market change. We will continue to send out Gold & Silver Trading Alerts on each trading day and we will send additional Alerts whenever appropriate.
The trading position presented above is the netted version of positions based on subjective signals (opinion) from your Editor, and the Tools and Indicators.
As a reminder, Gold & Silver Trading Alerts are posted before or on each trading day (we usually post them before the opening bell, but we don't promise doing that each day). If there's anything urgent, we will send you an additional small alert before posting the main one.
=====
Latest Free Trading Alerts:
Stock Trading Alert: New Downtrend Or Just Downward Correction Before Another Leg Higher?
S&P 500 index fluctuates after its recent rally. Is this a topping pattern or just consolidation before another leg up? Is holding short position still justified?
=====
Hand-picked precious-metals-related links:
Citi Warns on Gold as Bank Boosts Odds of Trump Win to 40%
Gold steady as dollar falls vs yen; US politics in focus
=====
In other news:
Shadows of Trump and Putin loom over Ukraine
Bank of Japan Tries Another Way to Spur Inflation
=====
Thank you.
Sincerely,
Przemyslaw Radomski, CFA
Founder, Editor-in-chief, Gold & Silver Fund Manager
Gold & Silver Trading Alerts
Forex Trading Alerts
Oil Investment Updates
Oil Trading Alerts

