

Briefly: In our opinion, short (full) speculative positions in gold, silver and mining stocks are justified from the risk/reward point of view.
Gold stocks finally rallied yesterday and based on that it may seem that the decline in the precious metals is over – after all, silver and gold rallied as well, so it seems that we have a confirmed rally. However, a few other things happened as well, which show that the situation in the precious metals market is not as simple as it appears at the first sight.
Let’s jump right into the charts (charts courtesy of http://stockcharts.com).
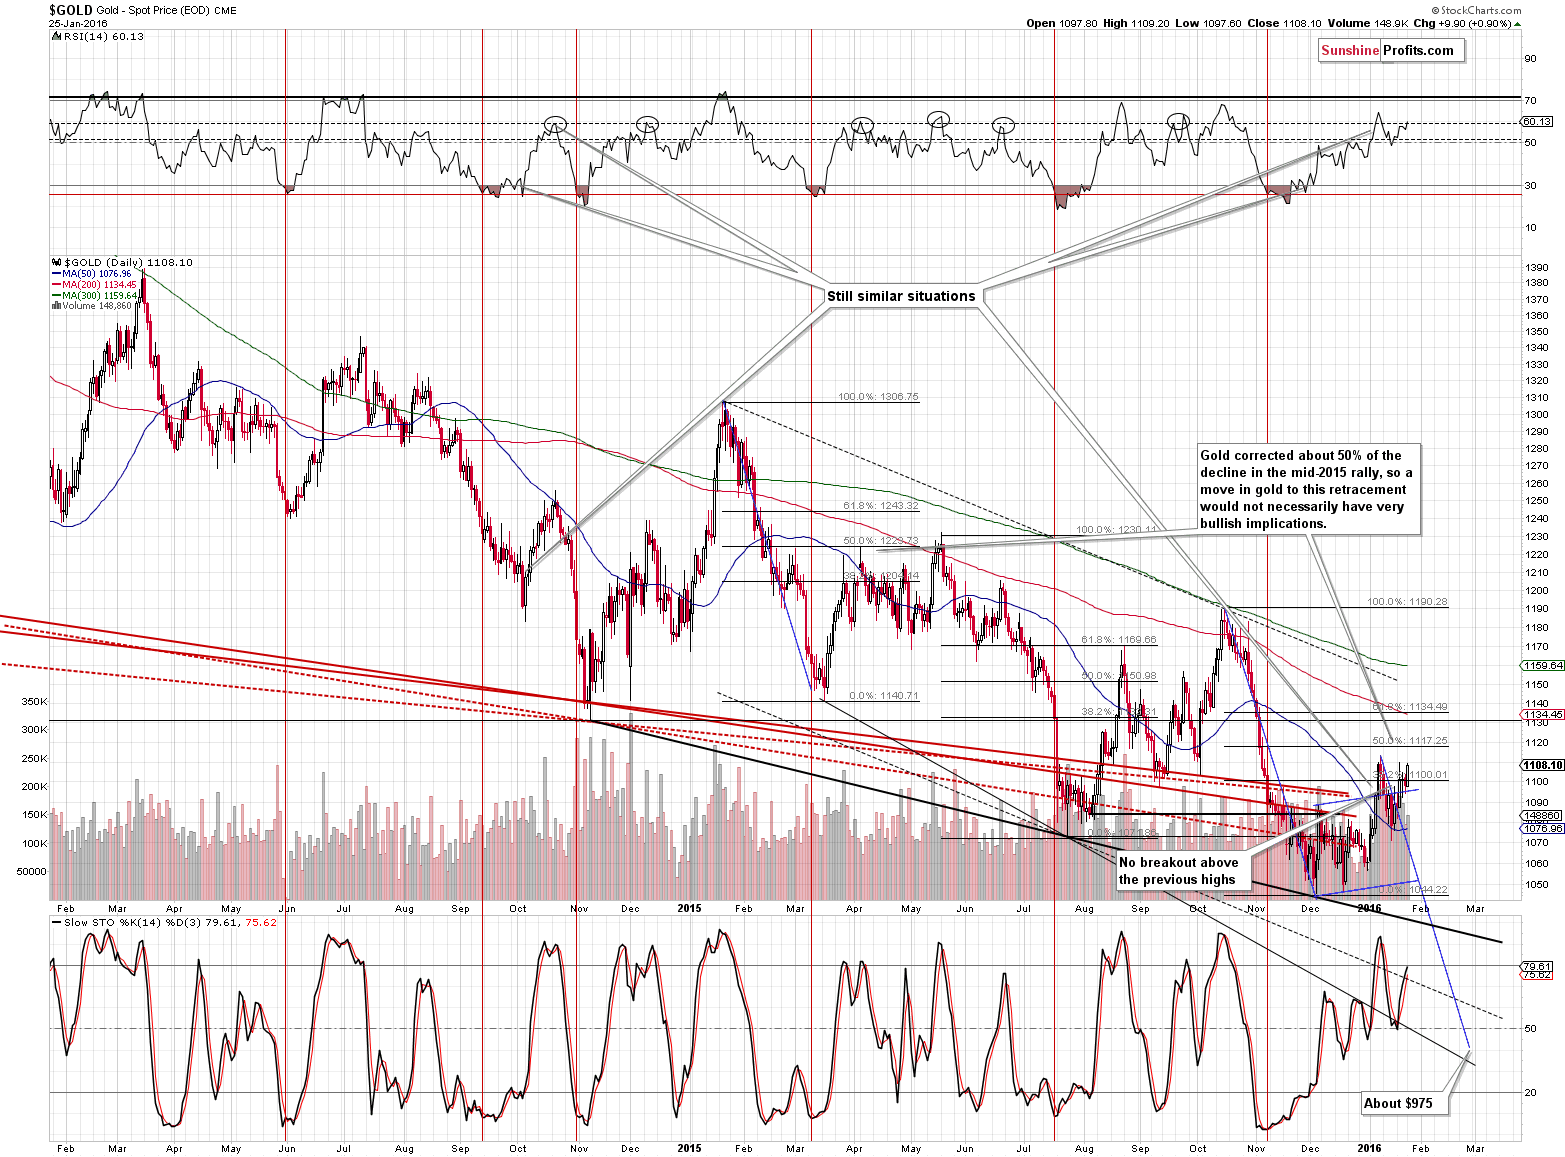
Gold moved higher yesterday and the RSI indicator is once again close to the 60 level – this is where many previous tops were formed. Gold is now only a bit below its previous 2016 high. The difference between the previous time gold moved to this level and now is that at this time the volume is relatively low. With no breakout above the previous high and a rally on low volume, the implications of yesterday’s move are not bullish and can actually be viewed as a mildly bearish signal.
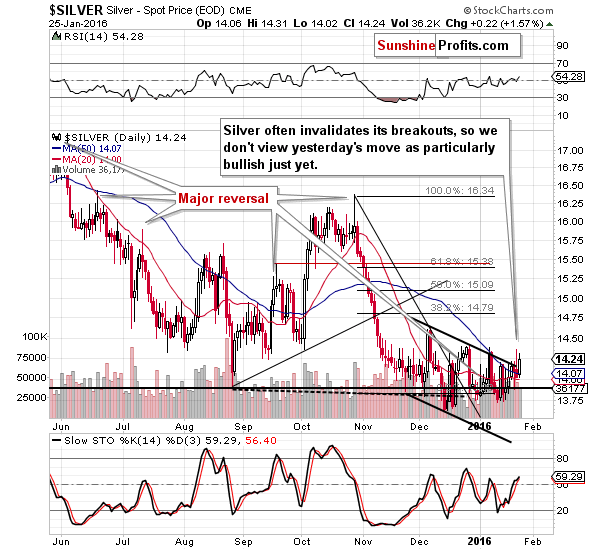
Silver moved higher and closed above the declining resistance line and the 50-day moving average, but let’s not forget that silver is known for its fake breakouts and thus we are not viewing the above breakout as confirmed and as bullish. Its invalidation will be a bearish sign, but the unconfirmed breakout is rather not meaningful – at least not yet.
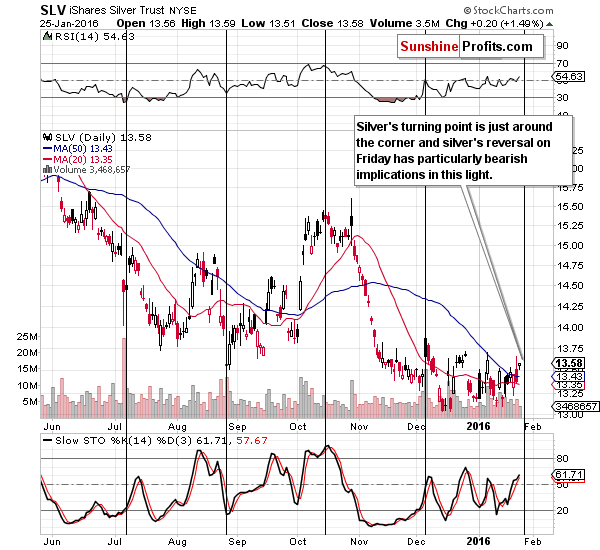
Moreover, let’s keep in mind an important fact about the silver market.
Silver’s cyclical turning point – it’s just around the corner and thus we can expect a reversal. The odds are that we have just seen it and consequently, the decline can now continue.
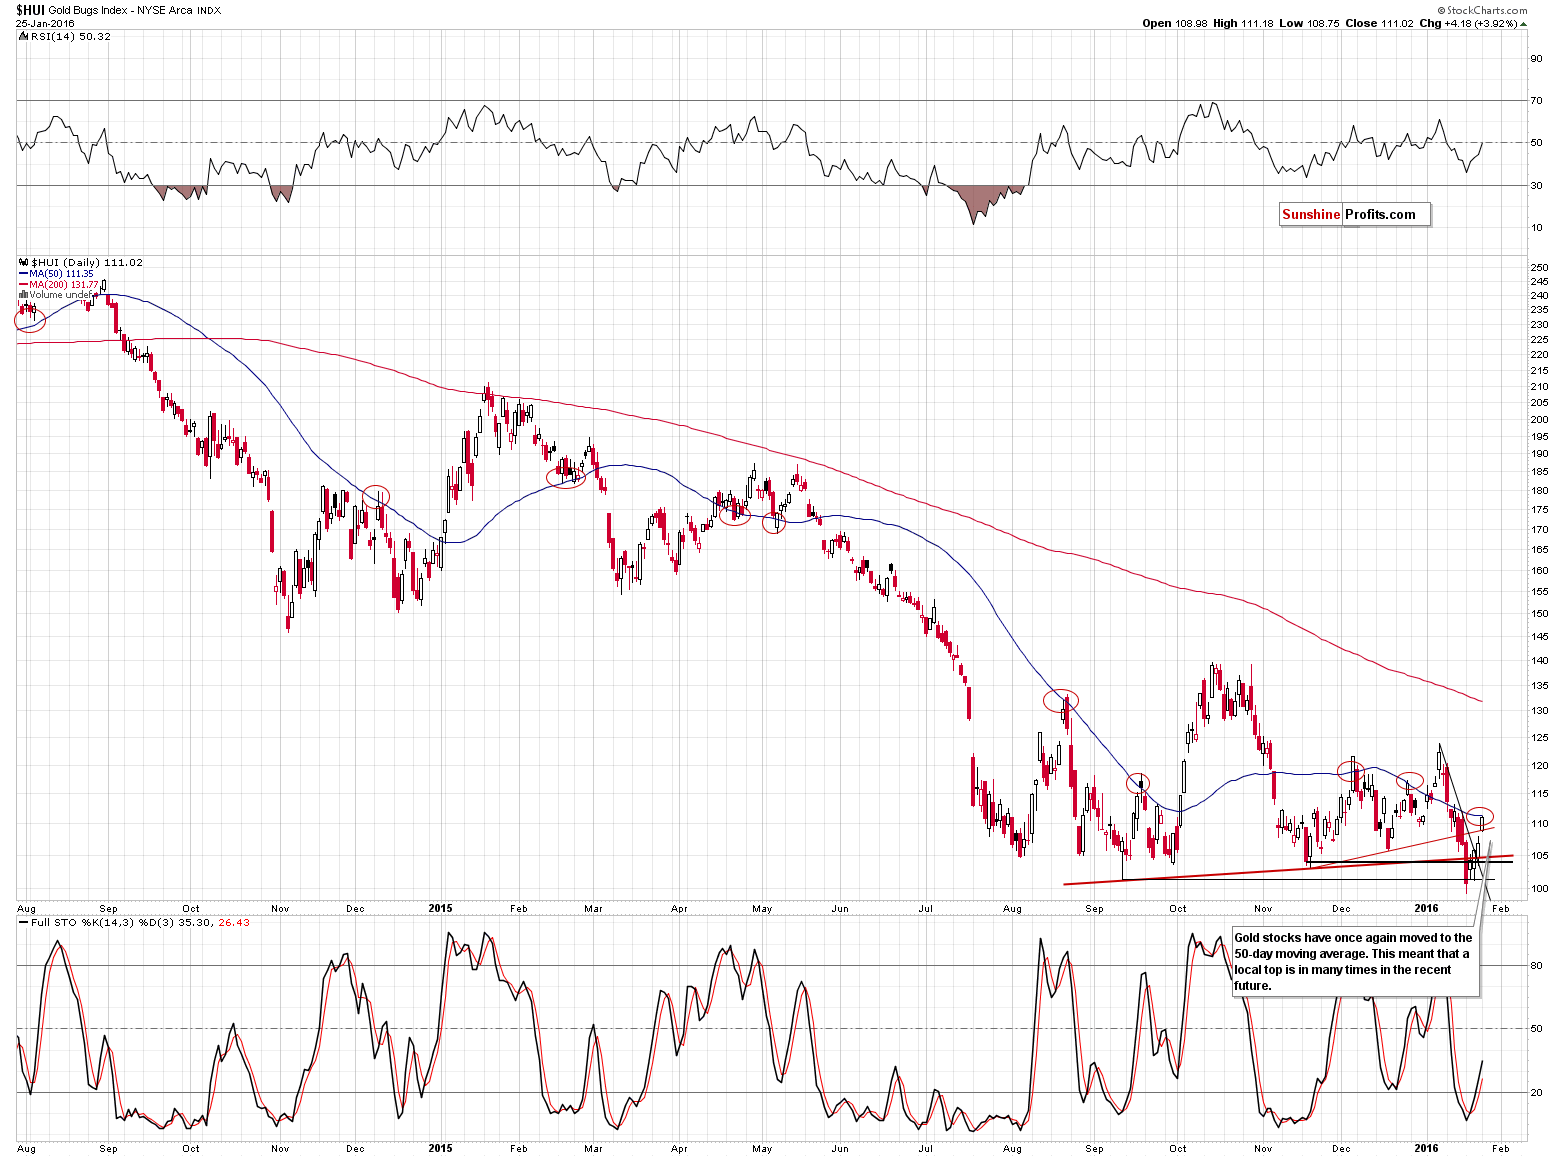
Gold stocks moved higher yesterday, but is this really a reason to get excited? Gold miners are still trading very close to the 100 level and are more or less at the level at which they started this year – we haven’t seen a major rally. What have we indeed seen? A move back to the 50-day moving average – something that held rallies in check multiple times in the past months. The breakdown below the previous lows was invalidated, but perhaps the rally that was likely to follow is already over or about to be over very soon (based on the 50-day moving average being reached).
Besides, was the breakdown really invalidated?
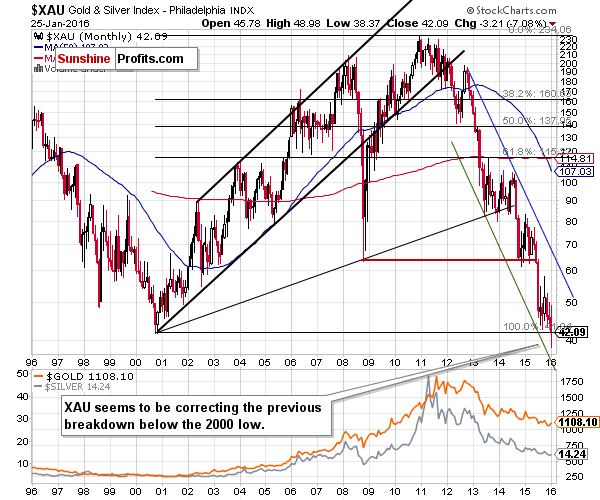
The XAU Index shows no invalidation of the previous major breakdown – the index broke below its 2000 low and it has now simply moved back to this level. Such a verification is a quite natural technical development and if mining stocks decline shortly, it will simply serve as breakdown’s confirmation.
Taking both proxies for the mining stocks into account (XAU and HUI) suggests that much less changed yesterday and last week than it might appear at the first sight.
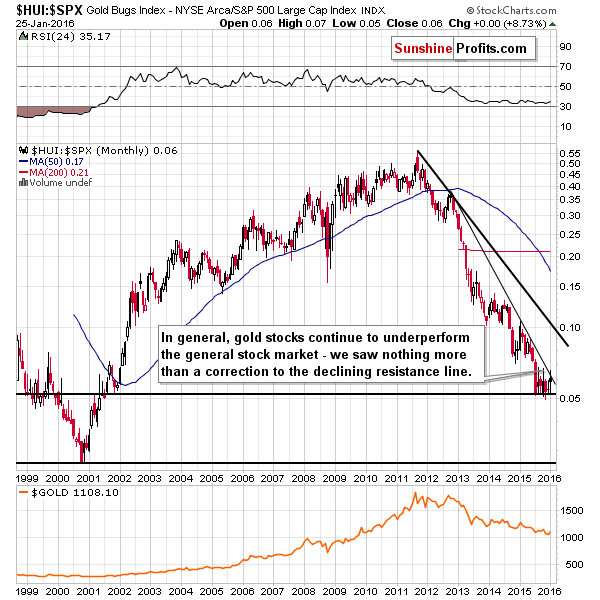
In fact, comparing the performance of gold stocks to the general stock market shows that there was no breakout and that the trend remains down. The implications are bearish as the HUI to S&P 500 ratio is at its declining medium-term resistance line.
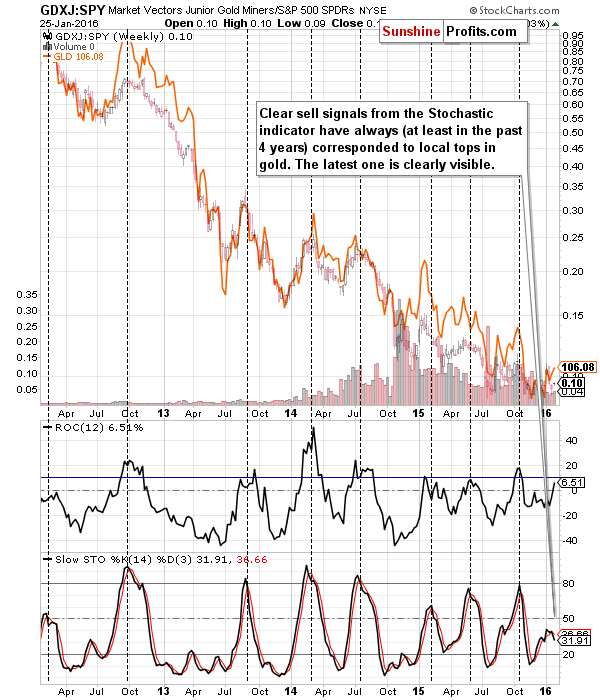
Speaking of ratios, GDXJ to SPY is a little-followed but very important and reliable indicator for the precious metals market. Plotting Stochastic and the Rate of Change indicator on the above ratio allow us to detect moments when juniors are right after a short-term outperformance relative to other stocks and these were very often (in the past few years – always) periods right before yet another decline in gold.
We are currently seeing the indicators in the position that suggests another slide is just around the corner. Please note that the above chart is based on weekly closing prices and this week is not over yet, but the sell signal in the Stochastic indicator is quite visible and thus if nothing changes in terms of prices, we will have a strong sell signal at the end of the week. In other words, not only what happened recently is not bullish – it’s bearish.
There is something else that happened yesterday that should get more attention than seems to have been the case.
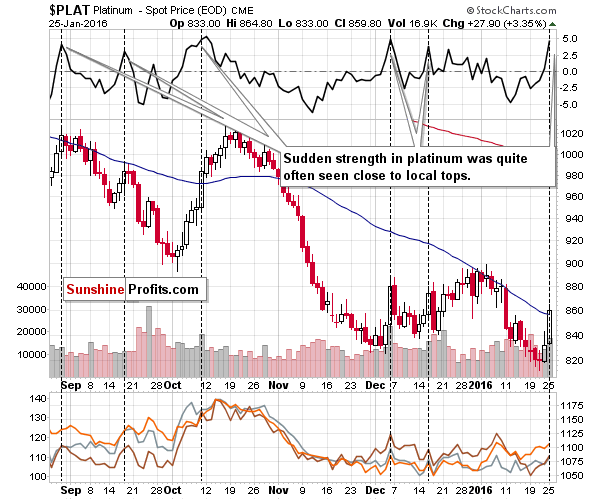
Platinum soared. It moved to its 50-day moving average, so the odds are that the rally is over or almost over, just like it was the case earlier this year, but that’s not the most important thing that we can infer from the above chart. The key thing is that the move was very sharp and sizable. Why is this significant? Because that’s against the medium-term trend and because it was preceded by long period of platinum’s underperformance relative to the rest of the precious metals sector.
The thing is that the weak and low-volume parts of a given market or sector tend to outperform right before a top. The likely reason is that the general public usually enters the market close to local tops and these investors tend to buy assets that appear cheap (regardless of the existence of good reasons for that in the first place). The general public doesn’t care about trends, valuations, etc. – the simple fact is that this part of the market hasn’t rallied “yet”, so “it’s likely” to catch up. This doesn’t have to happen and usually doesn’t, but it appears that the general public tends to believe this will be the case. We have seen this kind of behavior in many markets and sectors on a few levels (a sector within a market, or an individual stock within a sector).
On a side note, it is for a similar reason that juniors mining stocks tend to outperform senior mining stocks in the final parts of a rally – because juniors are also relatively more popular among the general public as they appear “cheaper” and thus having greater profit potential. On the other hand, institutional investors often can’t invest in juniors due to either regulations or the fact that juniors are being traded on so thin volume that it’s impossible to put a large amount of money into a junior stock without moving it significantly. You can read more about juniors in our Dictionary section (on a side note, we recently added a new term and we encourage you to check it out: black swan event).
So, since platinum was generally the underperformer and it just soared, it could be a bearish sign. Is it really the case? We marked similar (we used the Rate of Change indicator to detect moves that were similarly sharp) situations on the above chart with vertical, dashed lines. It turns out that declines indeed followed if not immediately, then shortly.
As we wrote above, this phenomenon can be seen also on an individual stock level. We just received the following question:
Do you know what do investors saw in Barrick gold today? 8% up in a single day! As far as I know they have 9 billion in debt!
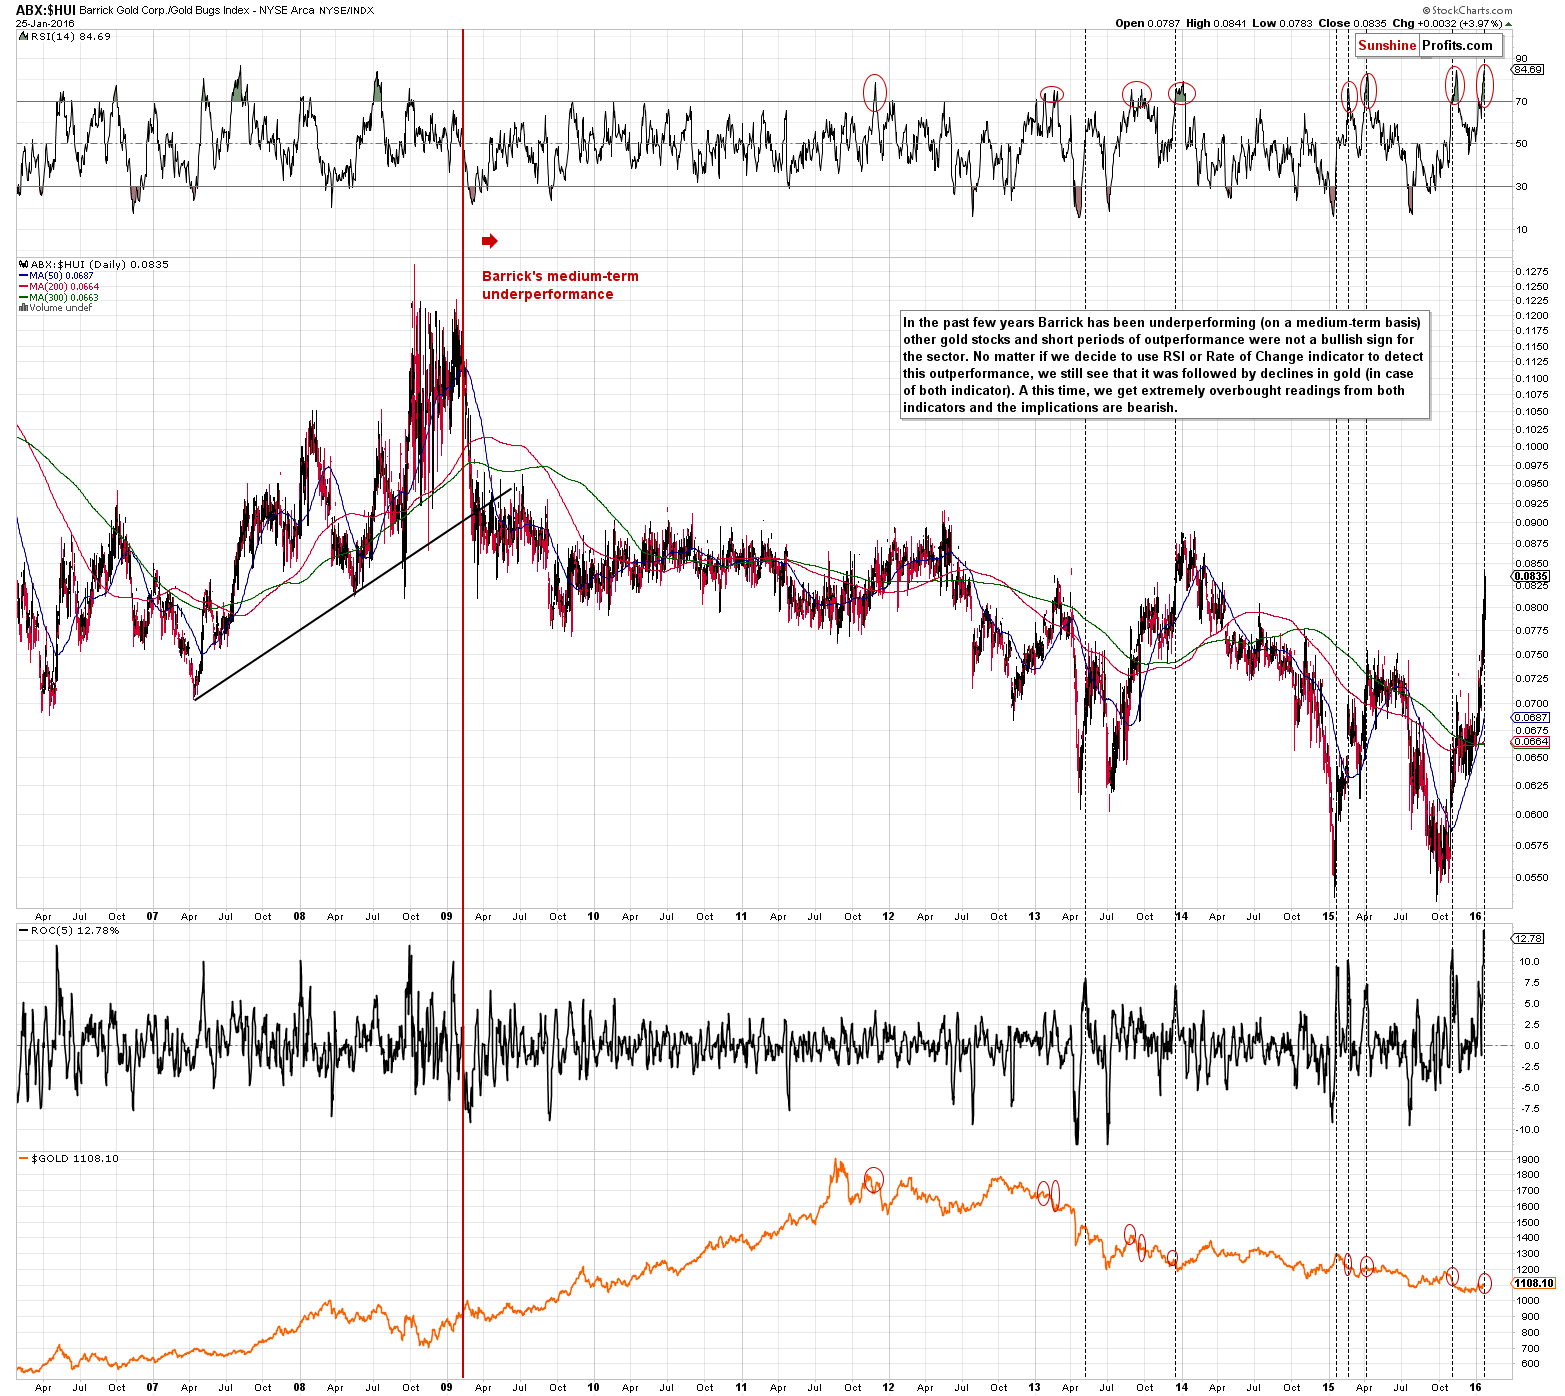
In general, taking the medium-term trend into account, Barrick has been underperforming the HUI Index for several years and we just saw a sharp short-term rally – similarly to what we saw in platinum. Were the previous short-term rallies in ABX just as bearish? Yes - we marked similar situations with vertical, dashed lines (based on the ROC indicator) and with red ellipses (based on the RSI indicator). In practically all cases in the past few years (when ABX was indeed underperforming on a medium-term basis) these situations were followed by declines in gold – if not immediately, then shortly.
What did investors see in Barrick yesterday? It’s impossible to know for certain, but our best guess is that they viewed it as relatively cheap compared to other stocks and thus bought it in hope of gaining more on the invested capital than in case of other stocks (just like was probably the case with platinum).
Before summarizing, let’s take a look how much changed in the USD Index.
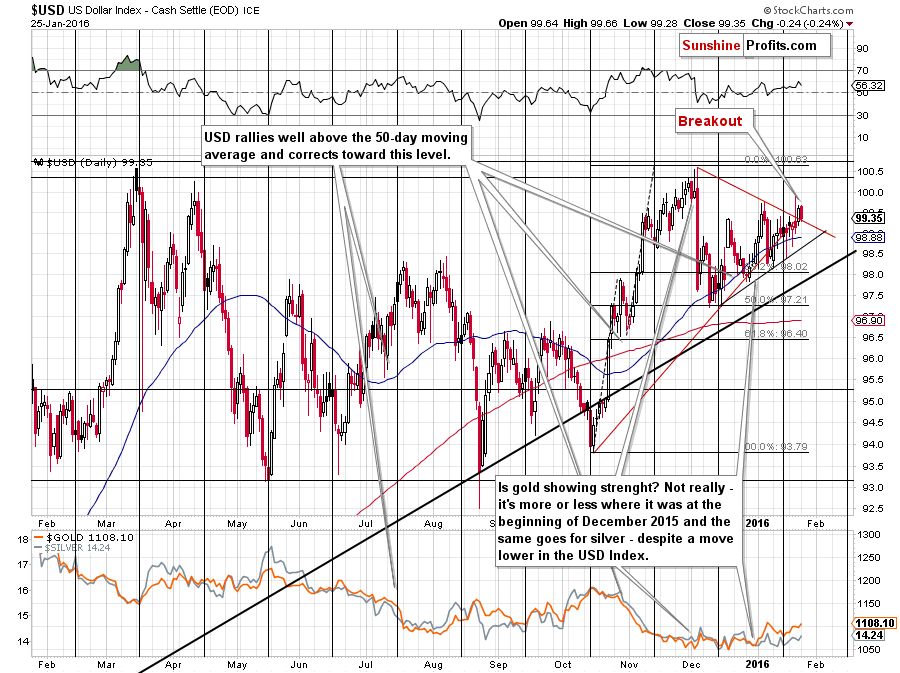
Well, actually, nothing changed. The USD Index had broken above the declining red resistance line on Friday and didn’t slide back below it on Monday. The breakout was not invalidated and the implications are bullish for the USD Index and bearish for the precious metals sector.
There’s one more thing about the precious metals market that we would like to cover – the sentiment indicated by a survey. In Friday’s survey, of those who voted, 848, or 81%, said they are bullish on gold next week; at the same time, 142 people, or 14%, said they are bearish and 61 people, or 6%, say they were neutral. The vast majority of investors were bullish on gold on Friday and since gold rallied yesterday and in today’s pre-market move, this percentage is very likely even higher today. Markets form major bottoms when (and because) almost everyone is bearish (!) on a given asset and markets form tops when the vast majority is bullish. Why? Because people generally first buy and then express their bullishness. Since almost everyone is already bullish this suggests that almost everyone has already entered the market.
Moreover, please note that the percentage of bullish professionals is lower (65%), which generally confirms what we have inferred from the charts (platinum and Barrick) – that the general investment public is now the main buying force. Therefore, we have yet another reason to expect lower precious metals prices relatively soon.
Summing up, while it may seem that there were some bullish indications of yesterday’s moves higher (especially the move higher in mining stocks), it’s important to note that we saw new bearish developments as well. The parts of the precious metals sector that have been underperforming, rallied strongly and this is generally a bearish sign. The HUI Index moved back above its previous lows, but the XAU Index – another proxy for mining stocks – is just verifying the breakdown below its 2000 low. Silver is right before its turning point and the preceding move was up, so we are likely to see a decline based on this factor as well. There are also bearish indications from junior mining stocks. Moreover, the situation in the USD Index is bullish, which has bearish implications for PMs and mining stocks.
The important thing is that the bearish signals that we just saw don’t have to work immediately – if they come into effect in 2 or a few more days, it will not invalidate them. Consequently, even if gold, silver and mining stocks move a bit higher today or tomorrow, it shouldn’t change anything (if it does, we’ll send out another alert). When the market does indeed move lower, it can and is quite likely to drop very far very fast, so we think that keeping the short position opened even in light of a possible temporary move higher is justified from the risk to reward point of view. We don’t think that metals or miners would move higher than our stop-loss levels, and in fact, we don’t think they will move close to them either.
Overall, the outlook was and still is bearish. In our opinion, the short position in the precious metals sector continues to be justified from the risk to reward point of view.
As always, we will keep you – our subscribers – updated.
To summarize:
Trading capital (our opinion): Short positions (full) in gold, silver and mining stocks are justified from the risk/reward perspective with the following stop-loss orders and initial target price levels:
- Gold: initial target price: $973; stop-loss: $1,143, initial target price for the DGLD ETN: $117.70; stop-loss for the DGLD ETN $74.28
- Silver: initial target price: $12.13; stop-loss: $14.83, initial target price for the DSLV ETN: $101.84; stop-loss for DSLV ETN $57.49
- Mining stocks (price levels for the GDX ETF): initial target price: $10.23; stop-loss: $15.47, initial target price for the DUST ETF: $31.90; stop-loss for the DUST ETF $10.61
In case one wants to bet on junior mining stocks' prices (we do not suggest doing so – we think senior mining stocks are more predictable in the case of short-term trades – if one wants to do it anyway, we provide the details), here are the stop-loss details and initial target prices:
- GDXJ ETF: initial target price: $15.23; stop-loss: $21.13
- JDST ETF: initial target price: $52.99; stop-loss: $21.59
Long-term capital (our opinion): No positions
Insurance capital (our opinion): Full position
Plus, you might want to read why our stop-loss orders are usually relatively far from the current price.
Please note that a full position doesn’t mean using all of the capital for a given trade. You will find details on our thoughts on gold portfolio structuring in the Key Insights section on our website.
As a reminder – “initial target price” means exactly that – an “initial” one, it’s not a price level at which we suggest closing positions. If this becomes the case (like it did in the previous trade) we will refer to these levels as levels of exit orders (exactly as we’ve done previously). Stop-loss levels, however, are naturally not “initial”, but something that, in our opinion, might be entered as an order.
Since it is impossible to synchronize target prices and stop-loss levels for all the ETFs and ETNs with the main markets that we provide these levels for (gold, silver and mining stocks – the GDX ETF), the stop-loss levels and target prices for other ETNs and ETF (among other: UGLD, DGLD, USLV, DSLV, NUGT, DUST, JNUG, JDST) are provided as supplementary, and not as “final”. This means that if a stop-loss or a target level is reached for any of the “additional instruments” (DGLD for instance), but not for the “main instrument” (gold in this case), we will view positions in both gold and DGLD as still open and the stop-loss for DGLD would have to be moved lower. On the other hand, if gold moves to a stop-loss level but DGLD doesn’t, then we will view both positions (in gold and DGLD) as closed. In other words, since it’s not possible to be 100% certain that each related instrument moves to a given level when the underlying instrument does, we can’t provide levels that would be binding. The levels that we do provide are our best estimate of the levels that will correspond to the levels in the underlying assets, but it will be the underlying assets that one will need to focus on regarding the sings pointing to closing a given position or keeping it open. We might adjust the levels in the “additional instruments” without adjusting the levels in the “main instruments”, which will simply mean that we have improved our estimation of these levels, not that we changed our outlook on the markets. We are already working on a tool that would update these levels on a daily basis for the most popular ETFs, ETNs and individual mining stocks.
Our preferred ways to invest in and to trade gold along with the reasoning can be found in the how to buy gold section. Additionally, our preferred ETFs and ETNs can be found in our Gold & Silver ETF Ranking.
As always, we'll keep you - our subscribers - updated should our views on the market change. We will continue to send out Gold & Silver Trading Alerts on each trading day and we will send additional Alerts whenever appropriate.
The trading position presented above is the netted version of positions based on subjective signals (opinion) from your Editor, and the Tools and Indicators.
As a reminder, Gold & Silver Trading Alerts are posted before or on each trading day (we usually post them before the opening bell, but we don't promise doing that each day). If there's anything urgent, we will send you an additional small alert before posting the main one.
=====
Latest Free Trading Alerts:
The price of gold has been rising in 2016 despite the strong greenback. What does it imply for the gold market?
Gold Rising Despite Strong U.S. Dollar
=====
Hand-picked precious-metals-related links:
INFOGRAPHIC: Gold's biggest winning and losing streaks
Five reasons why RBC remains bullish on Gold this year
Gold Fields wins sustainability award
Eldorado Gold to book up to $1.6 billion charge after halting work in Greece
Anglo American Platinum full-year loss to hit over $850 million
=====
In other news:
Draghi Says ECB Credibility Hinges on Meeting Inflation Goal
EU Slows Down on Greece Support as Compliance Trumps Urgency
Saudi Arabia to move beyond oil to IT, healthcare and tourism
China stocks plunge 6% as rout continues
China not as bad as people think: Siemens CEO
=====
Thank you.
Sincerely,
Przemyslaw Radomski, CFA
Founder, Editor-in-chief
Gold & Silver Trading Alerts
Forex Trading Alerts
Oil Investment Updates
Oil Trading Alerts

