

Briefly: In our opinion, short (full) speculative positions in gold, silver and mining stocks are justified from the risk/reward point of view.
Last week was full of important events – crude oil plunged and rallied back up, stocks plunged and rallied back up, mining stocks reversed initially after declining and then reversed a bit on Friday, giving up some of the gains. Silver reversed in an even more profound way. What can we make out of all these reversals?
Let’s jump right into the charts (charts courtesy of http://stockcharts.com).
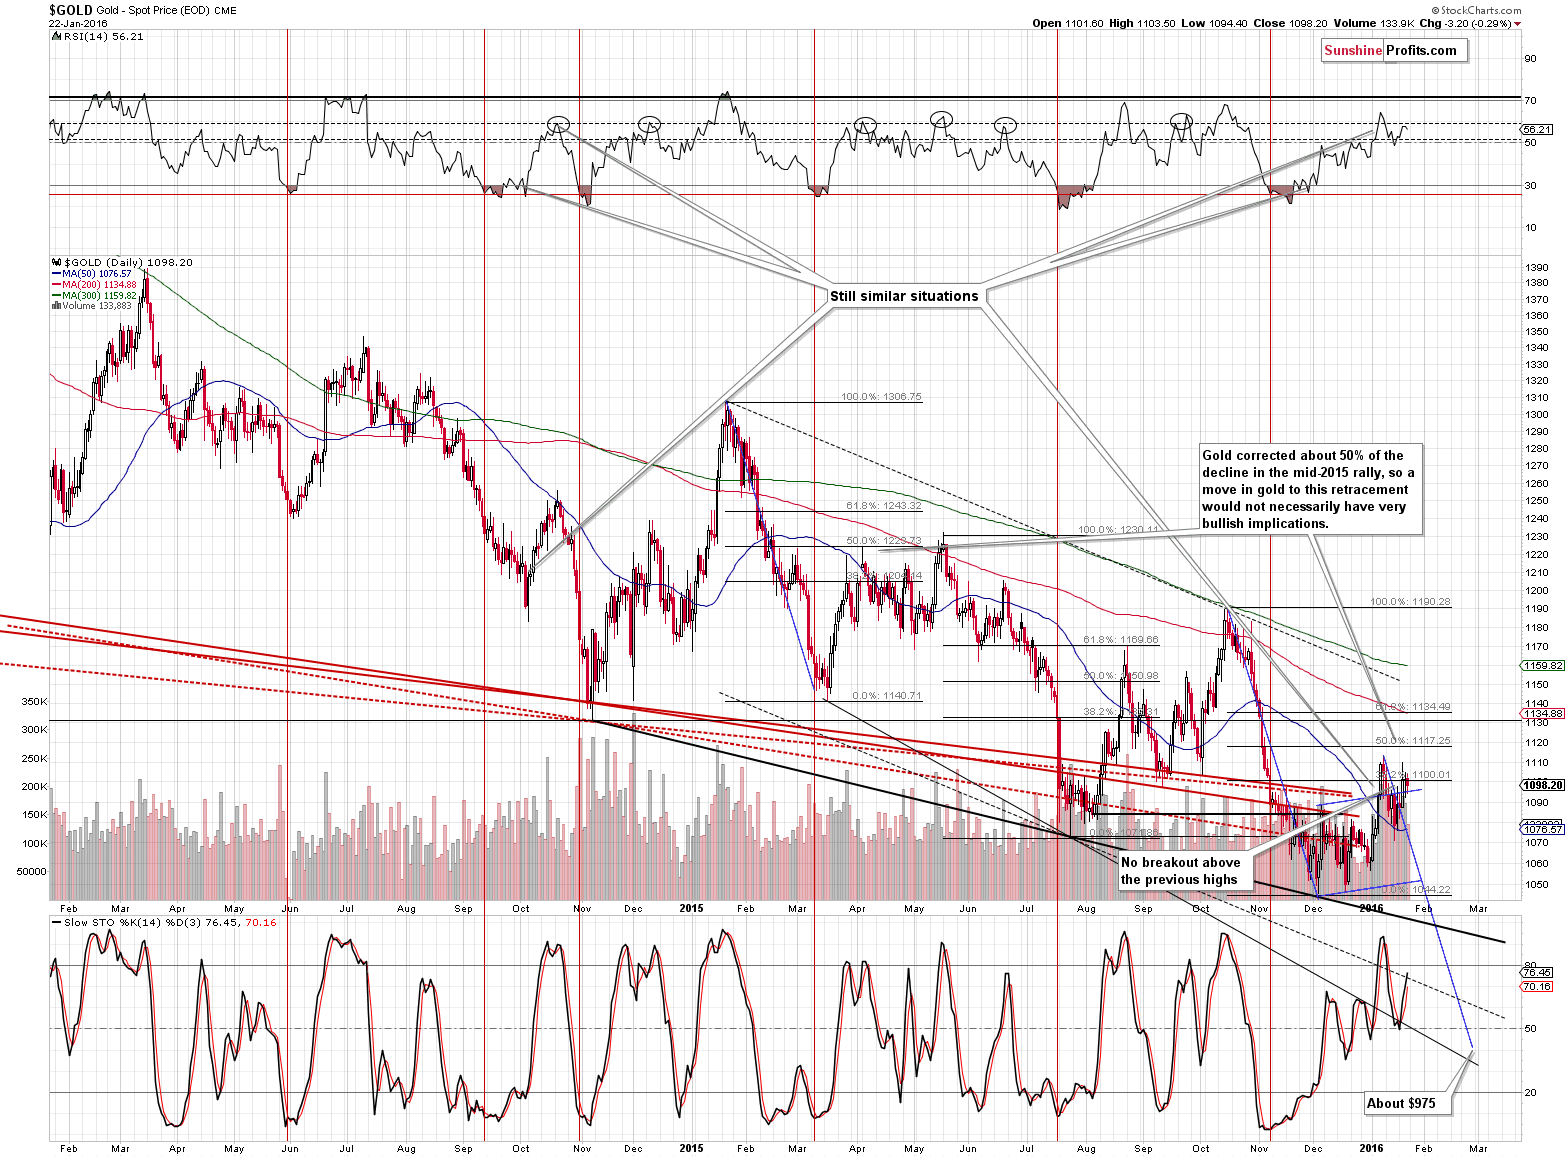
Gold moved a bit lower on Friday, moving back below the $1,100 level and the 38.2% Fibonacci retracement. Based on the above, the situation in gold deteriorated a bit. Still, our previous comments on the above chart remain up-to-date:
Without a breakout above the 61.8% Fibonacci retracement, it will continue to be a correction and not a new rally. At this time gold is more than $30 away from the mentioned level, so it’s not even close. Is gold likely to move as high? Not really – just because gold moved higher during one session based on the metal’s safe-haven status doesn’t imply a continuation of the rally, especially given the situation in mining stocks. Did the situation in gold improve based on yesterday’s move higher? Not really.
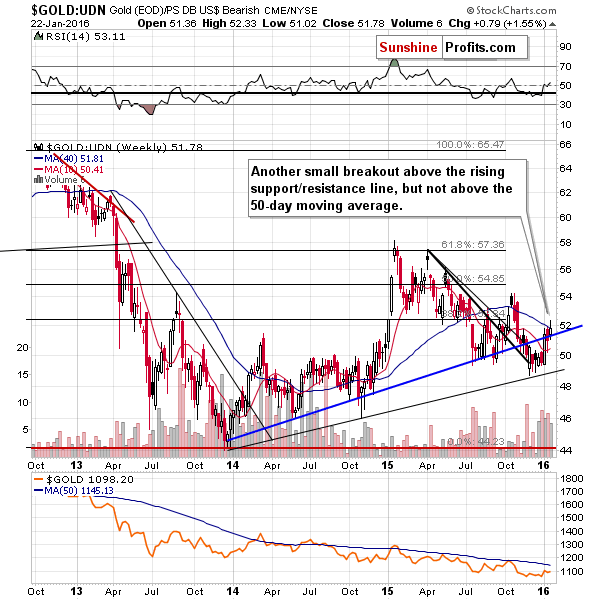
From the non-USD perspective, the situation in gold has actually improved, but just a little. Gold closed the week a bit above the rising blue support / resistance line, but the important thing is that it didn’t break below the 40-week moving average.
The 40-week moving average (thin blue line) had provided resistance and support in the recent past, and it was reached once again. It seems that a turnaround and a move lower are just around the corner.
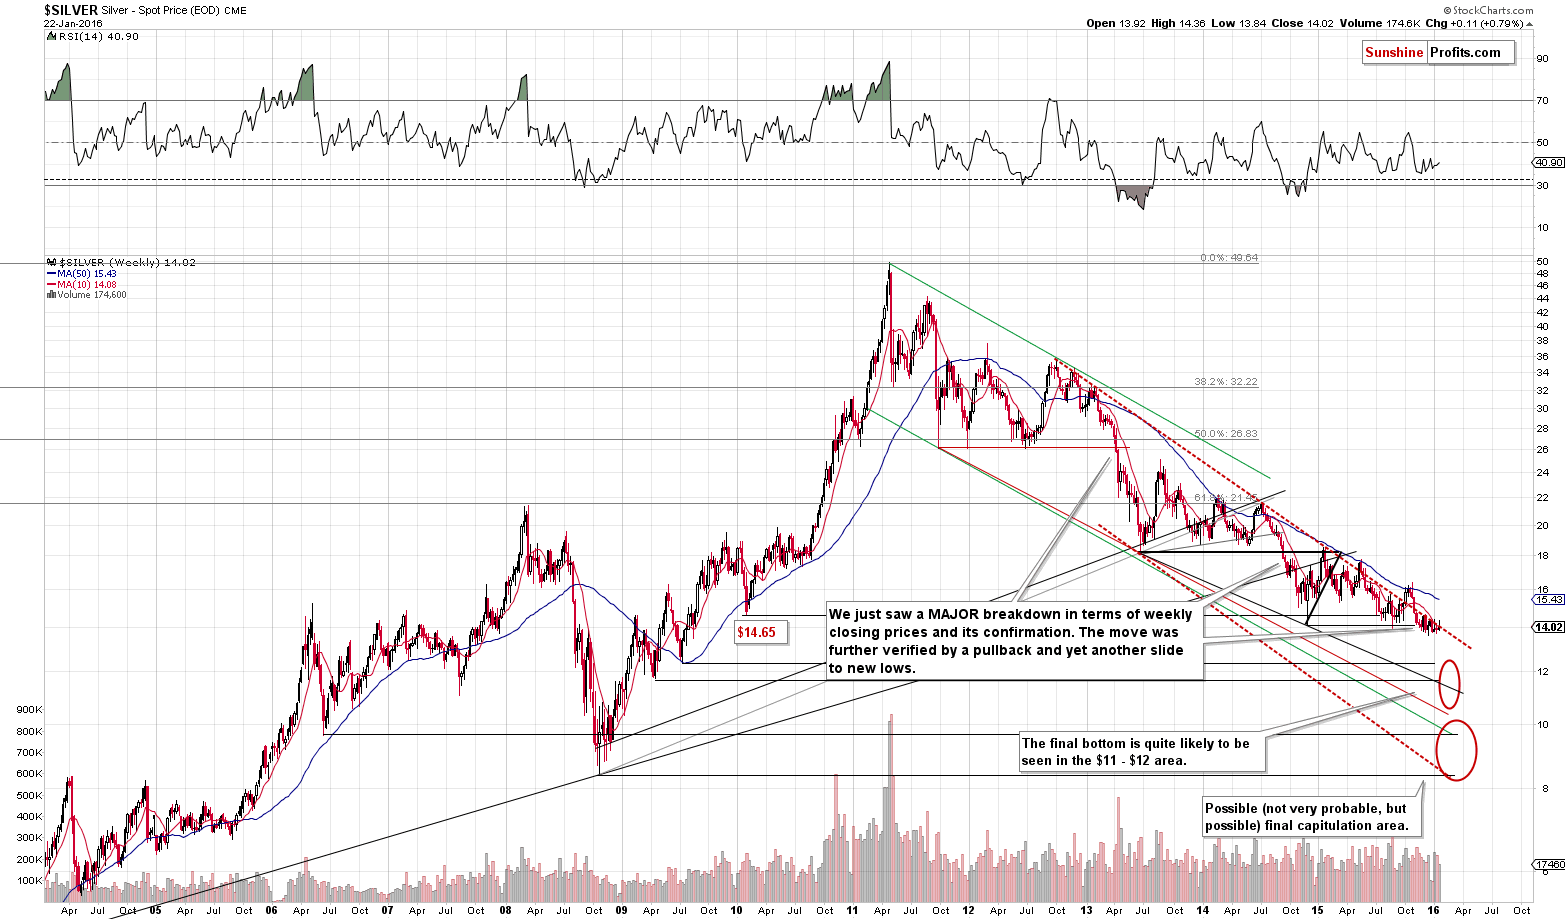
Moving to silver, we see that from the long-term perspective, nothing changed as silver remains below the declining red resistance line. In fact, silver is very close to it and thus the room for a potential rally is very limited.
Actually, silver attempted to move above this line and failed to hold these gains – the size of the rally that we can see without invalidating the red line is now very, very limited.
Still, let’s keep in mind that the above does not guarantee that there will be no breakout above this line and if we see such breakout it will not automatically make the outlook bullish. Silver is known for fake breakouts, so even if we see a breakout here, whether it will be bullish or not will very likely depend on the amount and quality of confirmations that we get from other markets.
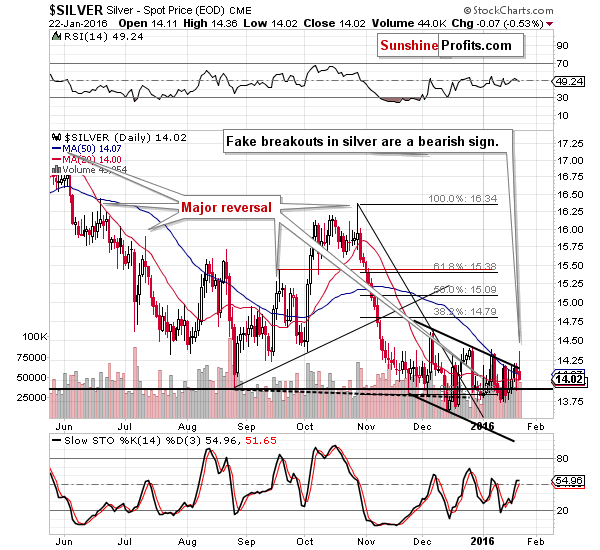
From the short-term point of view, we also see an attempt to move higher – an attempt that failed. Silver formed a bearish shooting star candlestick. It’s bearish on its own, but there’s something that makes it even more bearish than it would normally be.
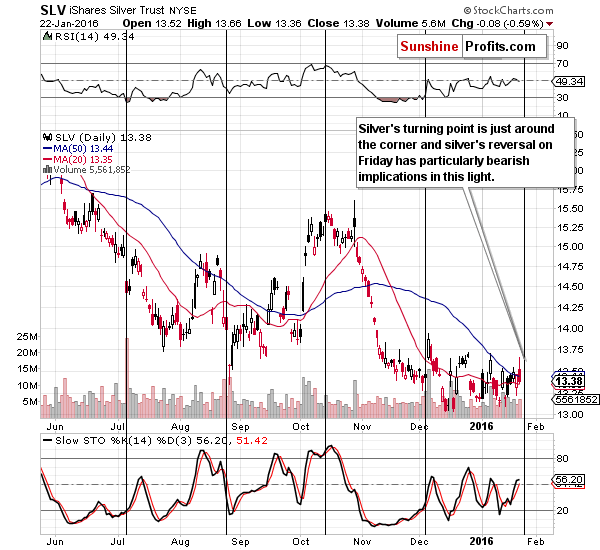
Silver’s cyclical turning point – it’s just around the corner and thus we can expect a reversal. The odds are that we have just seen it and consequently, the decline can now continue.
Please note that silver also broke above the 50-day moving average on Friday and then quickly invalidated this breakout. That’s another bearish sign from the white metal.
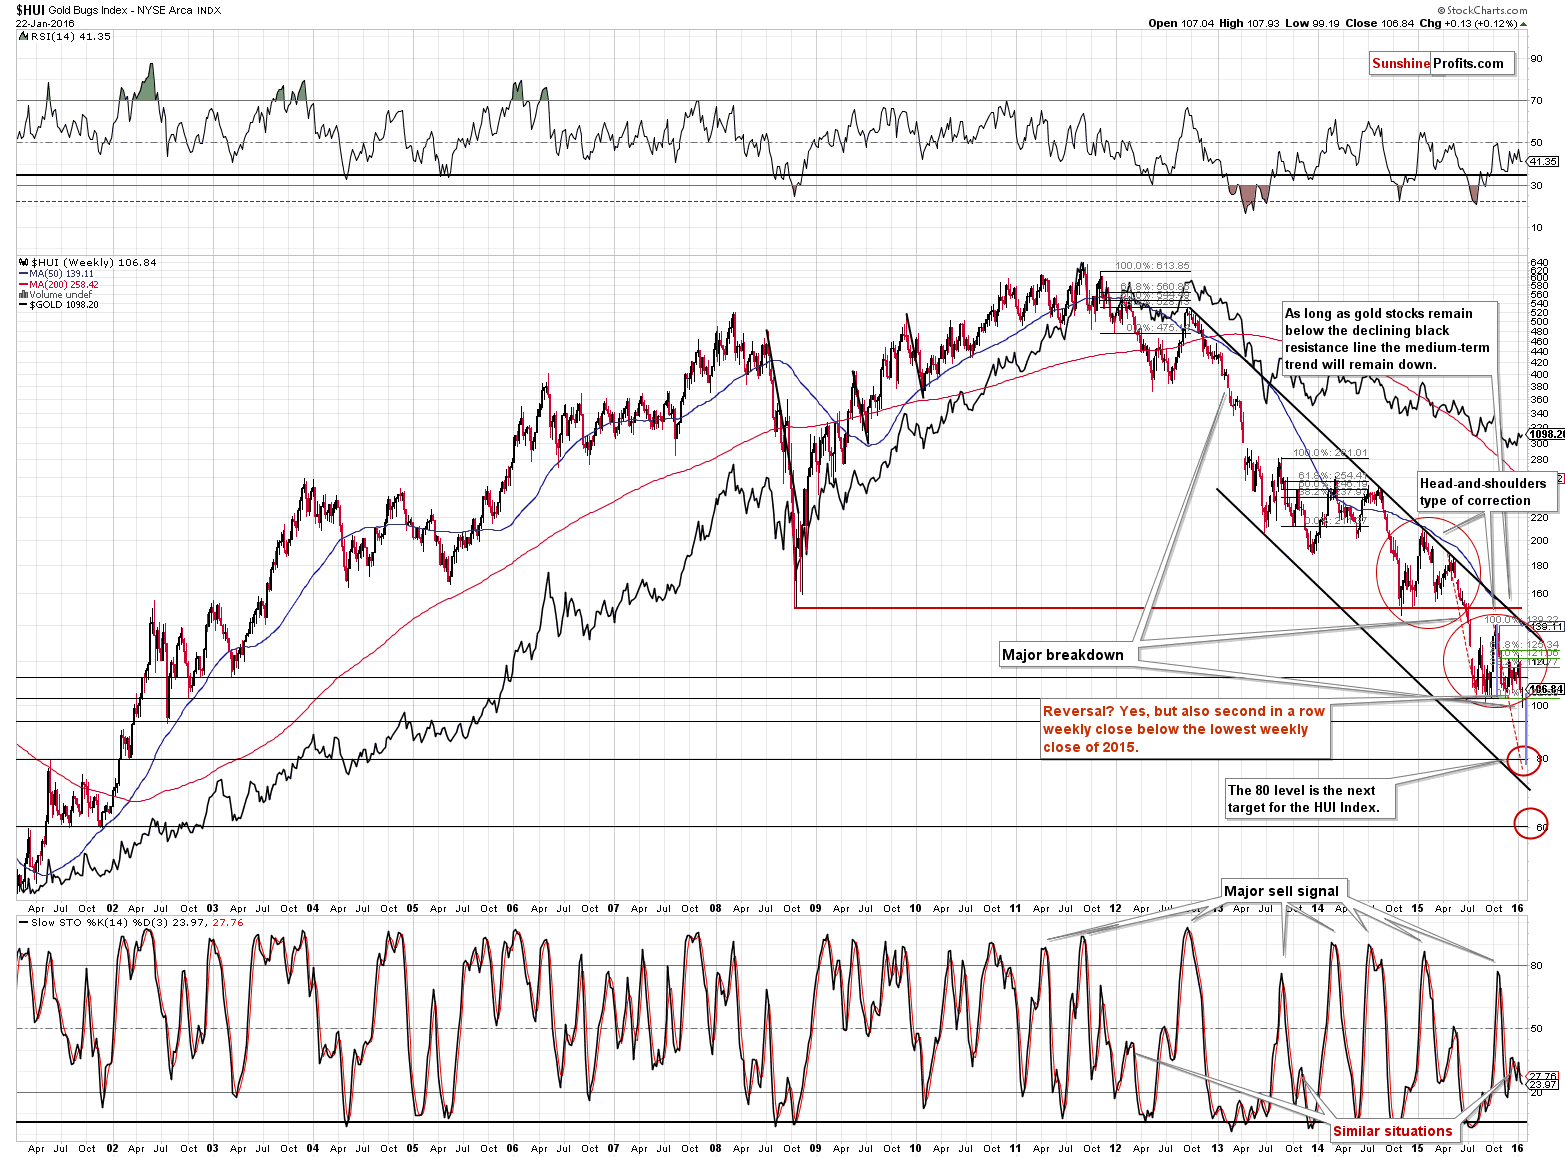
Gold stocks reversed last week, but before saying that it’s a very bullish development let’s consider the following:
- HUI moved higher by just 0.12%
- S&P 500 moved higher by 1.41%
- Gold moved higher by 0.88%
Gold stocks underperformed both gold and the general stock market – how bullish is this? It isn’t – it’s bearish.
Moreover, even though the HUI Index closed the week slightly higher than previously, that was still a close below the lowest weekly closes of 2015. Consequently, in terms of weekly closing prices, we saw a breakdown 2 weeks ago and last week there was no invalidation of this breakdown.
Speaking of the gold stocks’ performance (or more precisely, lack thereof) relative to gold and the general stock market, let’s take a look at the related charts.
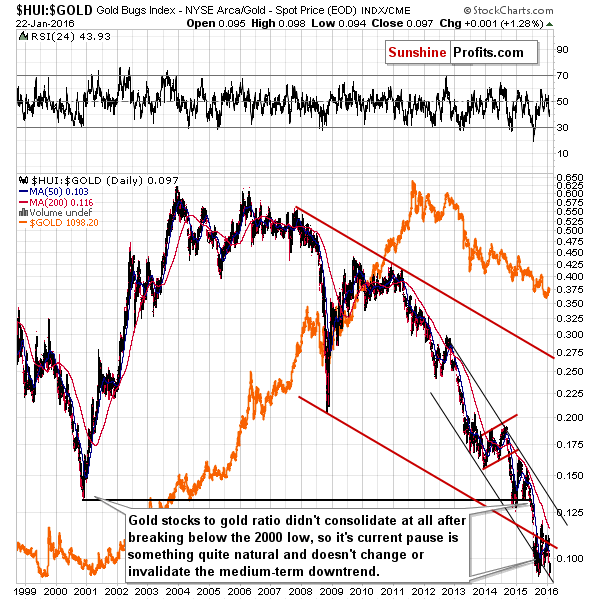
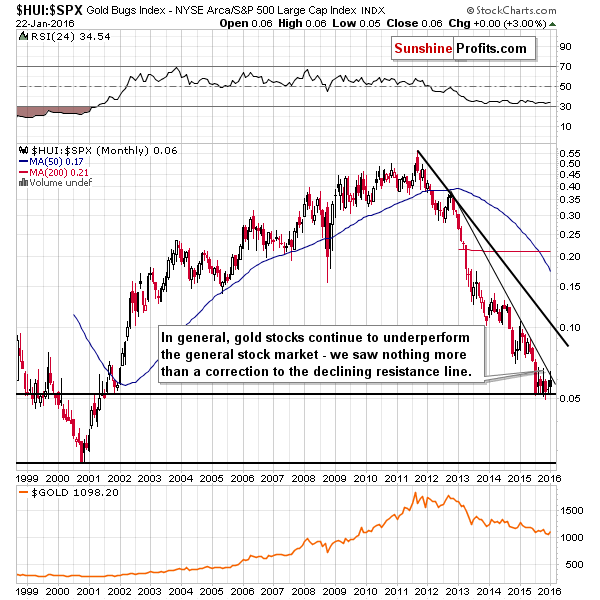
In both cases the trend remains down, and last week’s performance seems to confirm this. The implications for gold stocks and the entire precious metals sector remain bearish.
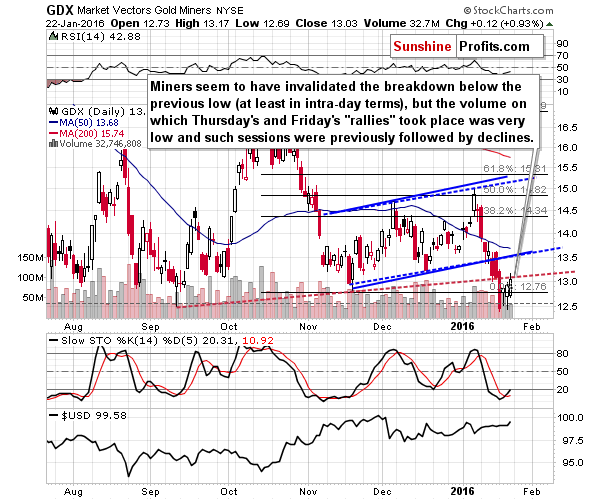
When examining the mining stocks performance and using the GDX ETF as a proxy, we additionally see 2 things: from this perspective, there was no invalidation of the neck level of the huge head-and-shoulders pattern (red, dashed line) and the volume on which GDX moved higher on Thursday and Friday was low. Both things have bearish implications.
What about silver stocks on a stand-alone basis?
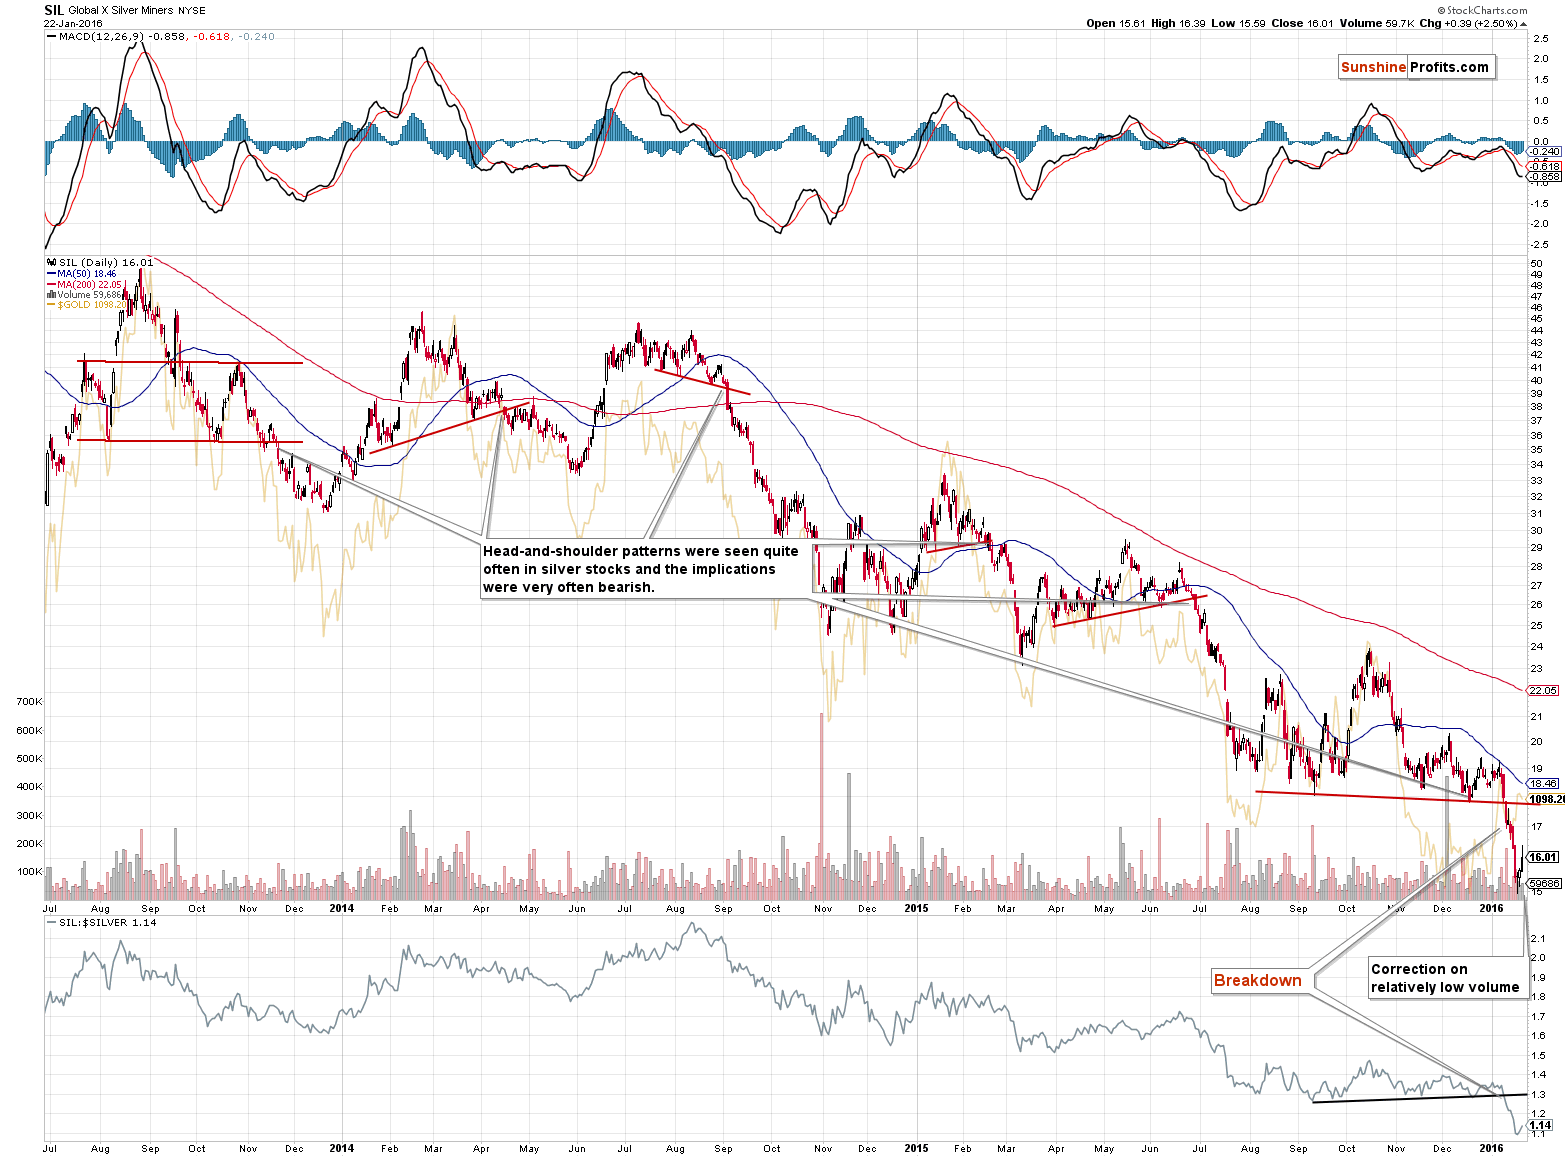
Just as bearish – silver stocks plunged recently and their reversal was relatively small compared to the size of the decline and – just like it was the case with the GDX ETF – silver miners moved higher in the final part of the previous week on relatively low volume.
Summing up, while it may seem that there were some bullish indications last week (the HUI moving back up), let’s keep in mind that there were definitely some additional bearish signs as well. Silver formed a reversal “shooting star” candlestick right before a turning point, gold stocks actually underperformed gold and the general stock market, and they didn’t invalidate the breakdown in terms of the weekly closing prices. Overall, the outlook was and still is bearish. In our opinion, the short position in the precious metals sector continues to be justified from the risk to reward point of view. The gains in the full short positions in mining stocks are already significant, but we think they will become much bigger before the trade is over and the same goes for profits on gold and silver short positions.
As always, we will keep you – our subscribers – updated.
To summarize:
Trading capital (our opinion): Short positions (full) in gold, silver and mining stocks are justified from the risk/reward perspective with the following stop-loss orders and initial target price levels:
- Gold: initial target price: $973; stop-loss: $1,143, initial target price for the DGLD ETN: $117.70; stop-loss for the DGLD ETN $74.28
- Silver: initial target price: $12.13; stop-loss: $14.83, initial target price for the DSLV ETN: $101.84; stop-loss for DSLV ETN $57.49
- Mining stocks (price levels for the GDX ETF): initial target price: $10.23; stop-loss: $15.47, initial target price for the DUST ETF: $31.90; stop-loss for the DUST ETF $10.61
In case one wants to bet on junior mining stocks' prices (we do not suggest doing so – we think senior mining stocks are more predictable in the case of short-term trades – if one wants to do it anyway, we provide the details), here are the stop-loss details and initial target prices:
- GDXJ ETF: initial target price: $15.23; stop-loss: $21.13
- JDST ETF: initial target price: $52.99; stop-loss: $21.59
Long-term capital (our opinion): No positions
Insurance capital (our opinion): Full position
Plus, you might want to read why our stop-loss orders are usually relatively far from the current price.
Please note that a full position doesn’t mean using all of the capital for a given trade. You will find details on our thoughts on gold portfolio structuring in the Key Insights section on our website.
As a reminder – “initial target price” means exactly that – an “initial” one, it’s not a price level at which we suggest closing positions. If this becomes the case (like it did in the previous trade) we will refer to these levels as levels of exit orders (exactly as we’ve done previously). Stop-loss levels, however, are naturally not “initial”, but something that, in our opinion, might be entered as an order.
Since it is impossible to synchronize target prices and stop-loss levels for all the ETFs and ETNs with the main markets that we provide these levels for (gold, silver and mining stocks – the GDX ETF), the stop-loss levels and target prices for other ETNs and ETF (among other: UGLD, DGLD, USLV, DSLV, NUGT, DUST, JNUG, JDST) are provided as supplementary, and not as “final”. This means that if a stop-loss or a target level is reached for any of the “additional instruments” (DGLD for instance), but not for the “main instrument” (gold in this case), we will view positions in both gold and DGLD as still open and the stop-loss for DGLD would have to be moved lower. On the other hand, if gold moves to a stop-loss level but DGLD doesn’t, then we will view both positions (in gold and DGLD) as closed. In other words, since it’s not possible to be 100% certain that each related instrument moves to a given level when the underlying instrument does, we can’t provide levels that would be binding. The levels that we do provide are our best estimate of the levels that will correspond to the levels in the underlying assets, but it will be the underlying assets that one will need to focus on regarding the sings pointing to closing a given position or keeping it open. We might adjust the levels in the “additional instruments” without adjusting the levels in the “main instruments”, which will simply mean that we have improved our estimation of these levels, not that we changed our outlook on the markets. We are already working on a tool that would update these levels on a daily basis for the most popular ETFs, ETNs and individual mining stocks.
Our preferred ways to invest in and to trade gold along with the reasoning can be found in the how to buy gold section. Additionally, our preferred ETFs and ETNs can be found in our Gold & Silver ETF Ranking.
As always, we'll keep you - our subscribers - updated should our views on the market change. We will continue to send out Gold & Silver Trading Alerts on each trading day and we will send additional Alerts whenever appropriate.
The trading position presented above is the netted version of positions based on subjective signals (opinion) from your Editor, and the Tools and Indicators.
As a reminder, Gold & Silver Trading Alerts are posted before or on each trading day (we usually post them before the opening bell, but we don't promise doing that each day). If there's anything urgent, we will send you an additional small alert before posting the main one.
=====
Latest Free Trading Alerts:
The Federal Open Market Committee meets this week. What can we expect from the Fed and how can it affect the gold market?
Gold Gains Ahead of January FOMC Meeting
=====
Hand-picked precious-metals-related links:
With Record Votes, 82% Of Retail Investors Bullish On Gold Next Week - Kitco Gold Survey
Gold Speculators Slightly Cut Back On Net Bullish Positions Last Week
Do GLD ETF gold inflows suggest a positive sentiment change?
Comparisons To 2008 Spark Gold’s Fear Trade
=====
In other news:
Market Did Work of Four Fed Rate Hikes, Morgan Stanley Says
There's a Giant Elephant at the Bank of England
Don't Forget the Irish When Looking at New Risks in Euro Region
Red flag: Oil company defaults are spiking
‘No Crisis’ Norway Holds Talks on Economic Cost of Oil's Plunge
BRICS unlikely to drive commodities demand
AmEx gets put through shredder. Stock plunges
Which investment strategy do you like best for 2016?
=====
Thank you.
Sincerely,
Przemyslaw Radomski, CFA
Founder, Editor-in-chief
Gold & Silver Trading Alerts
Forex Trading Alerts
Oil Investment Updates
Oil Trading Alerts

